BRIAN XAUUSD – ทองคำยังคงถือ POC แต่ 4,438 คือการทดสอบ BRIAN XAUUSD – ทองคำยังคงถือ POC แต่ 4,438 คือการทดสอบ
ทองคำกำลังพยายามสร้างแรงกระตุ้นขาขึ้นใหม่หลังจากปกป้องพื้นที่มูลค่าต่ำกว่า แต่ตลาดยังไม่สะอาดพอสำหรับการซื้อที่ก้าวร้าว
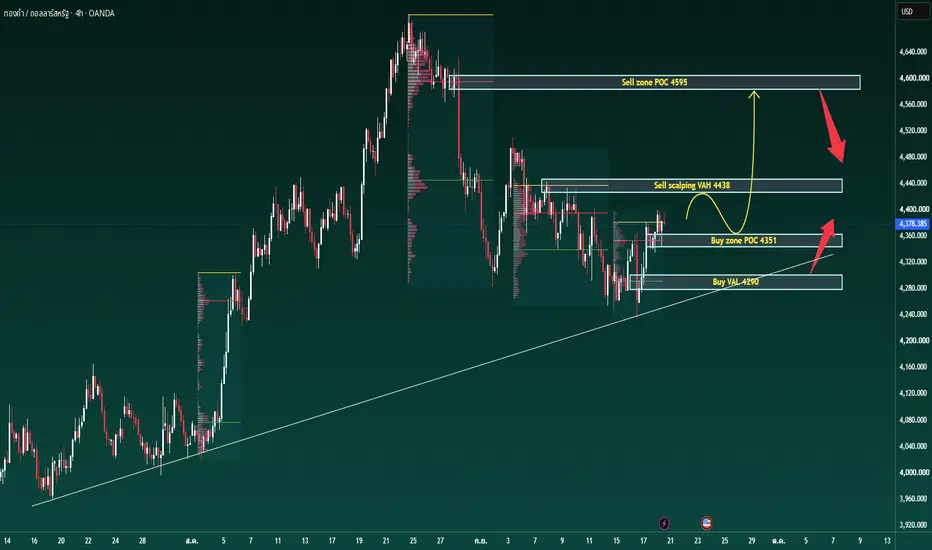
บนกราฟ H4 โครงสร้างที่ใหญ่กว่ายังคงแสดงให้เห็นว่าผู้ซื้อถืออยู่เหนือเส้นแนวโน้มที่เพิ่มขึ้นจากระยะสะสมก่อนหน้านี้ นี่เป็นสิ่งสำคัญเพราะทองคำยังไม่ทำลายฐานขาขึ้นที่ใหญ่กว่า อย่างไรก็ตาม ราคากำลังซื้อขายอยู่รอบ ๆ 4,378 หลังจากฟื้นตัวจากพื้นที่ Buy VAL 4,290 และ Buy zone POC 4,351
ปฏิกิริยาปัจจุบันเป็นบวก แต่ทองคำกำลังเข้าใกล้แนวต้านสำคัญแรก: ขาย scalping VAH รอบ ๆ 4,438
โครงสร้างทางเทคนิค
ทองคำเพิ่งกวาดลงไปในพื้นที่มูลค่า 4,290 จากนั้นฟื้นตัวอย่างแข็งแกร่งกลับขึ้นเหนือการสนับสนุน POC รอบ ๆ 4,351 นี่บอกฉันว่าผู้ซื้อยังคงมีบทบาทอยู่ใต้ตลาด
ฐานระยะสั้นที่สำคัญตอนนี้คือ 4,351 ตราบใดที่ราคาถืออยู่เหนือโซนนี้ โครงสร้างการฟื้นตัวยังคงมีผล
การทดสอบขาขึ้นแรกคือ 4,438 นี่คือแนวต้าน VAH และยังเป็นโซนปฏิกิริยาของผู้ขายที่เป็นไปได้ หากทองคำถึงระดับนี้และปฏิเสธ ราคาอาจหมุนกลับไปที่ 4,351 อีกครั้ง
หากผู้ซื้อทำลายและยอมรับเหนือ 4,438 เป้าหมายขาขึ้นหลักถัดไปจะกลายเป็นโซนขาย POC รอบ ๆ 4,595 นั่นคือแนวต้านที่ใหญ่กว่าจากพื้นที่ปริมาณสูงก่อนหน้านี้ และฉันคาดว่าจะมีแรงกดดันการขายที่แข็งแกร่งขึ้นที่นั่น
โซนสำคัญ
พื้นที่ราคาปัจจุบัน: 4,370 - 4,390
ทองคำกำลังฟื้นตัวแต่ยังต่ำกว่าแนวต้าน VAH หลัก
โซนซื้อ POC: 4,351
โซนป้องกันผู้ซื้อหลักสำหรับโครงสร้างปัจจุบัน
ซื้อ VAL: 4,290
การสนับสนุนมูลค่าลึกหากทองคำดึงกลับแรงขึ้น
ขาย scalping VAH: 4,438
แนวต้านแรกและโซนปฏิกิริยาผู้ขายระยะสั้น
โซนขาย POC: 4,595
แนวต้านบนหลักและพื้นที่สนใจผู้ขายที่ใหญ่กว่า
การสนับสนุนเส้นแนวโน้ม: โครงสร้างที่เพิ่มขึ้นต่ำกว่าราคาปัจจุบัน
ตราบใดที่ราคาถืออยู่เหนือเส้นแนวโน้มนี้ มุมมองการฟื้นตัวที่กว้างขึ้นยังคงมีชีวิต
สถานการณ์การซื้อขาย
มุมมองลำดับความสำคัญ: ปฏิกิริยาซื้อเหนือ 4,351
การเข้า:
มองหาตำแหน่งซื้อเฉพาะเมื่อทองคำถืออยู่เหนือ 4,351 และแสดงการปฏิเสธขาขึ้นที่ชัดเจนจากการสนับสนุน POC
หยุดขาดทุน:
ต่ำกว่าการกวาดต่ำในท้องถิ่นหรือต่ำกว่าโซนสนับสนุน 4,351
ทำกำไร:
TP1: 4,438
TP2: 4,500
TP3: 4,595 หากผู้ซื้อทำลายและยอมรับเหนือแนวต้าน VAH
การตั้งค่านี้เป็นไปตามโครงสร้างการฟื้นตัวขาขึ้นปัจจุบัน แต่ยังคงต้องการการยืนยัน การซื้อโดยตรงที่ 4,438 มีความเสี่ยงเพราะนั่นคือพื้นที่ปฏิกิริยาผู้ขายแรก
สถานการณ์ขายทางเลือก
หากทองคำถึง 4,438 และแสดงการปฏิเสธที่แข็งแกร่ง ปฏิกิริยาขายระยะสั้นอาจปรากฏขึ้น
การเข้า:
มองหาตำแหน่งขายเฉพาะเมื่อราคาปฏิเสธอย่างชัดเจนจาก 4,438 และไม่สามารถถืออยู่เหนือมันได้
หยุดขาดทุน:
เหนือการปฏิเสธสูง
ทำกำไร:
TP1: 4,351
TP2: 4,290 หากแรงกดดันขาลงขยายตัว
นี่จะเป็นการขายปฏิกิริยา ไม่ใช่การกลับตัวขาลงเต็มรูปแบบ เว้นแต่ทองคำจะทำลายต่ำกว่า 4,351 และสูญเสียเส้นแนวโน้มที่เพิ่มขึ้น
มุมมองสุดท้าย
ทองคำยังคงถือโครงสร้างมูลค่าขาขึ้น แต่การยืนยันถัดไปต้องมาจาก 4,438
สำหรับตอนนี้ แผนที่ของฉันง่าย:
ถือ 4,351 = ผู้ซื้อยังคงมีบทบาท
ทำลาย 4,438 = แรงกระตุ้นการฟื้นตัวดีขึ้น
ถึง 4,595 = การทดสอบแนวต้านหลัก
ปฏิเสธ 4,438 = ราคาหมุนกลับไปที่ 4,351
สูญเสีย 4,351 = การดึงกลับลึกไปที่ 4,290 เป็นไปได้
ทองคำไม่อ่อนแอขณะที่ยังคงอยู่เหนือ POC และเส้นแนวโน้มที่เพิ่มขึ้น แต่ก็ยังไม่สะอาดพอที่จะไล่ตามโดยตรงภายใต้แนวต้าน VAH
การตั้งค่าที่ดีที่สุดคือรอการยืนยัน: ไม่ว่าผู้ซื้อจะป้องกัน 4,351 เพื่อความต่อเนื่อง หรือผู้ขายจะปฏิเสธ 4,438 เพื่อการหมุนระยะสั้น
ทองคำจะทำลายเหนือ 4,438 และเปิดเส้นทางไปสู่ 4,595 หรือผู้ขายจะป้องกัน VAH ก่อน?  เพิ่มขึ้น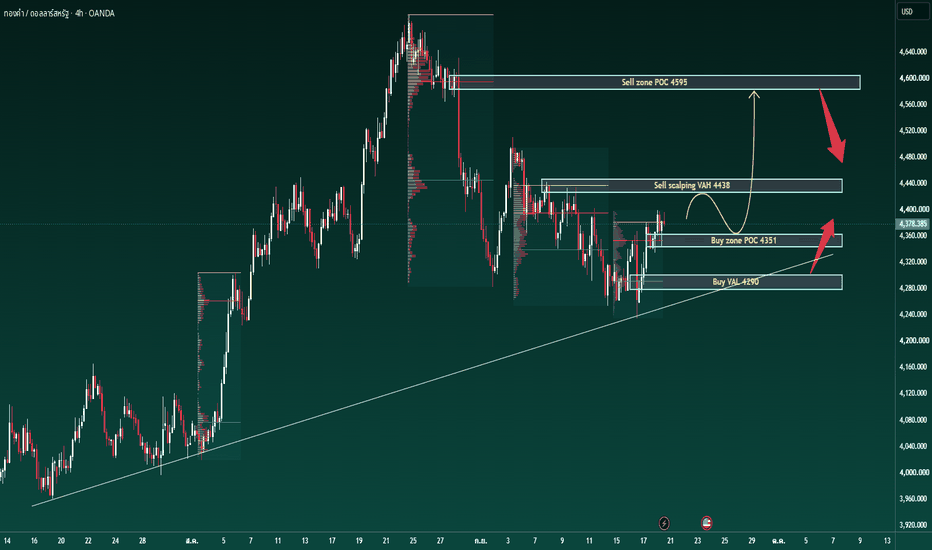
XAUUSD: 4,238 ถือแผนฟื้นตัวที่ใหญ่ขึ้น XAUUSD: 4,238 ถือแผนฟื้นตัวที่ใหญ่ขึ้น
บริบทตลาด
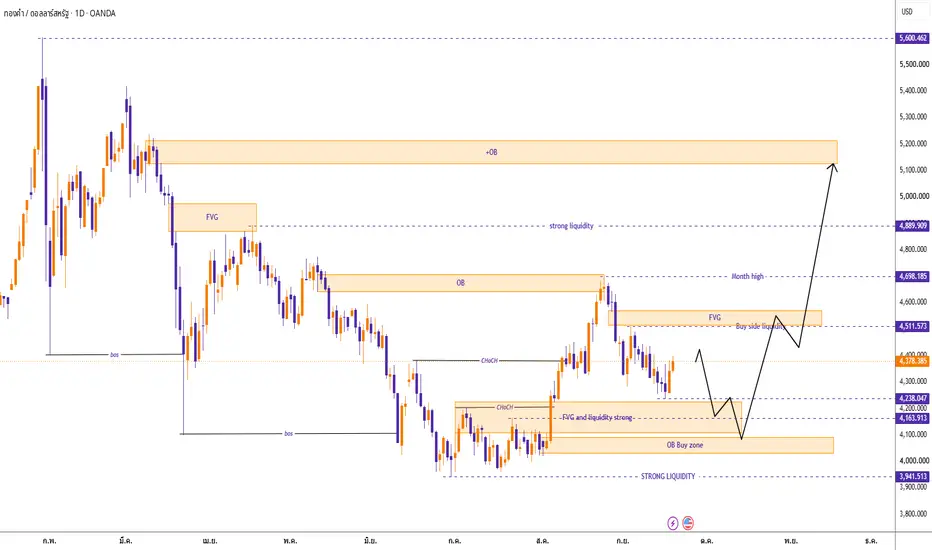
ทองคำกำลังพยายามสร้างการฟื้นตัวที่ใหญ่ขึ้นหลังจากตอบสนองจากฐานสภาพคล่องที่แข็งแกร่งใกล้ 3,941
กราฟรายวันไม่ได้แสดงแรงกดดันขาลงทางเดียวอีกต่อไป ราคาได้สร้างขาขึ้นที่ชัดเจน ฟื้นโครงสร้างที่สำคัญ และตอนนี้ถืออยู่เหนือโซนสะสมก่อนหน้า อย่างไรก็ตาม ตลาดยังไม่เต็มที่ในขาขึ้นจนกว่าผู้ซื้อจะเคลียร์อุปสรรคสภาพคล่องถัดไปด้านบน
ราคาปัจจุบันรอบ 4,378 อยู่ระหว่างการสนับสนุนการฟื้นตัวและพื้นที่ต้านทานพรีเมียมถัดไป ซึ่งหมายความว่าทองคำอาจต้องการการดึงกลับอีกครั้งก่อนที่จะพยายามขึ้นแรงครั้งถัดไป
โครงสร้างทางเทคนิค
เรื่องหลักง่าย ๆ: ทองคำได้เปลี่ยนจากการฟื้นตัวส่วนลดลึกไปสู่โครงสร้างการต่อเนื่องขาขึ้นที่เป็นไปได้
การสนับสนุนสำคัญแรกคือ 4,238 นี่คือระดับสภาพคล่องและปฏิกิริยาที่ใกล้ที่สุด หากราคาดึงกลับและถือพื้นที่นี้ ผู้ซื้ออาจใช้เป็นฐานสำหรับการดันขึ้นถัดไป
ต่ำกว่านั้น 4,163 เป็นการสนับสนุนสำคัญอีกจุดและโซนสภาพคล่อง FVG การสูญเสีย 4,163 จะทำให้โครงสร้างการฟื้นตัวอ่อนแอลงและอาจนำราคากลับไปสู่โซนซื้อ OB รอบ 4,050 - 4,100
เหนือราคาปัจจุบัน 4,511 เป็นเป้าหมายสภาพคล่องฝั่งซื้อหลักแรก การทะลุผ่านระดับนี้อย่างชัดเจนจะยืนยันว่าผู้ซื้อกำลังกลับมาควบคุม
ระดับขาขึ้นถัดไปคือ 4,698 จากนั้น 4,889 หากทองคำยังคงขยายตัวอย่างแข็งแกร่ง โซน OB ที่สูงขึ้นรอบ 5,100 - 5,200 จะกลายเป็นเป้าหมายพรีเมียมที่ใหญ่ขึ้น
ระดับสำคัญ
ราคาปัจจุบัน: 4,378
การสนับสนุนที่ใกล้ที่สุด: 4,238
FVG / การสนับสนุนสภาพคล่องที่แข็งแกร่ง: 4,163
โซนซื้อ OB: 4,050 - 4,100
สภาพคล่องฝั่งซื้อ: 4,511
สูงสุดเดือน: 4,698
เป้าหมายสภาพคล่องที่แข็งแกร่ง: 4,889
พรีเมียม OB ที่สูงขึ้น: 5,100 - 5,200
อ้างอิงสภาพคล่องหลัก: 5,600
แผนการซื้อขาย
สถานการณ์ซื้อหลัก
เข้า: 4,238 - 4,163 หลังจากยืนยันขาขึ้น
SL: ต่ำกว่า 4,100
TP: 4,511 / 4,698 / 4,889
เงื่อนไข: ทองคำดึงกลับเข้าสู่โซนสนับสนุน ถือโครงสร้าง และสร้างปฏิกิริยาขาขึ้นที่ชัดเจน ซึ่งจะแนะนำว่าผู้ซื้อกำลังปกป้องฐานการฟื้นตัว
สถานการณ์ซื้อทะลุ
เข้า: เหนือ 4,511 หลังจากทะลุและทดสอบใหม่
SL: ต่ำกว่า 4,380
TP: 4,698 / 4,889 / 5,100
เงื่อนไข: ราคาทะลุผ่านโซนสภาพคล่องฝั่งซื้อและถือเหนือมัน ซึ่งจะยืนยันการต่อเนื่องขาขึ้นที่แข็งแกร่งขึ้น
สถานการณ์ขายทางเลือก
เข้า: ต่ำกว่า 4,163 หลังจากแตกและทดสอบใหม่
SL: เหนือ 4,238
TP: 4,100 / 4,050 / 3,941
เงื่อนไข: ทองคำสูญเสียการสนับสนุน FVG และไม่สามารถฟื้นคืนได้ ซึ่งจะแสดงว่าผู้ซื้อกำลังสูญเสียโครงสร้างการฟื้นตัว
อคติรวม
ทองคำกำลังฟื้นตัว แต่การเคลื่อนไหวถัดไปขึ้นอยู่กับว่าราคาตอบสนองอย่างไรในรอบ 4,238 - 4,163
ตราบใดที่โซนนี้ยังคงถืออยู่ แผนฟื้นตัวที่ใหญ่ขึ้นยังคงมีผล โดยมีเป้าหมายขาขึ้นที่ 4,511, 4,698 และ 4,889
หากราคาทะลุต่ำกว่า 4,163 การฟื้นตัวจะอ่อนแอลงและทองคำอาจกลับไปยังโซนซื้อ OB ที่ลึกกว่า
วิธีที่ดีที่สุด: รอการยืนยันรอบการสนับสนุน อย่าไล่ตามกลาง การตั้งค่าที่ชัดเจนที่สุดมาจากการดึงกลับเข้าสู่ 4,238 - 4,163 หรือการทะลุเหนือ 4,511
ทองคำจะปกป้องฐานการฟื้นตัวและขึ้นต่อไปหรือไม่ หรือผู้ขายจะลากราคากลับเข้าสู่ความต้องการที่ลึกกว่า เพิ่มขึ้น 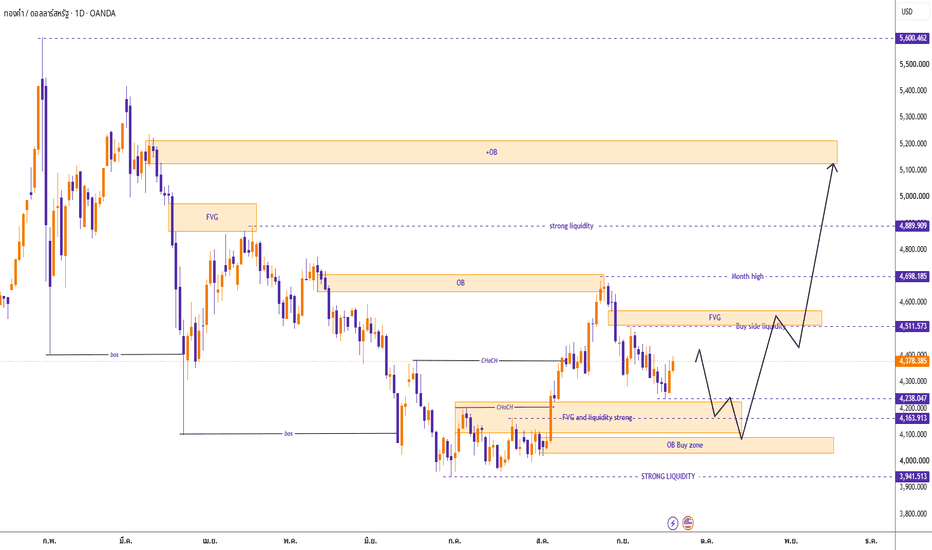
XAUUSD — 4510 คือจุดที่มันเริ่มสกปรก XAUUSD — 4510 คือจุดที่มันเริ่มสกปรก
ทองคำเด้งกลับ
แต่ยังไม่ใช่การควบคุมขาขึ้นที่ชัดเจน
ราคาตอบสนองจากพื้นที่ต่ำรอบ 4,235 - 4,280 แล้วดันกลับขึ้นเหนือ 4,350 การฟื้นตัวที่ดีใช่ไหม แต่ดูที่ราคาตอนนี้
อยู่ตรงกลาง
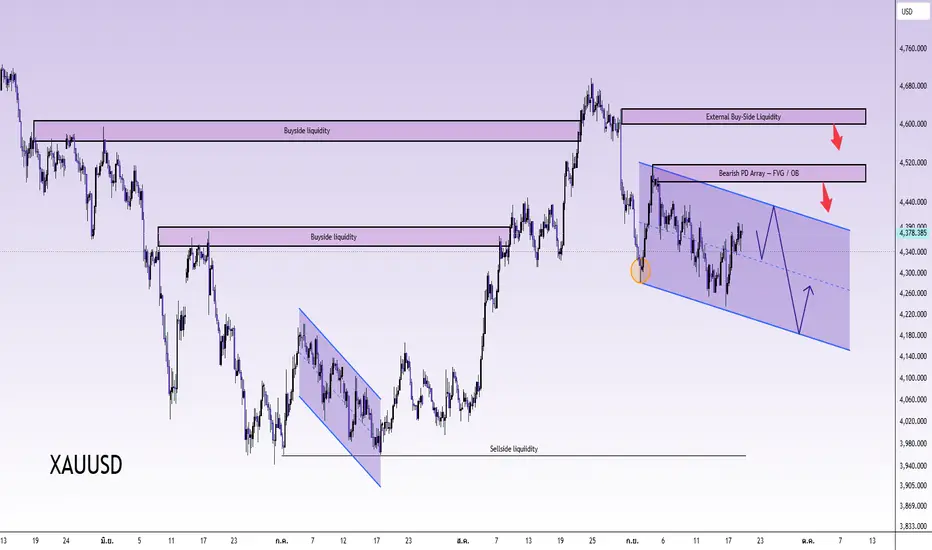
รอบ 4,378 ทองคำยังคงซื้อขายอยู่ในช่องการแก้ไขขาลง ซึ่งหมายความว่าฉันไม่ต้องการไล่ซื้อที่นี่ นี่คือจุดที่เทรดเดอร์ที่มาช้าส่วนใหญ่ติดกับดักคิดว่าการกลับตัวได้รับการยืนยันแล้ว
การทดสอบจริงอยู่สูงขึ้น
4,422 เป็นเส้นสภาพคล่องแรก หากทองคำทะลุผ่านนั้น ผู้ซื้ออาจตื่นเต้นอีกครั้ง แต่โซนที่ฉันสนใจคือ 4,480 - 4,520
พื้นที่นั้นคือ Bearish PD Array, FVG และโซน OB โดยพื้นฐานแล้วคือที่ที่ผู้ขายอาจโหลดใหม่หากราคาให้การปฏิเสธที่ชัดเจน
มุมมองหลักยังคงเป็นขาลงในขณะที่ทองคำถืออยู่ต่ำกว่า 4,520
โซนหลัก: 4,480 - 4,520
เป้าหมายการตอบสนอง: 4,300
เป้าหมายลึก: 4,180 - 4,150
การยกเลิก: การถือที่แข็งแกร่งเหนือ 4,520 - 4,550
ไอเดียการเทรดนั้นง่าย
หากทองคำพุ่งเข้าสู่ 4,480 - 4,520 และเริ่มปฏิเสธ ฉันจะมองหาการตอบสนองการขายกลับไปที่ 4,300 ก่อน
หากทองคำทะลุและถือเหนือ 4,520 ไอเดียขาลงก็จะอ่อนแอและราคาสามารถเริ่มไปถึงสภาพคล่องภายนอกที่ 4,590 - 4,620
ตอนนี้ดูเหมือนการฟื้นตัวเข้าสู่แนวต้าน ไม่ใช่การกลับตัวที่ชัดเจน
คุณคิดว่าทองคำดักผู้ซื้อที่ 4,510 หรือทะลุเข้าสู่สภาพคล่องที่ 4,600 ตรงๆ? เพิ่มขึ้น 
XAUUSD – ทองคำพยายามฟื้นตัวใต้เส้นแนวโน้มขาลง XAUUSD – ทองคำพยายามฟื้นตัวใต้เส้นแนวโน้มขาลง
ทองคำกำลังพยายามฟื้นตัวจากบริเวณจุดต่ำล่าสุด แต่ตลาดยังคงซื้อขายอยู่ในโครงสร้างขาลงที่กว้างกว่า
ราคาปัจจุบันอยู่บริเวณ 4,350 หลังจากเกิดแรงตอบสนองจากโซนแนวรับ 4,279 การเด้งขึ้นครั้งนี้แสดงให้เห็นว่าฝั่งซื้อกำลังป้องกันกรอบล่าง แต่การฟื้นตัวยังต้องการการยืนยัน เพราะทองคำยังคงอยู่ใต้เส้นแนวโน้มขาลงและต่ำกว่าแนวต้านถัดไป
จากมุมมองตลาด ทองคำยังคงเผชิญแรงกดดันจากความคาดหวังว่าเฟดอาจขึ้นดอกเบี้ยมากขึ้น อัตราผลตอบแทนพันธบัตรสหรัฐฯ ที่อยู่ในระดับสูง และดอลลาร์สหรัฐที่แข็งค่าขึ้น ความเสี่ยงทางภูมิรัฐศาสตร์อาจสร้างแรงซื้อสินทรัพย์ปลอดภัยระยะสั้นได้ แต่จนถึงตอนนี้ยังไม่แข็งแรงพอที่จะเปลี่ยนภาพทางเทคนิคกลับเป็นขาขึ้นอย่างชัดเจน
มุมมองทางเทคนิค:
ทองคำเกิดแรงตอบสนองจากบริเวณแนวรับ 4,279
ราคากำลังทดสอบโซนแนวต้าน 4,338 – 4,356
การฟื้นตัวระยะสั้นเริ่มดีขึ้น แต่ยังไม่ได้รับการยืนยัน
เส้นแนวโน้มขาลงยังคงเป็นด่านสำคัญเหนือราคาปัจจุบัน
การทะลุเหนือ 4,356 อย่างชัดเจนอาจเปิดทางไปยัง 4,378
หาก 4,378 ถูกทะลุ แนวต้านถัดไปคือ 4,416
หากทองคำล้มเหลวบริเวณ 4,338 – 4,356 ฝั่งขายอาจพยายามกดราคากลับลงไปยัง 4,315 และ 4,279
โซนราคาสำคัญ:
ราคาปัจจุบัน: 4,350
แนวรับหลัก: 4,279
แนวรับระยะสั้น: 4,315
แนวต้านปัจจุบัน: 4,338 – 4,356
แนวต้านถัดไป: 4,378
เป้าหมายด้านบน: 4,416
โซนยกเลิกแรงกดดันขาลง: เหนือ 4,416
สถานการณ์หลัก:
หากทองคำยืนเหนือ 4,315 และทะลุเหนือ 4,356 อย่างชัดเจน ฝั่งซื้ออาจดันการฟื้นตัวต่อไปยัง 4,378
การยืนยันขาขึ้นที่แข็งแรงกว่าจะเกิดขึ้นก็ต่อเมื่อราคาทะลุเส้นแนวโน้มขาลงและยืนเหนือ 4,378 ได้
หากเกิดขึ้น ทองคำอาจขยายตัวขึ้นไปยัง 4,416 ซึ่งเป็นบริเวณที่ฝั่งขายอาจกลับมาอีกครั้ง
สถานการณ์ทางเลือก:
หากทองคำถูกปฏิเสธจาก 4,338 – 4,356 และไม่สามารถยืนเหนือ 4,315 ได้ โครงสร้างการฟื้นตัวจะอ่อนแรงลง
ในกรณีนั้น ราคาอาจกลับลงไปยัง 4,279 การหลุดต่ำกว่า 4,279 อย่างชัดเจนจะเพิ่มแรงกดดันฝั่งขายอีกครั้ง และราคาอาจเคลื่อนไหวต่อในช่องขาลง
มุมมองของ Hannah:
ทองคำกำลังแสดงความพยายามฟื้นตัว แต่ยังไม่ใช่การกลับตัวเป็นขาขึ้นที่ชัดเจน
กราฟยังคงถูกควบคุมโดยเส้นแนวโน้มขาลง ดังนั้นฉันไม่ต้องการไล่ราคาขึ้นในขณะที่ราคากำลังอยู่ใกล้แนวต้าน ฝั่งซื้อต้องพิสูจน์แรงเหนือ 4,356 ก่อน
มุมมองหลัก: ทองคำสามารถฟื้นตัวไปยัง 4,378 และ 4,416 ได้ หาก 4,315 ยังยืนได้และ 4,356 ถูกทะลุ หากราคาถูกปฏิเสธจากโซนแนวต้านนี้ ฝั่งขายอาจกลับมาควบคุมอีกครั้งไปยัง 4,279 ไม่มีการยืนยัน = ไม่มีการเทรด
คุณคิดว่าทองคำจะทะลุเส้นแนวโน้มขาลงได้ในสัปดาห์นี้ หรือฝั่งขายจะป้องกัน 4,356 อีกครั้ง? เพิ่มขึ้น 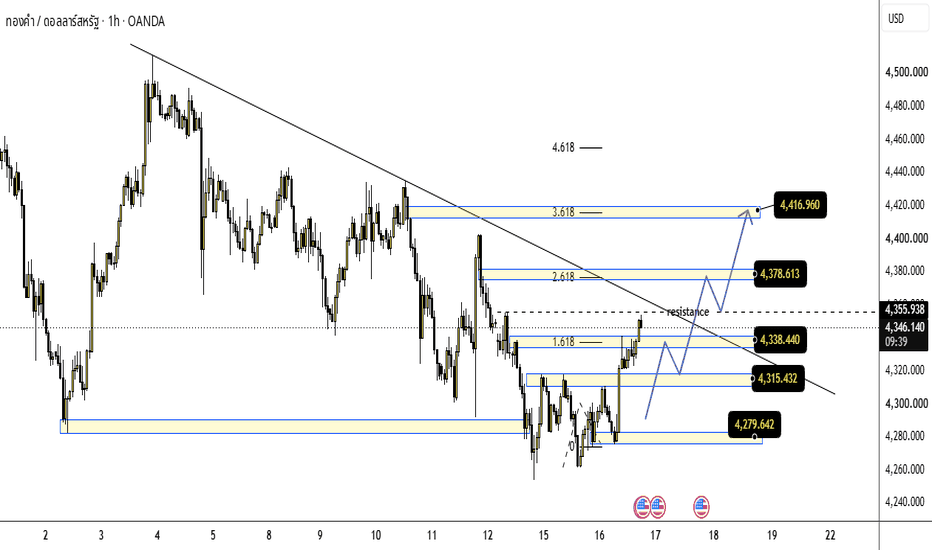
เพิ่มขึ้น 
Gold Plan: H1 Rebound to Untested supply form Bearish!!Here is the English translation of your Elliott Wave trading plan and article:
XAUUSD (1H) Technical Analysis & Trading Plan: Elliott Wave (1-5, A-C)
Elliott Wave Structure Overview
The 1-hour Gold (XAUUSD) chart is currently in Wave 5, aiming to complete the impulse wave before transitioning into an A-B-C Correction Wave. Key price levels are identified as follows:
Wave 4 Termination: Bottomed around 4,237.334 (the latest low where strong buying pressure pushed the price higher).
Wave 5 Target (Wave 5 Peak): 4,383.782 (major upper resistance level).
Correction Targets (A-B-C):
Wave A: Retracements down to test around 4,330.654
Wave B: Rebounds to test around 4,354.815
Wave C: Main downside expansion target at 4,296.660
Two-Phase Trading Plan
Phase 1: Buy Setup (Riding the Trend to Wave 5)
Strategy: Follow Buy on pullback opportunities to target the Wave 5 completion.
Entry Zone: Around 4,299.432
Take Profit (TP): 4,383.782 (Wave 5 target peak)
Risk Management: Place Stop Loss (SL) below the Wave 4 support level at 4,237.334
Phase 2: Sell Setup (Correction Phase A-B-C)
Strategy: Wait for price action reversal patterns around the Wave 5 peak to open counter-trend Sell positions during the correction.
Entry Zone: Around 4,354.815 (Wave B rebound peak)
Take Profit (TP): 4,296.660 (Wave C completion target)
Caution: Wait for a clear Price Action reversal confirmation around the resistance zone before placing the sell order.
Additional Recommendations
Trading based on Elliott Wave structures strictly requires confirmation signals (such as candlestick patterns or supplementary technical indicators) at key key levels. Always maintain proper Risk & Money Management tailored to your account size. เพิ่มขึ้น 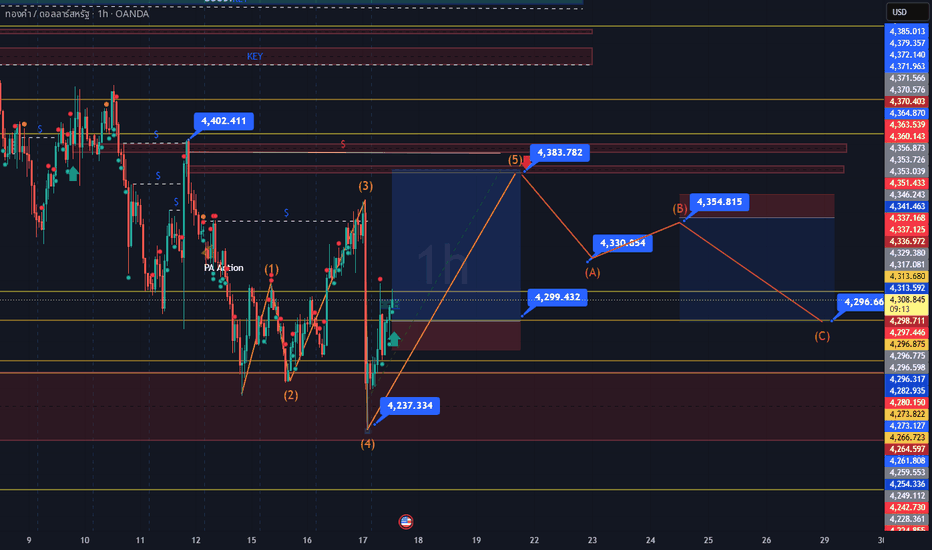
เพิ่มขึ้น 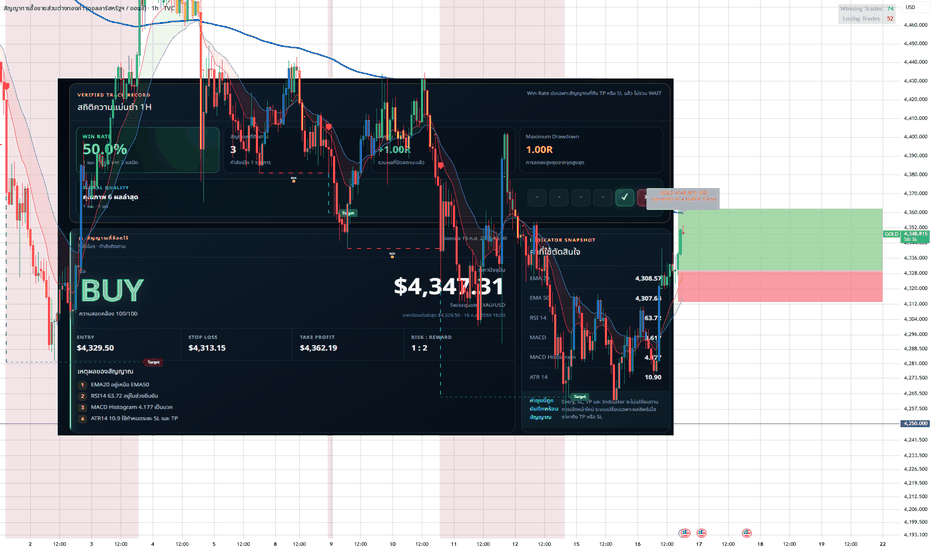
BRIAN XAUUSD – ทองคำยืนบนโซนมูลค่า การตัดสินใจของเฟดอาจเป็นตัวกรBRIAN XAUUSD – ทองคำยืนบนโซนมูลค่า การตัดสินใจของเฟดอาจเป็นตัวกระตุ้นการทะลุ
ทองคำเริ่มต้นสัปดาห์ใหม่ภายใต้แรงกดดันบริเวณ 4,330 - 4,340 หลังจากไม่สามารถสร้างการฟื้นตัวที่แข็งแรงจากโซนมูลค่าด้านล่างของสัปดาห์ก่อน
ภาพรวมมหภาคยังคงกดดันทองคำ เงินเฟ้อสหรัฐยังคงอยู่ในระดับสูงในเดือนสิงหาคม ทำให้ความเป็นไปได้ที่เฟดจะรักษาท่าทีทางนโยบายที่เข้มงวดในการประชุมเดือนกันยายนเพิ่มขึ้น และเมื่อการตัดสินใจอัตราดอกเบี้ยของเฟดจะเกิดขึ้นในวันพุธ ตลาดอาจยังไม่เคลื่อนไหวอย่างชัดเจนหากไม่มีการยืนยัน
ดังนั้นโครงสร้างตอนนี้ค่อนข้างยาก:
ทองคำอ่อนแรงในระยะสั้น
แต่ราคายังอยู่ใกล้แนวรับมูลค่า ไม่ใช่โซนขายที่สะอาด
สำหรับผม แผนหลักคือไม่ไล่ราคา ผมต้องการดูว่าผู้ซื้อสามารถป้องกันมูลค่าปัจจุบันได้หรือไม่ หรือผู้ขายจะกดหลุดฐานนี้และบังคับให้ราคาลงต่ออีกครั้ง
โครงสร้างทางเทคนิค
บนกราฟ H1 ทองคำซื้อขายอยู่บริเวณ POC / มูลค่าปัจจุบัน ใกล้ 4,325 - 4,335
นี่คือโซนตัดสินใจระยะสั้นที่สำคัญที่สุด ราคายังไม่ได้แสดงโมเมนตัมขาขึ้นที่แข็งแรง แต่ก็ยังไม่ได้เสียโครงสร้างมูลค่าด้านล่างทั้งหมด ตราบใดที่ทองคำยังยืนเหนือโซน POC นี้ การฟื้นตัวทางเทคนิคยังมีโอกาสเกิดขึ้นได้
โซนตอบสนองแรกของผู้ซื้ออยู่บริเวณ 4,364 นี่คือระดับที่ผู้ซื้อต้องยึดคืนโมเมนตัม หากทองคำทะลุเหนือ 4,364 และยืนได้ เป้าหมายถัดไปจะเป็น 4,436 ซึ่งเป็นระดับซื้อระยะสั้น และเป็นจุดตอบสนองสำคัญจากโครงสร้างก่อนหน้า
เหนือขึ้นไป แนวต้านหลักคือโซน VAH / HVN เดิม บริเวณ 4,490 - 4,510 นี่คือจุดที่แนวต้านจากปริมาณซื้อขายขนาดใหญ่เริ่มต้น หากทองคำขึ้นถึงบริเวณนี้ก่อนการตัดสินใจของเฟด ผมคาดว่าจะมีแรงขายแข็งแรงขึ้น หรืออย่างน้อยมีแรงทำกำไรหนัก
แนวต้านสูงสุดยังคงเป็น Composite VAH / แนวต้านมูลค่าด้านบนหลัก บริเวณ 4,620 - 4,640 นี่ยังไม่ใช่เป้าหมายทันที แต่เป็นกำแพงใหญ่ด้านบน หากทองคำทะลุแรงกดดันขาลงปัจจุบันได้อย่างชัดเจน
โซนสำคัญ
บริเวณราคาปัจจุบัน: 4,325 - 4,335
ทองคำกำลังยืนใกล้โซนตัดสินใจ POC ระยะสั้น
POC / มูลค่าปัจจุบัน: 4,320 - 4,335
แนวรับหลักของโครงสร้างปัจจุบัน หากหลุดโซนนี้ ผู้ซื้ออาจอ่อนแรงอีกครั้ง
VAL / มูลค่าด้านล่าง: 4,275 - 4,290
โซนมูลค่าด้านล่างถัดไป หากผู้ขายกดหลุด POC ปัจจุบัน
โซนซื้อ: 4,355 - 4,365
ระดับแรกที่ผู้ซื้อต้องยึดคืนเพื่อยืนยันความพยายามฟื้นตัว
ระดับซื้อระยะสั้น: 4,430 - 4,440
เป้าหมายตอบสนองด้านบนระยะสั้น หากผู้ซื้อกลับมาคุมตลาด
แนวต้าน VAH / HVN เดิม: 4,490 - 4,510
แนวต้านปริมาณสำคัญ และเป็นโซนที่ผู้ขายอาจกลับมาตอบสนอง
Composite VAH / แนวต้านมูลค่าด้านบนหลัก: 4,620 - 4,640
แนวต้านใหญ่ด้านบน หากทองคำทะลุแรงหลังการตัดสินใจของเฟด
แผนการเทรด
มุมมองหลัก: ซื้อจากแรงตอบสนอง เฉพาะเมื่อ 4,320 - 4,335 ยังยืนได้
จุดเข้า:
มองหาโอกาสซื้อเฉพาะเมื่อทองคำยืนโซน POC / มูลค่าปัจจุบันบริเวณ 4,320 - 4,335 และมีสัญญาณปฏิเสธขาลงที่ชัดเจน
จุดตัดขาดทุน:
ใต้จุดต่ำของการกวาดสภาพคล่องระยะสั้น หรือใต้ขอบล่างของโซนมูลค่าปัจจุบัน
จุดทำกำไร:
เป้าหมาย 1: 4,355 - 4,365
เป้าหมาย 2: 4,430 - 4,440
เป้าหมาย 3: 4,490 - 4,510 หากผู้ซื้อยึดโมเมนตัมกลับมาได้อย่างแข็งแรง
แผนนี้อิงจากแนวคิดว่าทองคำยังอยู่ที่แนวรับมูลค่า อย่างไรก็ตาม การยืนยันสำคัญมาก เพราะการตัดสินใจของเฟดอาจสร้างความผันผวนรุนแรง
แผนขายทางเลือก
หากทองคำหลุด 4,320 และไม่สามารถยึดคืนได้ ผมจะไม่ฝืนซื้อ
ในกรณีนั้น ราคาอาจหมุนลงสู่โซน VAL / มูลค่าด้านล่าง บริเวณ 4,275 - 4,290 นี่จะยืนยันว่าผู้ขายยังควบคุมการประมูลระยะสั้น
แผนขายจะสะอาดกว่า หากทองคำหลุดต่ำกว่า 4,320 จากนั้นกลับมาทดสอบ POC ที่เสียไปแล้วถูกปฏิเสธ
เป้าหมายการขาย:
เป้าหมาย 1: 4,290
เป้าหมาย 2: 4,275
เป้าหมาย 3: ลงต่อได้เฉพาะเมื่อโมเมนตัมจากเฟดสนับสนุนความแข็งแกร่งของดอลลาร์สหรัฐ
มุมมองสุดท้าย
ทองคำกำลังเริ่มต้นสัปดาห์ในตำแหน่งที่อ่อนไหว
ตลาดอยู่ใกล้แนวรับมูลค่าระยะสั้น ขณะที่นักเทรดกำลังรอการตัดสินใจอัตราดอกเบี้ยของเฟด เงินเฟ้อยังคงเป็นประเด็นกังวล และนั่นยังคงกดดันทองคำ แต่ในเชิงเทคนิค ราคายังไม่ได้หลุดลงอย่างชัดเจน
แผนที่สำคัญง่ายมาก:
ยืน 4,320 - 4,335 = ผู้ซื้อยังพยายามฟื้นตัวได้
ทะลุ 4,364 = แรงตอบสนองขาขึ้นดีขึ้น
ถึง 4,436 = เป้าหมายด้านบนแรก
ทะลุ 4,510 = การฟื้นตัวแข็งแรงขึ้น
หลุด 4,320 = เปิดทางลงสู่ 4,275 - 4,290
ตอนนี้ผมมองทองคำเป็นตลาดแห่งการตัดสินใจ ไม่ใช่ตลาดสำหรับไล่ราคา
จังหวะที่สะอาดที่สุดจะมาจากการยืนยันบริเวณ POC หากผู้ซื้อป้องกันได้ ทองคำอาจฟื้นตัวสู่ 4,364 และ 4,436 หากผู้ขายกดหลุด การประมูลถัดไปอาจลงไปยังโซนมูลค่าด้านล่าง ก่อนจะมีการฟื้นตัวที่แข็งแรงกว่า
ทองคำจะป้องกันมูลค่าปัจจุบันก่อนการตัดสินใจของเฟดได้หรือไม่ หรือผู้ขายจะบังคับให้ราคากวาดลงสู่มูลค่าด้านล่างอีกครั้ง? เพิ่มขึ้น 
ลดลง 
XAUUSD 4409 กลับมายืนได้ — 4509 กำลังรออยู่ XAUUSD 4409 กลับมายืนได้ — 4509 กำลังรออยู่
การยืนเหนือ 4,400 เริ่มมีความหมายแล้ว
ก่อนหน้านี้ทองดูหนักมาก ไม่ต้องสงสัยเลย ฝั่งขายกดราคาลงจากกรอบบน ทำลายโครงสร้าง แล้วลากราคาลงไปในโซน 4,330 - 4,370
แต่ตอนนี้ ราคาไม่ได้ดูตายแล้ว
เราเห็นช่องขาลงสั้น ๆ ถูกทำลาย ราคาเรียกคืนโซนสภาพคล่องฝั่งขายได้ แล้วเริ่มยืนแถว 4,409 - 4,424 นี่คือสัญญาณแรกว่าฝั่งซื้อกำลังพยายามสร้างฐานใหม่ตรงนี้
ยังไม่ใช่อิสระของฝั่งซื้อแบบเต็มตัว
แต่ปฏิกิริยารอบนี้สะอาดกว่าสัปดาห์ที่แล้ว
มุมมองหลักคือฟื้นตัวขาขึ้น ตราบใดที่ทองยังยืนเหนือ 4,372 - 4,338
ความอ่อนแอของ USD กำลังช่วยแรงเด้ง และกราฟก็แสดงให้เห็นว่าทองตอบสนองจากบริเวณ SMA 50 วัน RSI ยังเป็นบวก ดังนั้นฝั่งซื้อยังมีเหตุผลที่จะดันต่อ ปัญหาเดียวคืออะไร? ราคายังอยู่ใต้บริเวณ SMA 21 วัน ดังนั้นผมไม่อยากไล่ซื้อตามแบบมืด ๆ
ทางเดินง่ายมาก
ยืน 4,400 ให้ได้ ทะลุ 4,424 จากนั้น 4,455 มาก่อน ต่อด้วย 4,478 เป็นแรงดึงจากสภาพคล่องฝั่งซื้อ ถ้าฝั่งซื้อยังคุมเกมได้ 4,509 จะกลายเป็นแม่เหล็กจริง
แผนการเทรด:
แนวคิดซื้อจะเกิดขึ้นเฉพาะเมื่อทองยืนเหนือ 4,372 - 4,400 และทะลุ 4,424 ด้วยแท่งเทียนชัดเจน
โซนเข้า: 4,400 - 4,424 หลังมีการยืนยัน
โซนซื้อที่ลึกกว่า: 4,338 - 4,372 ถ้าราคากวาดลงแล้วกลับมายืนได้
จุดตัดขาดทุน: ต่ำกว่า 4,330
เป้าหมายที่ 1: 4,455
เป้าหมายที่ 2: 4,478
เป้าหมายที่ 3: 4,509
ไม่มีการเรียกคืนยืนยัน ก็ไม่ไล่ราคา ง่าย ๆ
ถ้าทองปิดแท่งแรงต่ำกว่า 4,330 แนวคิดฟื้นตัวนี้พังทันที จากนั้นฝั่งขายอาจลากราคากลับไปหา 4,280
ตอนนี้ผมอ่านว่า ฝั่งซื้อเรียกคืนพื้นที่ก่อน แล้วสภาพคล่อง 4,509 คือเป้าหมายถัดไป
คุณคิดว่าทองจะผ่าน 4,478 แบบสะอาด หรือกวาด 4,372 ก่อนแล้วค่อยบิน? เพิ่มขึ้น 
EOSE’s Incredible Rebound — Real Recovery or Just Another False No one knows whether this rally is the beginning of a true recovery or simply another cycle before the stock falls back toward $3. The risks are still there, and EOSE has repeatedly shown a pattern of sharp rallies followed by painful declines — making this rebound impossible to predict with certainty.
====================
The U.S. clean-energy and battery sector is facing increasing competition from China. While the U.S. continues to invest heavily in clean energy, Chinese companies have built significant advantages in areas such as battery manufacturing, solar cells, wind power, and large-scale energy storage. China’s rapid development of new energy-storage technologies — including emerging concepts such as balloon-based energy storage — highlights how quickly the industry is evolving.
This growing technological and manufacturing advantage could make some Chinese energy companies increasingly attractive to investors looking for the next major opportunity in the clean-energy market. For U.S. energy-storage stocks such as EOSE, the challenge is no longer simply proving that energy storage has a future — it is proving that American companies can compete effectively on technology, manufacturing costs, and scale.
If investors begin to believe that China is moving faster, capital could increasingly rotate toward Chinese energy companies, leaving U.S. names like EOSE under greater pressure. However, this also creates an interesting contrarian setup: if EOSE can eventually demonstrate competitive technology, improve margins, and secure large-scale projects, the market narrative could change very quickly.  ลดลง
ลดลง
XAUUSD 45M — โครงสร้างขาลงจากโซนแนวต้านทองคำกำลังเคลื่อนไหวบริเวณ 4,408 บนกราฟ 45 นาที โดยราคาได้ตอบสนองจากโซนแนวต้านบริเวณ 4,450–4,465 ซึ่งยังเป็นพื้นที่สำคัญบนกราฟ
หลังจากการปรับตัวลงก่อนหน้านี้ ราคาได้ฟื้นตัวขึ้น แต่เมื่อเข้าสู่โซนด้านบน ราคากลับเริ่มแสดงความอ่อนตัวและเคลื่อนตัวต่ำกว่าบริเวณ Swing ล่าสุด
ระดับ Fibonacci แสดงพื้นที่สำคัญบริเวณ 4,391, 4,367 และ 4,343 ส่วนโซนด้านล่างบริเวณ 4,290–4,315 เป็นอีกพื้นที่ที่ควรจับตาหากโครงสร้างขาลงยังคงดำเนินต่อไป
ตามสถานการณ์ที่แสดงบนกราฟ 4,204 เป็นอีกหนึ่งพื้นที่อ้างอิงด้านล่าง ขณะที่โซน 4,450–4,465 ยังคงเป็นพื้นที่สำคัญสำหรับติดตามโครงสร้างของราคา ลดลง 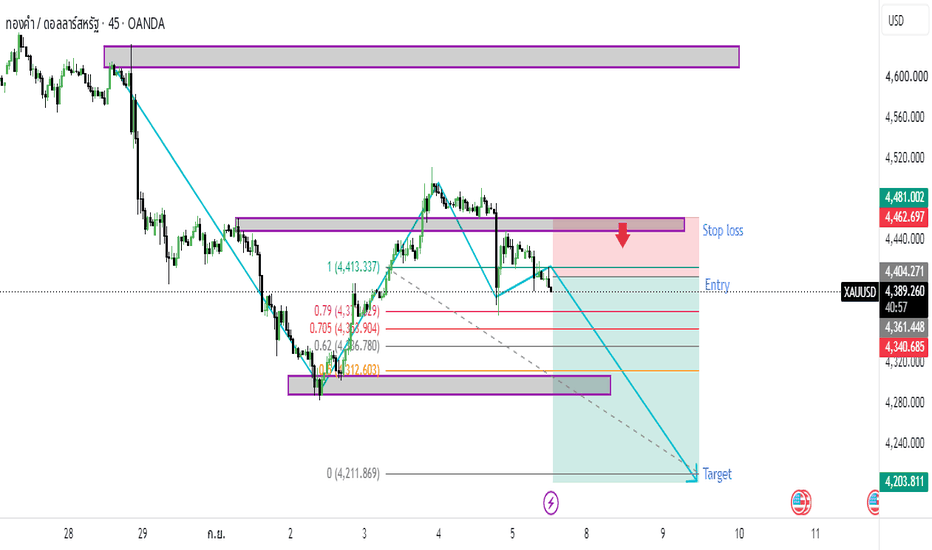
XAUUSD 4414 ติดอยู่ — 4282 กวาดก่อน? XAUUSD 4414 ติดอยู่ — 4282 กวาดก่อน?
การเปิดวันจันทร์นั้นยุ่งเหยิงแล้ว
ทองคำอยู่รอบๆ 4,414 ใต้โซน FVG เล็กๆ และใช่ มันสำคัญ ราคาพยายามฟื้นตัวจากฐาน 4,281 - 4,330 เมื่อสัปดาห์ที่แล้ว ดันเข้าไปในช่องทางที่เพิ่มขึ้นนั้น แล้วล้มเหลวรอบๆ 4,490 และแตกกลับลงมา
ไม่สะอาดสำหรับผู้ซื้อ
FVG เหนือ 4,425 - 4,460 เป็นปัญหาตอนนี้ ถ้าราคาไม่สามารถยึดพื้นที่นั้นได้ การดีดตัวนี้ก็เป็นเพียงการทดสอบที่อ่อนแออีกครั้ง ผู้ซื้อที่มาช้าซื้อกลางๆ อาจติดกับดักได้เร็ว
แนวโน้มหลักคือการต่อเนื่องขาลงในขณะที่ทองคำอยู่ต่ำกว่า 4,460
กราฟชี้ไปที่สภาพคล่องฝั่งขายก่อน 4,364 เป็นการดึงครั้งแรก ต่ำกว่านั้น 4,329 เป็นกระเป๋าต่อไป ถ้าผู้ขายยังคงกดดัน 4,282 เป็นโซนกวาดที่ลึกกว่า นั่นคือที่ที่ฉันจะเริ่มให้ความสนใจต่อปฏิกิริยา ไม่ใช่ก่อน
ดังนั้นแผนง่ายๆ อย่าไล่ตามต่ำ ปล่อยให้ราคาทดสอบ FVG และปฏิเสธ หรือแตก 4,364 อย่างสะอาด
สถานการณ์การซื้อขาย:
ไอเดียขายเฉพาะถ้าทองคำปฏิเสธ 4,425 - 4,460 ด้วยแท่งเทียนอ่อนแอ
โซนเข้า: 4,425 - 4,460 หลังจากปฏิเสธ
ทางเลือกเข้า: ต่ำกว่า 4,364 หลังจากยืนยันการแตก
หยุดขาดทุน: เหนือ 4,490
TP1: 4,364
TP2: 4,329
TP3: 4,282
ไม่มีการปฏิเสธ ไม่มีการขาย ไม่มีการแตก ไม่มีการไล่ตาม
การซื้อสั้นเฉพาะถ้าราคากวาด 4,329 - 4,282 และยึดคืนได้เร็ว นั่นคือการซื้อขายปฏิกิริยา ไม่ใช่แนวโน้มหลัก
ถ้าทองคำปิดแข็งแกร่งเหนือ 4,490 ไอเดียขาลงนี้จะถูกทำลาย แล้วผู้ซื้อสามารถสร้างใหม่ไปที่ 4,530
ตอนนี้ ฉันอ่านว่านี่คือการปฏิเสธ FVG ก่อน สภาพคล่องฝั่งขายต่อไป
คุณคิดว่าทองคำกวาด 4,282 ก่อนที่ผู้ซื้อจะตื่น? ลดลง 
XAUUSD 4429 รีเซ็ต — 4472 เหยื่อแรก XAUUSD 4429 รีเซ็ต — 4472 เหยื่อแรก
การปฏิเสธจาก 4,695 เปลี่ยนอารมณ์ทั้งหมด
ทองคำมีการขึ้นใหญ่ บีบสะอาด ผู้ซื้อแข็งแกร่ง จากนั้นราคากระทบพื้นที่บนและเริ่มทิ้งอย่างหนัก ไม่มีการดึงกลับนุ่มนวล เป็นการล้างจริง
ตอนนี้ราคาพยายามสร้างใหม่รอบ 4,429 หลังจากเด้งจากพื้นที่ 4,368 นั่นสำคัญ แต่ฉันยังไม่เรียกว่าควบคุมขาขึ้นเต็มที่
นี่เหมือนการฟื้นตัวภายในโครงสร้างที่เสียหาย
ระดับสำคัญตอนนี้คือ 4,368 นั่นคือโซนปฏิกิริยาด้านล่าง หากทองคำยืนเหนือมัน ผู้ซื้อยังสามารถดันเพื่อฟื้นตัวระยะสั้นไปที่ 4,472 ระดับนั้นคือโซนกับดักแรก ปฏิกิริยาก่อนหน้า ความไม่สมดุลเล็กน้อย สถานที่สะอาดสำหรับราคาทดสอบผู้ขายอีกครั้ง
แนวโน้มหลักคือการฟื้นตัวขาขึ้นระยะสั้นขณะที่ 4,368 ยังคงอยู่
แต่ใช่ อย่ารู้สึกสบายใจเกินไป
โครงสร้างใหญ่หลังจาก 4,695 ยังคงหนัก หากทองคำดันเข้าไปที่ 4,472 และเริ่มปฏิเสธ ผู้ขายสามารถตีอีกครั้ง ขึ้นไปสูงขึ้น พื้นที่ 4,560 - 4,600 คือที่ที่ฉันจะให้ความสนใจอย่างจริงจัง โซนนั้นไม่ใช่การซื้อแบบตาบอด นั่นคือที่ที่ผู้ซื้อที่ติดกับดักจากการลดลงครั้งสุดท้ายอาจเริ่มถูกทดสอบ
สถานการณ์การซื้อขาย:
ไอเดียซื้อเฉพาะเมื่อทองคำยืนเหนือ 4,368 และยึดคืน 4,430 ด้วยแท่งเทียนสะอาด
โซนเข้า: 4,368 - 4,430 หลังการยืนยัน
หยุดขาดทุน: ต่ำกว่า 4,320
TP1: 4,472
TP2: 4,520
TP3: 4,580
ไม่มีการยืนเหนือ 4,368 ไม่มีการซื้อ ง่ายๆ
หากทองคำแตกกลับต่ำกว่า 4,368 ด้วยแรงกดดัน ไอเดียฟื้นตัวนี้ก็จบ จากนั้นราคาสามารถเลื่อนไปที่ 4,300 และการเด้งกลายเป็นเพียงกับดักอีกครั้ง
ตอนนี้ ฉันอ่านว่านี่คือการขายออกก่อน พยายามฟื้นตัวที่สอง 4,472 คือเหยื่อ
คุณคิดว่าทองคำเคลียร์ 4,472 หรือผู้ขายตีมันที่นั่นอีกครั้ง? เพิ่มขึ้น 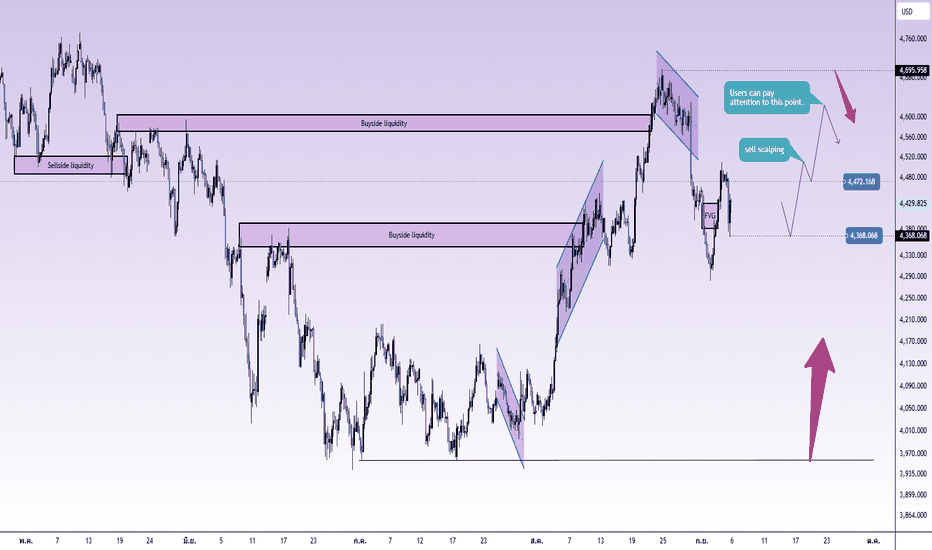
XAUUSD: การฟื้นตัวในวันศุกร์ แต่ 4,511 XAUUSD: การฟื้นตัวในวันศุกร์ แต่ 4,511 คือโซนกับดัก
บริบทของตลาด
ทองคำกำลังสิ้นสุดสัปดาห์ด้วยความพยายามฟื้นตัวอย่างแข็งแกร่งหลังจากการลดลงอย่างรวดเร็วไปที่ 4,302 ผู้ซื้อมีการตอบสนองอย่างชัดเจนจากโซนสภาพคล่องที่ต่ำกว่า แต่ตลาดกำลังเข้าใกล้พื้นที่ที่ผู้ขายอาจพยายามกลับมาควบคุมอีกครั้ง
การซื้อขายในวันศุกร์มักจะอ่อนไหว สภาพคล่องอาจบางลง ราคาสามารถเคลื่อนไหวอย่างรุนแรง และการทะลุในช่วงปลายสัปดาห์มักจะกลายเป็นกับดักหากเกิดขึ้นโดยไม่มีการยืนยันที่แข็งแกร่ง
เรื่องหลักนั้นง่าย: ทองคำได้ฟื้นตัว แต่ยังไม่หลุดพ้นจากโครงสร้างขาลงอย่างเต็มที่
โครงสร้างทางเทคนิค
ทองคำสร้างการฟื้นตัวอย่างแข็งแกร่งจากพื้นที่สภาพคล่องฝั่งขายที่ 4,302 และเปลี่ยนเป็นการแก้ไขขาขึ้นระยะสั้น
การฟื้นตัวล่าสุดทำลายโครงสร้างย่อยและดันราคากลับไปที่ 4,480 อย่างไรก็ตาม ราคาตอนนี้อยู่ต่ำกว่าเส้นแนวโน้มขาลงและจุดสูงสุดที่ 4,511 นี่คือพื้นที่การปฏิเสธหลักสำหรับผู้ขาย
การสนับสนุนแรกที่ต้องจับตามองคือโซนซื้อ OB รอบ 4,420 - 4,430 หากทองคำดึงกลับเข้าสู่โซนนี้และผู้ซื้อปกป้องได้ การฟื้นตัวสามารถดำเนินต่อไปที่ 4,500 - 4,511
แต่ถ้าทองคำถึง 4,500 - 4,511 และไม่สามารถทะลุเส้นแนวโน้มได้ พื้นที่นี้อาจกลายเป็นกับดักขาขึ้น การปฏิเสธที่นั่นอาจส่งราคากลับไปที่ 4,430 แล้ว 4,375 - 4,385
โซนซื้อ OB ที่ลึกกว่ารอบ 4,370 - 4,385 ยังคงมีความสำคัญ การสูญเสียโซนนี้จะทำให้การฟื้นตัวอ่อนแอลงและเปิดประตูสำหรับการทดสอบอีกครั้งที่ 4,302
ระดับสำคัญ
ราคาปัจจุบัน: 4,482
โซนขายเส้นแนวโน้ม: 4,500 - 4,511
จุดสูงสุดระยะสั้น: 4,511
โซนซื้อ OB แรก: 4,420 - 4,430
โซนซื้อ OB รอง: 4,370 - 4,385
สภาพคล่องฝั่งขาย: 4,302
การต่อเนื่องขาขึ้น: เหนือ 4,511
การปฏิเสธขาลง: ต่ำกว่า 4,420
แผนการซื้อขาย
สถานการณ์การซื้อหลัก
จุดเข้า: 4,420 - 4,430 หลังจากการยืนยันขาขึ้น
SL: ต่ำกว่า 4,390
TP: 4,480 / 4,500 / 4,511
เงื่อนไข: ราคาดึงกลับเข้าสู่โซนซื้อ OB แรกและแสดงการปฏิเสธขาขึ้นอย่างชัดเจน หากผู้ซื้อปกป้องพื้นที่นี้ได้ ทองคำสามารถพยายามดันขึ้นอีกครั้งไปที่เส้นแนวโน้ม
สถานการณ์การซื้อทะลุ
จุดเข้า: เหนือ 4,511 หลังจากการทะลุและทดสอบใหม่
SL: ต่ำกว่า 4,470
TP: 4,540 / 4,580 / 4,620
เงื่อนไข: ผู้ซื้อต้องทะลุเส้นแนวโน้มขาลงและยืนเหนือ 4,511 การทดสอบใหม่ที่สะอาดเหนือระดับนี้จะยืนยันว่าการฟื้นตัวไม่ใช่แค่การแก้ไข
สถานการณ์การตอบสนองการขาย
จุดเข้า: 4,500 - 4,511 หลังจากการยืนยันขาลง
SL: เหนือ 4,540
TP: 4,430 / 4,385 / 4,370
เงื่อนไข: หากทองคำถึงโซนขายเส้นแนวโน้มและถูกปฏิเสธ ผู้ขายอาจใช้พื้นที่นี้เพื่อดักผู้ซื้อปลายก่อนที่จะดันราคาลงอีกครั้ง
การตอบสนองการซื้อที่ลึก
จุดเข้า: 4,370 - 4,385 หลังจากการยืนยันขาขึ้นที่แข็งแกร่ง
SL: ต่ำกว่า 4,340
TP: 4,430 / 4,480 / 4,511
เงื่อนไข: หากการสนับสนุนแรกไม่สำเร็จ โซนซื้อ OB ที่ลึกกว่านี้จะกลายเป็นพื้นที่ถัดไปที่ผู้ซื้ออาจพยายามปกป้องโครงสร้างการฟื้นตัว
อคติทั่วไป
ทองคำกำลังฟื้นตัว แต่การฟื้นตัวยังไม่ได้รับการยืนยันจนกว่าราคาจะทะลุ 4,511
ตราบใดที่ราคายังอยู่ต่ำกว่าเส้นแนวโน้มขาลง ตลาดยังสามารถสร้างการปฏิเสธและเปลี่ยนการเคลื่อนไหวปัจจุบันให้กลายเป็นกับดักขาขึ้น
หาก 4,420 - 4,430 ยังคงอยู่ ผู้ซื้อยังมีโอกาสดันขึ้นสูงกว่า หาก 4,511 ทะลุและยืนอยู่ การฟื้นตัวขาขึ้นจะเข้มแข็งขึ้น แต่ถ้า 4,420 ล้มเหลว ทองคำอาจกลับไปที่ 4,370 - 4,385 และต่ำกว่านั้น 4,302 จะกลายเป็นเป้าหมายสภาพคล่องหลักถัดไป
วิธีที่ดีที่สุดสำหรับวันศุกร์: อย่าไล่ตามการเคลื่อนไหว รอให้มีการดึงกลับเข้าสู่การสนับสนุนที่ชัดเจนหรือการทะลุที่ยืนยันเหนือ 4,511
ทองคำจะทะลุเส้นแนวโน้มก่อนปิดสัปดาห์หรือไม่ หรือผู้ขายจะใช้ 4,511 เพื่อดักผู้ซื้ออีกครั้ง? ลดลง 
XAUUSD – ทองคำยังคงฟื้นตัว, 4,600 เป็นการทดสอบถัดไป XAUUSD – ทองคำยังคงฟื้นตัว, 4,600 เป็นการทดสอบถัดไป
ทองคำแสดงการฟื้นตัวที่แข็งแกร่งขึ้นหลังจากการขายที่รุนแรงในช่วงสิ้นเดือนสิงหาคม
ราคาตอนนี้ซื้อขายอยู่รอบ ๆ 4,484 หลังจากที่ดีดตัวขึ้นอย่างชัดเจนจากพื้นที่ต่ำใกล้ 4,290 – 4,320 การฟื้นตัวนี้สำคัญเพราะผู้ซื้อสามารถดันราคากลับขึ้นเหนือโครงสร้างฟีโบนัชชี่ระยะสั้นและตอนนี้ถืออยู่ใกล้จุดสูงสุดของวันรอบ ๆ 4,511
อย่างไรก็ตาม ทองคำยังไม่เป็นอิสระ
แนวต้านหลักยังคงอยู่เหนือราคาปัจจุบัน โดยเฉพาะรอบ ๆ 4,539 และ 4,600 นี่คือโซนที่ผู้ขายอาจพยายามป้องกันโครงสร้างขาลงก่อนหน้า
มุมมองทางเทคนิค:
ทองคำฟื้นตัวอย่างแข็งแกร่งจากจุดต่ำสุดล่าสุดใกล้ 4,290
ราคาตอนนี้กำลังรวมตัวอยู่ใต้จุดสูงสุดของวันรอบ ๆ 4,511
แนวรับที่ใกล้ที่สุดคือโซนคำสั่งซื้อฟีโบนัชชี่รอบ ๆ 4,421
ตราบใดที่ทองคำยังคงอยู่เหนือ 4,421 โครงสร้างการฟื้นตัวระยะสั้นยังคงมีผล
แนวต้านแรกคือ 4,539
หากผู้ซื้อทะลุเหนือ 4,539 ทองคำอาจเดินหน้าต่อไปยังโซนขายสภาพคล่องรอบ ๆ 4,600
การปฏิเสธจาก 4,539 หรือ 4,600 อาจสร้างการดึงกลับอีกครั้งก่อนที่จะดำเนินการต่อ
ระดับสำคัญที่ต้องจับตามอง:
ราคาปัจจุบัน: 4,484
จุดสูงสุดของวัน: 4,511
โซนคำสั่งซื้อฟีโบนัชชี่: 4,421
โซนขายสเกลปิ้ง: 4,539
แนวต้านสภาพคล่องหลัก: 4,600
สถานการณ์หลัก:
หากทองคำดึงกลับไปที่ 4,421 และเกิดปฏิกิริยาขาขึ้น ผู้ซื้ออาจพยายามดันราคากลับไปที่ 4,539 ก่อน
หาก 4,539 ทะลุด้วยความแข็งแกร่ง เป้าหมายถัดไปคือ 4,600
สถานการณ์ทางเลือก:
หากทองคำไม่สามารถถือเหนือ 4,421 โครงสร้างการฟื้นตัวจะอ่อนแอลง
ในกรณีนั้น ราคาอาจทดสอบพื้นที่แนวรับต่ำรอบ ๆ 4,380 – 4,350 ก่อนที่ผู้ซื้อจะกลับมา
มุมมองของฮันนาห์:
ทองคำฟื้นตัวได้ดี แต่ราคาตอนนี้กำลังเคลื่อนเข้าสู่พื้นที่แนวต้านที่อ่อนไหว
ฉันไม่ต้องการไล่ตามตลาดโดยตรงใต้แนวต้าน แผนที่ชัดเจนกว่าคือรอการดึงกลับไปที่ 4,421 หรือการทะลุยืนยันเหนือ 4,539
มุมมองหลัก: การฟื้นตัวยังคงมีผลตราบใดที่ทองคำยังคงอยู่เหนือ 4,421 การทะลุที่แข็งแกร่งเหนือ 4,539 เปิดทางไปยัง 4,600 ไม่มีการยืนยันหมายถึงไม่มีการซื้อขาย
คุณคิดว่าทองคำจะทะลุ 4,539 วันนี้หรือไม่ หรือผู้ขายจะสร้างการดึงกลับอีกครั้งก่อน? เพิ่มขึ้น 
BRIAN XAUUSD – ทองคำยังคงมีมูลค่า, 4,596 คือแม่เหล็กถัดไป BRIAN XAUUSD – ทองคำยังคงมีมูลค่า, 4,596 คือแม่เหล็กถัดไป
ทองคำแสดงโครงสร้างการฟื้นตัวที่ชัดเจนขึ้นหลังจากการขายที่รุนแรงจากพื้นที่มูลค่าสูงก่อนหน้า
การแตกหักก่อนหน้านี้ดันราคาลงลึกเข้าสู่พื้นที่มูลค่าต่ำใกล้ 4,300 แต่ผู้ซื้อมีปฏิกิริยาตอบสนองอย่างแข็งแกร่งและสร้างแรงผลักดันใหม่จากฐานนั้น ตอนนี้ทองคำซื้อขายอยู่รอบ 4,480 ถืออยู่เหนือพื้นที่มูลค่าระยะสั้นและพยายามที่จะสร้างเสถียรภาพก่อนการเคลื่อนไหวทิศทางถัดไป
จากกราฟ นี่ไม่ใช่การต่อเนื่องของขาลงที่บริสุทธิ์อีกต่อไป ตลาดได้สร้างขาขึ้นที่แข็งแกร่งแล้ว และการรวมตัวปัจจุบันดูเหมือนเป็นช่วงการสร้างมูลค่าก่อนการผลักดันขึ้นอีกครั้ง
อย่างไรก็ตาม ราคายังไม่เป็นอิสระ การต้านทานหลักด้านบนยังคงชัดเจนมาก
โครงสร้างทางเทคนิค
บนกราฟ H2 ทองคำฟื้นตัวอย่างแข็งแกร่งจากฐานล่างและตอนนี้ถืออยู่รอบ 4,470 - 4,485
โครงสร้างผู้ซื้อปัจจุบันนั่งอยู่เหนือโซน POC ซื้อรอบ 4,429 นี่คือการสนับสนุนระยะสั้นที่สำคัญ ตราบใดที่ทองคำถืออยู่เหนือ 4,429 ผู้ซื้อยังคงควบคุมโครงสร้างการฟื้นตัว
โซน VAH ซื้อรอบ 4,450 - 4,460 ตอนนี้เป็นโซนปฏิกิริยาแรก หากราคาดึงกลับเข้าสู่พื้นที่นี้และถืออยู่ อาจให้ผู้ซื้อมีการตั้งค่าการต่อเนื่องอีกครั้ง
เป้าหมายด้านบนคือโซน POC ขายรอบ 4,590 - 4,600 โซนนี้เป็นพื้นที่มูลค่าการกระจายก่อนหน้า ดังนั้นจึงมีแนวโน้มที่จะดึงดูดราคาหากแรงผลักดันขาขึ้นยังคงดำเนินต่อไป แต่ก็อาจกลายเป็นโซนปฏิกิริยาผู้ขายที่แข็งแกร่งเมื่อราคาถึง
โซนสำคัญ
พื้นที่ราคาปัจจุบัน: 4,470 - 4,485
ทองคำกำลังรวมตัวหลังจากการเคลื่อนไหวฟื้นตัวที่แข็งแกร่ง
VAH ซื้อ: 4,450 - 4,460
โซนปฏิกิริยาผู้ซื้อระยะสั้นแรก
โซน POC ซื้อ: 4,425 - 4,435
พื้นที่ป้องกันผู้ซื้อหลัก
โซน POC ขาย: 4,590 - 4,600
เป้าหมายด้านบนหลักและโซนปฏิกิริยาขายที่เป็นไปได้
ฐานฟื้นตัวต่ำกว่า: 4,300 - 4,320
พื้นที่ที่ผู้ซื้อสร้างการฟื้นตัวที่แข็งแกร่งล่าสุด
สถานการณ์การซื้อขาย
มุมมองสำคัญ: รอปฏิกิริยาซื้อจาก 4,429 - 4,460
การเข้า:
มองหาตำแหน่งซื้อเฉพาะเมื่อทองคำดึงกลับเข้าสู่ 4,450 - 4,460 หรือดึงลึกลงไปใน 4,425 - 4,435 และแสดงการปฏิเสธขาขึ้นที่ชัดเจน
หยุดขาดทุน:
ต่ำกว่าจุดต่ำสุดในท้องถิ่นหรือใต้โซน POC ซื้อ
ทำกำไร:
TP1: 4,520
TP2: 4,560
TP3: 4,590 - 4,600
การตั้งค่านี้ตามโครงสร้างการฟื้นตัวปัจจุบัน ผู้ซื้อได้แสดงความแข็งแกร่งจากฐานล่างแล้ว ดังนั้นแผนที่ชัดเจนกว่าคือรอให้ราคากลับสู่มูลค่าแทนที่จะไล่ตามกลาง
สถานการณ์ทางเลือก
หากทองคำสูญเสีย 4,425 - 4,435 และไม่สามารถเรียกคืนได้ การฟื้นตัวขาขึ้นจะอ่อนแอลง
ในกรณีนั้น ราคาอาจหมุนกลับไปยังพื้นที่มูลค่าต่ำก่อนหน้าก่อนที่ปฏิกิริยาผู้ซื้อที่แข็งแกร่งกว่าจะปรากฏ ฉันจะไม่บังคับซื้อหาก POC ล้มเหลว
แนวคิดปฏิกิริยาขาย
หากทองคำถึง 4,590 - 4,600 และแสดงการปฏิเสธที่ชัดเจน ผู้ขายอาจตอบสนองจากโซนนั้นเพราะเป็นการต้านทานมูลค่า POC เก่า
นั่นไม่ได้หมายความว่าทั้งแนวโน้มจะกลายเป็นขาลงทันที แต่สามารถสร้างการแก้ไขจากพื้นที่มูลค่าสูงกว่าได้
มุมมองสุดท้าย
ทองคำกำลังฟื้นตัวได้ดี และโครงสร้างระยะสั้นตอนนี้เอนเอียงไปทางขาขึ้นเหนือ 4,429
กุญแจสำคัญคือว่าผู้ซื้อสามารถป้องกันฐานมูลค่าปัจจุบันได้หรือไม่ หากพวกเขาถือ 4,429 - 4,460 แม่เหล็กด้านบนถัดไปคือ 4,590 - 4,600 แต่เมื่อราคาถึง POC ขายนั้น ฉันจะดูอย่างระมัดระวังสำหรับการปฏิเสธเพราะเป็นโซนมูลค่าประวัติศาสตร์ที่แข็งแกร่ง
สำหรับฉัน แผนที่ง่าย:
ถือ 4,429 = ผู้ซื้อยังคงใช้งานอยู่
ถือ 4,450 = การฟื้นตัวยังคงแข็งแกร่ง
ทะลุ 4,520 = แรงผลักดันดีขึ้น
ถึง 4,596 = ดูปฏิกิริยาผู้ขาย
สูญเสีย 4,429 = การฟื้นตัวขาขึ้นอ่อนแอลง
ทองคำได้ทำการเคลื่อนไหวฟื้นตัวครั้งแรกแล้ว ตอนนี้คำถามคือว่าผู้ซื้อสามารถป้องกันมูลค่าและดันราคาเข้าสู่ POC 4,596 ได้หรือไม่ หรือว่าผู้ขายจะหยุดการเคลื่อนไหวก่อนที่จะถึงเป้าหมายนั้น
ทองคำจะเคารพ 4,429 และดำเนินต่อไปสูงขึ้นหรือไม่ หรือว่าตลาดต้องการการดึงกลับลึกลงอีกครั้งก่อนที่จะทดสอบ 4,596 เพิ่มขึ้น 
XAUUSD 4420 ถือ — NFP มุ่งเป้าไปที่ 4528? XAUUSD 4420 ถือ — NFP มุ่งเป้าไปที่ 4528?
การถือที่ 4,470 นั้นเริ่มน่าสนใจ
ทองคำได้ทิ้งตัวลงอย่างหนักในช่วงต้นสัปดาห์ กวาดสภาพคล่องที่ต่ำกว่า แล้วดีดกลับจากบริเวณ 4,290 การฟื้นตัวนั้นไม่ใช่เรื่องบังเอิญ ราคาได้กลับคืน FVG ดันผ่าน 4,420 และตอนนี้ถืออยู่รอบ 4,466 เหมือนผู้ขายเริ่มเสียการควบคุม
ยังไม่เป็นขาขึ้นที่ชัดเจน
แต่การดีดกลับมีโครงสร้างแล้ว
โซนสำคัญคือ 4,420 - 4,455 นั่นคือพื้นที่ผู้ซื้อบนกราฟ หากทองคำจุ่มลงไปและถืออยู่ ฉันมองหาผู้ซื้อที่จะป้องกันอีกครั้งก่อนที่จะดันขึ้นสูง โดยเฉพาะอย่างยิ่งเมื่อคาดการณ์อัตราดอกเบี้ยของเฟดเย็นลงหลังจาก Waller ฟังดูมั่นใจมากขึ้นเกี่ยวกับการชะลอตัวของเงินเฟ้อ
แต่ใช่ NFP นั่งอยู่ตรงหน้าตลาด
นั่นหมายถึงการเคลื่อนไหวปลอมมีแนวโน้มเกิดขึ้น การกวาดต่ำกว่า 4,455 หรือแม้กระทั่งเข้าไปใน 4,420 สามารถเกิดขึ้นได้ก่อนที่ทิศทางจริงจะปรากฏ ฉันไม่ต้องการไล่ตามแท่งเทียนก่อนการยืนยัน
แนวโน้มหลักคือการฟื้นตัวขาขึ้นในขณะที่ทองคำถืออยู่เหนือ 4,420
หากผู้ซื้อยังคงควบคุม 4,528 เป็นเป้าหมายแรก เหนือจากนั้น 4,580 เป็นการดึงสภาพคล่องถัดไป หาก NFP ให้เชื้อเพลิง ทองคำอาจพยายามไปถึงสภาพคล่องฝั่งซื้อเก่าใกล้ 4,630
สถานการณ์การซื้อขาย:
ไอเดียการซื้อเฉพาะเมื่อทองคำถือ 4,420 - 4,455 และกลับคืนเหนือ 4,470 ด้วยแท่งเทียนที่ชัดเจน
โซนเข้า: 4,420 - 4,470 หลังการยืนยัน
หยุดขาดทุน: ต่ำกว่า 4,396
TP1: 4,528
TP2: 4,580
TP3: 4,630
ไม่มีการถือในโซนผู้ซื้อ ไม่มีการซื้อ ง่ายๆ
หากทองคำปิดต่ำกว่า 4,396 อย่างหนัก ไอเดียการฟื้นตัวนี้ก็จบ จากนั้นผู้ขายสามารถลากกลับไปที่ 4,350 - 4,320
สำหรับตอนนี้ ฉันอ่านว่านี่คือการกวาดสภาพคล่องก่อน การกลับคืนของผู้ซื้อที่สอง 4,528 ถัดไป
คุณคิดว่า NFP ส่งทองคำไปที่ 4,580 หรือกวาด 4,420 ก่อน? ลดลง 
BRIAN XAUUSD – ทองคำฟื้นตัว แต่ 4,450 คือการทดสอบถัดไป BRIAN XAUUSD – ทองคำฟื้นตัว แต่ 4,450 คือการทดสอบถัดไป
ทองคำกำลังพยายามฟื้นตัวหลังจากการเคลื่อนไหวลงอย่างแรงจากพื้นที่มูลค่าก่อนหน้า แต่ตลาดยังไม่สะอาดอย่างสมบูรณ์
การฟื้นตัวล่าสุดได้รับการสนับสนุนจากข้อมูล ADP ของสหรัฐที่อ่อนแอและอัตราผลตอบแทนพันธบัตรรัฐบาลสหรัฐที่ลดลง ซึ่งกดดันค่าเงินดอลลาร์สหรัฐ สิ่งนี้ช่วยให้ทองคำฟื้นตัวจากระดับต่ำสุดในรอบสี่สัปดาห์ล่าสุด
อย่างไรก็ตาม ฝั่งขาขึ้นยังคงต้องระมัดระวัง ความคาดหวังในการขึ้นอัตราดอกเบี้ยของเฟดยังไม่หมดไป ความเสี่ยงจากเงินเฟ้อที่ขับเคลื่อนด้วยพลังงานยังคงเป็นข้อกังวล และความไม่แน่นอนทางภูมิรัฐศาสตร์ยังคงสามารถสนับสนุนค่าเงินดอลลาร์สหรัฐในฐานะสกุลเงินปลอดภัย
ดังนั้นเรื่องราวจึงผสมผสาน:
ทองคำมีโมเมนตัมการฟื้นตัวขาขึ้น
แต่ตอนนี้กำลังเข้าใกล้โซนแนวต้านที่ผู้ขายอาจตอบสนองอีกครั้ง
โครงสร้างทางเทคนิค
บนกราฟ H2 ทองคำได้ดีดตัวขึ้นอย่างแข็งแกร่งจากพื้นที่มูลค่าต่ำใกล้ 4,300 และตอนนี้ซื้อขายอยู่รอบ 4,425 - 4,430
แนวต้านสำคัญแรกคือโซนขาย VAL รอบ 4,450 ราคากำลังเคลื่อนไหวไปยังโซนนี้หลังจากการฟื้นตัวระยะสั้น นี่คือการทดสอบที่สำคัญเพราะ 4,450 คือพื้นที่ที่ผู้ขายอาจป้องกันอีกครั้งหากการฟื้นตัวเป็นเพียงการแก้ไข
ต่ำกว่าราคาปัจจุบัน โซนซื้อ POC รอบ 4,370 เป็นการสนับสนุนผู้ซื้อที่ใกล้ที่สุด หากทองคำดึงกลับและยึดโซนนี้ ผู้ซื้ออาจพยายามสร้างขาฟื้นตัวอีกครั้ง
แนวต้านที่สูงขึ้นยังคงเป็นโซนขาย POC รอบ 4,596 นี่คือแนวต้านมูลค่าหลักจากโครงสร้างการกระจายก่อนหน้า ทองคำจำเป็นต้องยึด 4,450 ก่อนที่พื้นที่สูงกว่านี้จะเป็นจริง
โซนสำคัญ
พื้นที่ราคาปัจจุบัน: 4,420 - 4,430
ทองคำกำลังฟื้นตัวแต่ยังต่ำกว่าแนวต้านหลัก
โซนขาย VAL: 4,440 - 4,455
แนวต้านแรกและโซนตอบสนองของผู้ขาย
โซนซื้อ POC: 4,365 - 4,375
โซนโหลดผู้ซื้อระยะสั้นหลัก
โซนขาย POC: 4,590 - 4,600
แนวต้านบนหลักหากโมเมนตัมขาขึ้นขยายตัว
พื้นที่ตอบสนองต่ำกว่า: 4,300 - 4,320
ฐานการฟื้นตัวล่าสุดและพื้นที่ต่ำที่สำคัญ
สถานการณ์การซื้อขาย
มุมมองที่มีความสำคัญ: รอการตอบสนองรอบ 4,450
สถานการณ์การตอบสนองการขาย
การเข้า:
มองหาตำแหน่งขายเฉพาะเมื่อทองคำถึง 4,440 - 4,455 และแสดงการปฏิเสธที่ชัดเจน
หยุดขาดทุน:
เหนือจุดสูงสุดของการปฏิเสธหรือเหนือโซนขาย VAL
ทำกำไร:
TP1: 4,370
TP2: 4,320
TP3: 4,300 หากผู้ขายกลับมาโมเมนตัม
การตั้งค่านี้ตามแนวคิดที่ว่าทองคำอาจกำลังแก้ไขเข้าสู่แนวต้านก่อนการหมุนลงอีกครั้ง
สถานการณ์การซื้อที่ต่อเนื่อง
หากทองคำดึงกลับไปที่ 4,365 - 4,375 และยึดโซนซื้อ POC ด้วยการปฏิเสธขาขึ้นที่แข็งแกร่ง การตอบสนองการซื้อระยะสั้นสามารถปรากฏขึ้น
การเข้า:
ซื้อเฉพาะหลังจากการยืนยันรอบ 4,370
หยุดขาดทุน:
ต่ำกว่าจุดต่ำสุดในท้องถิ่นหรือใต้การสนับสนุน POC
ทำกำไร:
TP1: 4,450
TP2: 4,500
TP3: 4,590 เฉพาะหากทองคำทะลุและยอมรับเหนือ 4,450
มุมมองสุดท้าย
ทองคำฟื้นตัวได้ดีจากพื้นที่ต่ำกว่า แต่การทดสอบจริงถัดไปคือ 4,450
หากผู้ซื้อทะลุและยึดเหนือ 4,450 การฟื้นตัวสามารถขยายตัวสูงขึ้นไปยัง 4,500 และอาจถึง 4,590 แต่หากทองคำปฏิเสธจาก 4,450 ตลาดอาจหมุนกลับไปที่ 4,370 ก่อนตัดสินใจทิศทางถัดไป
สำหรับฉัน กุญแจสำคัญคือเรียบง่าย:
ต่ำกว่า 4,450 = ผู้ขายยังมีโอกาสควบคุมการฟื้นตัว
ยึด 4,370 = ผู้ซื้อยังคงมีบทบาท
สูญเสีย 4,370 = ทองคำอาจทดสอบ 4,320 - 4,300
ทะลุเหนือ 4,450 = การฟื้นตัวขาขึ้นแข็งแกร่งขึ้น
ทองคำมีแนวโน้มขาขึ้นในการฟื้นตัวระยะสั้น แต่ไม่สะอาดพอที่จะไล่ตามที่แนวต้าน การซื้อขายที่ดีที่สุดจะมาจากการยืนยัน — ไม่ว่าจะเป็นการปฏิเสธที่ 4,450 หรือการป้องกันของผู้ซื้อที่ 4,370
ทองคำจะทะลุ 4,450 และขึ้นต่อไปหรือไม่ หรือผู้ขายจะใช้โซนนี้เพื่อดันราคากลับเข้าสู่มูลค่า? เพิ่มขึ้น