XAUUSD: ผู้ซื้อมีโอกาสเดียวที่ 3,962 XAUUSD: ผู้ซื้อมีโอกาสเดียวที่ 3,962
บริบทตลาด
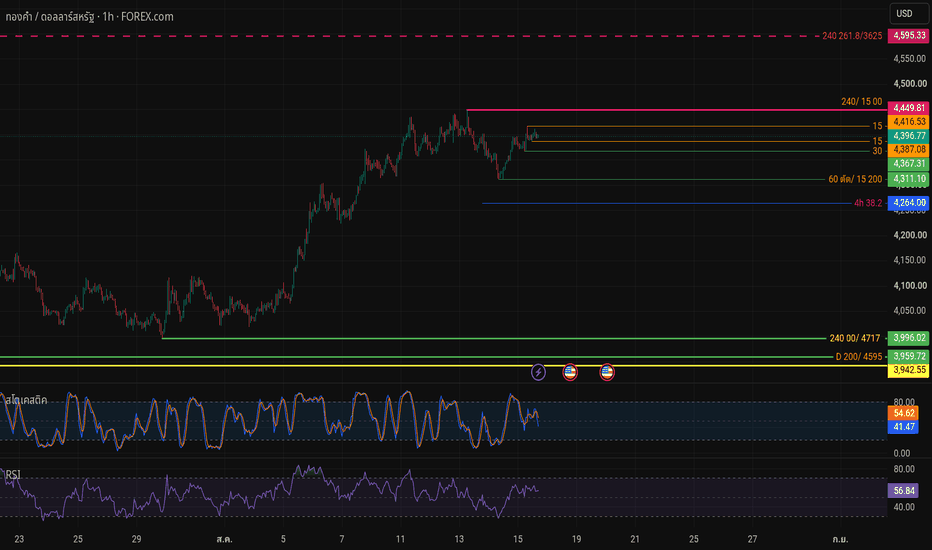
ทองคำกำลังซื้อขายใกล้ 3,976 และตอบสนองโดยตรงจากจุดตัดสินใจซื้อ โครงสร้างระยะสั้นยังคงอ่อนแอ แต่พื้นที่นี้คือที่ที่ผู้ซื้อต้องปรากฏตัวหากต้องการหยุดการลดลงในปัจจุบัน
เรื่องหลักนั้นง่าย: ทองคำยังไม่เป็นขาขึ้น แต่การเคลื่อนไหวขาลงกำลังเข้าสู่โซนตอบสนอง ผู้ซื้ออาจพยายามฟื้นตัวระยะสั้น แต่หาก 3,962 ล้มเหลว ตลาดสามารถเปิดไปยัง 3,940 - 3,950 ได้อย่างรวดเร็ว
โครงสร้างทางเทคนิค
ทองคำยังคงเคลื่อนไหวภายในโครงสร้างที่อ่อนแอหลังจากล้มเหลวในการยึดโซนบน การขายล่าสุดยืนยันว่าผู้ขายยังคงมีบทบาท และการฟื้นตัวในปัจจุบันจะมีผลก็ต่อเมื่อราคายังคงอยู่เหนือพื้นที่สนับสนุน 3,962
โซนตอบสนองหลักอยู่รอบ 3,962 - 3,980 หากราคายังคงอยู่ในพื้นที่นี้และสร้างการยืนยันขาขึ้น การฟื้นตัวแก้ไขอาจพัฒนาไปยัง 4,030 - 4,050
แต่โซน 4,030 - 4,050 ไม่ใช่พื้นที่ขาขึ้นที่สะอาด มันเป็นที่แรกที่ผู้ขายอาจกลับมา เหนือจากนั้น โซนล้มเหลวในการยึด 4,060 - 4,070 และโซนอุปทานหลัก 4,070 - 4,095 ยังคงเป็นแนวต้านที่แข็งแกร่ง
ระดับสำคัญ
ราคาปัจจุบัน: 3,976
จุดตัดสินใจซื้อ: 3,962 - 3,980
โซนความเสี่ยงขาลง: 3,940 - 3,950
โซนขายฟื้นตัวอ่อนแอ: 4,030 - 4,050
โซนล้มเหลวในการยึด: 4,060 - 4,070
โซนอุปทานหลัก: 4,070 - 4,095
การต่อเนื่องขาลง: ต่ำกว่า 3,962
แผนการซื้อขาย
สถานการณ์ซื้อ: ฟื้นตัวระยะสั้น
จุดเข้า: เหนือ 3,980 หลังจากการยืนยันขาขึ้น
หยุดขาดทุน: ต่ำกว่า 3,950
TP1: 4,010
TP2: 4,030
TP3: 4,050
เงื่อนไข: ราคาต้องยึดจุดตัดสินใจซื้อ 3,962 - 3,980 สร้างการปฏิเสธขาขึ้น และแสดง CHOCH ที่ชัดเจนในกรอบเวลาต่ำกว่า นี่เป็นเพียงการตั้งค่าฟื้นตัวแก้ไข ไม่ใช่การกลับตัวแนวโน้มเต็มรูปแบบ หลีกเลี่ยงการไล่ตามหากราคาถึง 4,030 - 4,050 เร็วเกินไปโดยไม่มีการทดสอบซ้ำที่สะอาด
สถานการณ์ขาย: ขายจากโซนฟื้นตัวอ่อนแอ
จุดเข้า: 4,030 - 4,050 หลังจากการยืนยันขาลง
หยุดขาดทุน: เหนือ 4,070
TP1: 3,980
TP2: 3,962
TP3: 3,950
เงื่อนไข: ราคาฟื้นตัวเข้าสู่โซนขายฟื้นตัวอ่อนแอแต่ล้มเหลวในการขึ้นต่อ การปฏิเสธขาลงปรากฏ ผู้ซื้อสูญเสียแรงผลักดัน และราคาล้มเหลวในการยึด 4,050 นี่คงเป็นพื้นที่ขายที่มีความสำคัญในขณะที่โครงสร้างหลักยังคงอ่อนแอ
สถานการณ์ขายทางเลือก: ขายจากอุปทานหลัก
จุดเข้า: 4,060 - 4,095 หลังจากการยืนยันขาลง
หยุดขาดทุน: เหนือ 4,120
TP1: 4,030
TP2: 3,980
TP3: 3,962
เงื่อนไข: ราคาฟื้นตัวเข้าสู่พื้นที่อุปทานบนแต่ล้มเหลวในการทำลายโครงสร้าง ผู้ขายป้องกันโซนล้มเหลวในการยึด แท่งเทียนขาลงปรากฏ และราคาเริ่มสร้างจุดสูงต่ำอีกครั้ง
การขายแบบแตก
จุดเข้า: ต่ำกว่า 3,962 หลังจากการแตกและทดสอบซ้ำที่ยืนยัน
หยุดขาดทุน: เหนือ 3,980
TP1: 3,950
TP2: 3,940
TP3: 3,920
เงื่อนไข: ราคาทำลายต่ำกว่าจุดตัดสินใจซื้อ การทดสอบซ้ำล้มเหลว และแรงผลักดันขาลงยังคงดำเนินต่อไป นี่จะยืนยันว่าผู้ซื้อล้มเหลวในการป้องกันพื้นและขาขาลงสามารถขยายต่ำลงได้
อคติรวม
แนวโน้มหลักยังคงอ่อนแอ ทองคำกำลังตอบสนองจากโซนตัดสินใจซื้อที่สำคัญ แต่ผู้ซื้อยังคงต้องการการยืนยันก่อนที่การฟื้นตัวใด ๆ จะมีผล
หาก 3,962 - 3,980 ยังคงอยู่ การฟื้นตัวระยะสั้นไปยัง 4,030 - 4,050 สามารถพัฒนาได้ หาก 3,962 แตก การเคลื่อนไหวขาลงต่อไปยัง 3,940 - 3,950 จะมีความเป็นไปได้มากขึ้น
สำหรับตอนนี้ แผนที่ดีที่สุดคือรอการยืนยันที่โซนซื้อ จากนั้นดูว่าราคาตอบสนองอย่างไรใกล้ 4,030 - 4,050
ผู้ซื้อจะป้องกัน 3,962 หรือผู้ขายจะทำลายพื้นและดำเนินการลดลงต่อไป?
รูปแบบฮาร์โมนิค
GBPUSD / British Pound Date: Wednesday, July 1, 2026GBPUSD / British Pound vs US Dollar CFD 1H Technical Outlook
Date: Wednesday, July 1, 2026
Instrument: GBPUSD CFD
Timeframe: 1H
Current Price Area: 1.32606
Market Condition: Uptrend / Buy-Side Bias
GBPUSD is currently trading around the 1.32606 area on the 1H timeframe. Price has been building a clear bullish structure after recovering from the previous lower range, and the latest movement shows buyers maintaining control above the Pivot Point at 1.32502.
The market is now trading above the pivot and holding near the previous high zone, which keeps short-term momentum tilted to the upside. From a CFD trader’s perspective, the current structure favors buying continuation or pullback-buy setups rather than trying to fade the move too early.
However, price is also approaching the first resistance zone at R1: 1.32840, so fresh long entries directly into resistance need discipline. The higher-quality setup would be either a clean breakout above R1 or a controlled pullback back toward the pivot where buyers can defend structure.
⸻
Key Levels
Resistance Levels:
* R1: 1.32840
* R2: 1.33023
* R3: 1.33361
Pivot Point:
* Pivot: 1.32502
Support Levels:
* S1: 1.32320
* S2: 1.31982
* S3: 1.31799
⸻
Trading Tool Perspective
The trading assistant tool currently shows:
* Trend: Uptrend
* Main Plan: Buy-side bias
* Guardrail: Avoid counter Sell
* Nearest Key Level: Pivot at 1.32502
* PVA Status: Normal
This confirms that the tool is reading the market with a bullish directional bias. Price is above the pivot, and the main plan supports the buy side. The guardrail also warns against counter-trend selling, which means short setups should be treated with caution unless the bullish structure clearly fails.
A sustained move above 1.32840 would support bullish continuation toward 1.33023, with 1.33361 as the next upside reference. If momentum expands with stronger candle structure and volume confirmation, buyers may continue to control the session.
On the other hand, if price fails to break R1 and pulls back, the key area to monitor is the pivot at 1.32502. As long as price holds above the pivot, the buy-side structure remains valid. A decisive break below the pivot could weaken short-term momentum and expose S1 at 1.32320.
The cleaner tactical scenarios are:
1. Bullish breakout scenario:
Price breaks and holds above R1 at 1.32840, confirming continuation toward R2 and R3.
2. Pullback-buy scenario:
Price pulls back toward the pivot at 1.32502, holds above it, and forms a bullish rejection structure.
3. Bullish failure scenario:
Price loses the pivot decisively and rotates lower toward S1, reducing the strength of the current buy-side bias.
For now, GBPUSD remains in an uptrend structure with buy-side control. The preferred approach is to avoid counter-trend selling and wait for either a breakout above R1 or a pullback into a valid support area.
⸻
Risk Warning
This analysis is for educational purposes only and does not constitute financial advice, investment advice, or a trading signal. Trading forex CFDs and leveraged products involves significant risk and may not be suitable for all traders. Leverage can amplify both profits and losses. Always define your risk before entering a position, use proper position sizing, and trade only according to your own strategy, capital size, and risk tolerance.
XAUUSD: ระดับ 3,970 กลายเป็นด่านทดสอบสำคัญสำหรับฝั่งขายXAUUSD ยังคงเผชิญแรงกดดันขาลงอย่างชัดเจนจากเส้นแนวโน้มขาลง (bearish trendline) และเส้นค่าเฉลี่ยเคลื่อนที่ (EMA) ที่อยู่ด้านบน ขณะนี้ราคาเคลื่อนไหวอยู่บริเวณ 3,968 ซึ่งใกล้กับระดับ 3,970 มาก หากราคาไม่สามารถยืนเหนือระดับนี้ได้ อาจส่งผลให้แรงเทขายทวีความรุนแรงขึ้นอย่างรวดเร็ว
สิ่งที่น่าสังเกตคือ กราฟไม่ได้แสดงสัญญาณการกลับตัวที่แข็งแกร่ง แต่เป็นการเคลื่อนไหวออกข้าง (sideways) แบบไร้กำลังบริเวณใต้แนวต้าน เมื่อราคาถูกบีบตัวอยู่ใต้เส้นแนวโน้มขาลงในลักษณะนี้ ฝั่งขายมักต้องการเพียงแค่การหลุดแนวรับเล็กน้อยเพื่อผลักดันราคาให้ปรับตัวลงต่อ โดยกราฟชี้เป้าหมายไปที่โซน 3,840 ซึ่งเป็นระดับที่มีแรงซื้อ (demand area) รออยู่ด้านล่าง
จุดเข้าเทรด: เน้นสถานะ SELL หากราคายังคงอยู่ต่ำกว่าระดับ 3,970–3,990 และเกิดแท่งเทียนยืนยันแนวโน้มขาลง (bearish confirmation candle)
เป้าหมาย: 3,840
จุดยกเลิกสถานะ (Invalidation): หากแท่งเทียนในกรอบเวลา H4 ปิดเหนือระดับ 4,020 มุมมองขาลงในระยะสั้นจะลดความน่าเชื่อถือลง
XAUUSD – ทองคำกำลังฟื้นตัว แต่ผู้ขายอาจป้องกันระดับสูงขึ้น XAUUSD – ทองคำกำลังฟื้นตัว แต่ผู้ขายอาจป้องกันระดับสูงขึ้น
มุมมองเมื่อวานนี้ตามโครงสร้างตลาดได้ดี เนื่องจากทองคำยังคงลดลงก่อนที่จะพบปฏิกิริยาจากโซนล่าง
วันนี้ ทองคำกำลังพยายามฟื้นตัวจากระดับต่ำล่าสุดและกำลังซื้อขายอยู่รอบ ๆ 4,029 โครงสร้างระยะสั้นได้ปรับปรุงขึ้นหลังจากราคาสร้างการดีดตัวที่แข็งแกร่งและเคลื่อนกลับขึ้นไปเหนือพื้นที่ FVG ใกล้เคียง
อย่างไรก็ตาม นี่ยังคงเป็นการเคลื่อนไหวฟื้นตัวภายในบริบทขาลงที่กว้างขึ้น คำถามสำคัญตอนนี้คือ: ผู้ซื้อสามารถเดินหน้าต่อไปที่ 4,070 – 4,080 ได้หรือไม่ หรือผู้ขายจะป้องกันพื้นที่นั้นอีกครั้ง?
การวิเคราะห์พื้นฐาน
ทองคำยังคงไวต่อการเคลื่อนไหวของ USD, ผลตอบแทน, และความเชื่อมั่นของตลาด หลังจากการขายออกล่าสุด การฟื้นตัวในปัจจุบันอาจได้รับการสนับสนุนจากการทำกำไรระยะสั้นและการซื้อทางเทคนิคจากระดับที่ต่ำกว่า
สำหรับวันนี้ ปฏิกิริยาราคารอบแนวต้านมีความสำคัญมากกว่าการคาดการณ์
การวิเคราะห์ทางเทคนิค – SMC + โครงสร้างตลาด
จากมุมมอง SMC ทองคำได้สร้างปฏิกิริยาขาขึ้นระยะสั้นหลังจากกวาดพื้นที่ล่าง ราคายังได้สร้างการเปลี่ยนแปลงโครงสร้างตลาดรอบ ๆ 4,020 แสดงให้เห็นว่าผู้ซื้อกำลังพยายามควบคุมระยะสั้น
โซน FVG รอบ ๆ 4,010 – 4,022 กำลังทำหน้าที่เป็นการสนับสนุนภายในวัน ตราบใดที่ทองคำยังคงอยู่เหนือพื้นที่นี้ การฟื้นตัวสามารถดำเนินต่อไปยังโซนแนวต้านด้านบน
แนวต้านหลักอยู่รอบ ๆ 4,070 – 4,080 นี่คือพื้นที่ที่ผู้ขายอาจป้องกันอีกครั้ง หากราคาถึงโซนนี้และปฏิเสธ ตลาดอาจสร้างการดึงกลับอีกครั้ง
โซนราคาที่สำคัญที่ต้องจับตามอง
ราคาปัจจุบัน: 4,029
การสนับสนุนภายในวัน: 4,010 – 4,022
พื้นที่ MSS: รอบ ๆ 4,020
การสนับสนุน FVG ต่ำกว่า: 3,970 – 3,985
แนวต้านการฟื้นตัว: 4,050
ผู้ขายอาจป้องกัน: 4,070 – 4,080
การยกเลิกการฟื้นตัวระยะสั้น: ต่ำกว่า 4,010
สถานการณ์การซื้อขาย
สถานการณ์การซื้อ – การฟื้นตัวระยะสั้น
โซนซื้อ: 4,010 – 4,022
การเข้า: ปฏิกิริยาขาขึ้น, การทดสอบ FVG, หรือ CHoCH ระยะเวลาต่ำกว่า
SL: ต่ำกว่า 4,010
TP1: 4,050
TP2: 4,070 – 4,080
สถานการณ์การขาย – ปฏิกิริยาจากแนวต้าน
โซนขาย: 4,070 – 4,080
การเข้า: การปฏิเสธขาลง, การทะลุที่ล้มเหลว, หรือ CHoCH ขาลงระยะเวลาต่ำกว่า
TP1: 4,050
TP2: 4,020
TP3: 4,010
สถานการณ์การขายทางเลือก
หากทองคำทะลุต่ำกว่า 4,010 โครงสร้างการฟื้นตัวจะอ่อนแอลง
เงื่อนไขการขาย: การทะลุและทดสอบต่ำกว่า 4,010
เป้าหมาย: 3,970 – 3,985
มุมมองของฉันเกี่ยวกับทองคำ
ทองคำกำลังฟื้นตัวในวันนี้ แต่ฉันไม่ต้องการไล่ตามการเคลื่อนไหวช้าเกินไป
แผนที่ชัดเจนกว่าคือการดูว่าราคามีปฏิกิริยาอย่างไรที่รอบ ๆ 4,010 – 4,022 สำหรับการสนับสนุน และ 4,070 – 4,080 สำหรับแนวต้าน หากผู้ซื้อป้องกัน FVG ทองคำอาจเดินหน้าต่อไป แต่หากราคาถึงโซนบนและผู้ขายปฏิเสธ การตั้งค่าการดึงกลับจะน่าสนใจมากขึ้น
สำหรับตอนนี้ ทองคำกำลังดีดตัว — แต่ 4,070 – 4,080 จะตัดสินว่าการฟื้นตัวนี้สามารถดำเนินต่อไปได้หรือไม่
คุณคิดว่าทองคำจะถึง 4,080 วันนี้หรือไม่ หรือผู้ขายจะกลับมาก่อนโซนนั้น?
GBPUSD / British Pound Date: Monday, June 29, 2026GBPUSD / British Pound vs US Dollar CFD 1H Technical Outlook
Date: Monday, June 29, 2026
Instrument: GBPUSD CFD
Timeframe: 1H
Current Price Area: 1.32108
Market Condition: Sideways / Pivot Reclaim Attempt
GBPUSD is currently trading around the 1.32108 area on the 1H timeframe. Price has recovered from the recent lower range and is now trading slightly above the Pivot Point at 1.32086. This shows that buyers are attempting to regain short-term control, but the broader structure is still not strong enough to classify as a clean bullish trend.
The market remains compressed inside a sideways structure. The first major upside barrier is R1 at 1.32285, which sits close to the recent swing high area. Until GBPUSD breaks and holds above that level, the current move should be treated as a short-term recovery inside a range rather than a confirmed trend continuation.
From a CFD trader’s perspective, this is a tactical zone. Chasing price directly into resistance carries weak risk-to-reward. A cleaner setup would come from either a confirmed breakout above R1 or a controlled pullback back toward the pivot area.
⸻
Key Levels
Resistance Levels:
* R1: 1.32285
* R2: 1.32636
* R3: 1.32835
Pivot Point:
* Pivot: 1.32086
Support Levels:
* S1: 1.31734
* S2: 1.31535
* S3: 1.31184
⸻
Trading Tool Perspective
The trading assistant tool currently shows:
* Trend: Sideways
* Main Plan: Sideways
* Guardrail: Wait for breakout or pullback
* Nearest Key Level: Pivot at 1.32086
* PVA Status: Normal
This confirms that GBPUSD is not yet in a high-conviction trending phase. Price is holding above the pivot, but the tool still reads the broader condition as sideways, and volume remains normal. That means confirmation is more important than prediction.
A sustained break above 1.32285 would strengthen the bullish recovery case and could open a move toward 1.32636, with 1.32835 as the next upside reference. However, if price fails to hold above the pivot and rotates lower, the market could retest S1 at 1.31734.
The cleaner tactical scenarios are:
1. Bullish breakout scenario:
Price breaks and holds above R1 at 1.32285, supported by stronger candle structure and volume confirmation.
2. Pullback-buy scenario:
Price pulls back toward the pivot at 1.32086, holds above it, and forms a bullish rejection structure.
3. Bearish failure scenario:
Price loses the pivot decisively and rotates back toward S1 at 1.31734.
For now, GBPUSD remains in a sideways market condition with a short-term bullish attempt above the pivot. The key confirmation level is R1. Until that level is cleared, patience and risk control remain the priority.
⸻
Risk Warning
This analysis is for educational purposes only and does not constitute financial advice, investment advice, or a trading signal. Trading forex CFDs and leveraged products involves significant risk and may not be suitable for all traders. Leverage can amplify both profits and losses. Always define your risk before entering a position, use proper position sizing, and trade only according to your own strategy, capital size, and risk tolerance.
XAUUSD / Gold CFD 1H Date: Monday, June 29, 2026XAUUSD / Gold CFD 1H Technical Outlook
Date: Monday, June 29, 2026
Instrument: XAUUSD / Gold CFD
Timeframe: 1H
Current Price Area: 4,064.805
Market Condition: Sideways / Pullback Setup
Gold is currently trading around the 4,064.805 area on the 1H timeframe. After a strong recovery from the lower range, price is now pulling back and consolidating below the Pivot Point at 4,077.502.
The market is not in a clean trending phase yet. Price is still holding above the lower support structure, but it has not reclaimed the pivot. This makes the current area a tactical decision zone. From a CFD trader’s perspective, this is where patience matters. The market needs either a confirmed reclaim of the pivot or a deeper pullback into support before a higher-quality setup forms.
The projected path on the chart suggests a possible bullish continuation scenario if price can stabilize, hold above support, and reclaim the pivot area. However, without confirmation, this remains a setup to monitor rather than a confirmed long bias.
⸻
Key Levels
Resistance Levels:
* R1: 4,096.697
* R2: 4,124.422
* R3: 4,143.617
Pivot Point:
* Pivot: 4,077.502
Support Levels:
* S1: 4,049.777
* S2: 4,030.582
* S3: 4,002.857
⸻
Trading Tool Perspective
The trading assistant tool currently shows:
* Trend: Sideways
* Main Plan: Sideways
* Guardrail: Wait for breakout or pullback
* Nearest Key Level: Pivot at 4,077.502
* PVA Status: Normal
This means the tool is not confirming a high-conviction directional market yet. Price is below the pivot, and volume condition remains normal, so traders should avoid forcing entries inside the middle of the range.
A sustained move back above 4,077.502 would suggest that buyers are regaining short-term control. If price holds above the pivot, the next upside reference is R1 at 4,096.697, followed by R2 at 4,124.422 and R3 at 4,143.617.
If price fails to reclaim the pivot and breaks lower, the first downside level to watch is S1 at 4,049.777. A clean break below S1 could expose S2 at 4,030.582, with deeper support at S3 at 4,002.857.
The cleaner tactical scenarios are:
1. Bullish reclaim scenario:
Price holds above the current support area, reclaims the pivot at 4,077.502, and confirms continuation toward R1.
2. Pullback-buy scenario:
Price drops toward S1, rejects that area, and prints bullish confirmation with improving momentum.
3. Bearish failure scenario:
Price loses S1 with conviction, shifting the short-term structure back toward S2 and S3.
For now, XAUUSD remains in a sideways pullback phase. The pivot is the main decision level. A confirmed reclaim would strengthen the bullish recovery case, while failure below support would invalidate the upside structure.
⸻
Risk Warning
This analysis is for educational purposes only and does not constitute financial advice, investment advice, or a trading signal. Trading Gold CFDs, forex, futures, commodities, and leveraged products involves substantial risk and may not be suitable for all traders. Leverage can amplify both profits and losses. Always define your risk before entering a position, use proper position sizing, and trade only according to your own strategy, capital size, and risk tolerance.
USOIL / WTI Crude Oil CFD 1H Date: Monday, June 29, 2026USOIL / WTI Crude Oil CFD 1H Technical Outlook
Date: Monday, June 29, 2026
Instrument: USOIL / WTI Crude Oil CFD
Timeframe: 1H
Current Price Area: 69.85
Market Condition: Downtrend / Mixed Signal
WTI Crude Oil is currently trading around the 69.85 area on the 1H timeframe. The broader intraday structure remains under pressure, with price still respecting a bearish sequence after the previous sell-off. Although there has been some reaction buying from the lower range, the market has not yet confirmed a clean bullish reversal.
The key point on this chart is the relationship between price and the Pivot Point at 69.23. Price is currently trading above the pivot, but the trading tool still classifies the broader condition as Downtrend with a Mixed Signal. That means the market is not offering a clean one-sided setup yet.
From a CFD trader’s perspective, this is a tactical zone, not a place to overcommit. The cleaner confirmation would come from either price holding above the pivot and attacking R1, or failing to sustain above the current range and rotating back toward support.
⸻
Key Levels
Resistance Levels:
* R1: 70.24
* R2: 70.84
* R3: 71.84
Pivot Point:
* Pivot: 69.23
Support Levels:
* S1: 68.63
* S2: 67.63
* S3: 67.03
⸻
Trading Tool Perspective
The trading assistant tool currently shows:
* Trend: Downtrend
* Main Plan: Mixed Signal
* Guardrail: Wait below Pivot
* Nearest Key Level: R1 at 70.24
* PVA Status: Normal
This tells us that the market is still technically bearish, but the short-term price action is attempting to stabilize above the pivot. Since PVA remains normal, there is no strong volume confirmation behind a decisive breakout or breakdown yet.
A sustained break above 70.24 could open the way toward 70.84, with 71.84 as the next upside reference. However, as long as price fails to break R1 with conviction, the recovery should be treated as a corrective move inside a broader downtrend.
If price loses the 69.23 pivot, bearish pressure may return quickly. In that case, the first downside reference is 68.63, followed by 67.63 and 67.03 if sellers regain full control.
The cleaner tactical scenarios are:
1. Bullish recovery scenario:
Price holds above the pivot and breaks R1 at 70.24 with stronger momentum and volume confirmation.
2. Bearish continuation scenario:
Price fails to hold above the pivot and rotates lower toward S1 at 68.63.
3. Range / mixed-signal scenario:
Price remains trapped between the pivot and R1, meaning execution risk is higher and patience is preferable.
For now, USOIL remains in a downtrend environment with mixed short-term signals. The pivot remains the main decision level, while R1 is the first resistance that buyers need to clear before any stronger recovery can be taken seriously.
⸻
Risk Warning
This analysis is for educational purposes only and does not constitute financial advice, investment advice, or a trading signal. Trading crude oil CFDs, futures, forex, commodities, and leveraged products involves a high level of risk and may not be suitable for all traders. Leverage can amplify both profits and losses. Always define your risk before entering a position, use proper position sizing, and trade only according to your own strategy, capital size, and risk tolerance.
GOLD H1 Analysis . June 25 , 2026 GOLD H1 Analysis
Overall bias: Bearish / Sell-side bias
The chart still shows a clear downtrend. Current price is around 3980.990, while the Pivot is 3996.003. Price is trading below Pivot, below the moving averages, and Dragon Flow shows:
Item Reading
Price 3980.990
Trend Downtrend
Pivot 3996.003
Main Plan Sell-side bias
Guardrail Avoid counter Buy
So the main plan remains sell, not buy.
⸻
Market Structure
GOLD has dropped aggressively from the upper zone around 4140–4200 and is now consolidating near the lower area around 3960–3990.
Observation Meaning
Price below Pivot Sellers still control the session
Price below moving averages Momentum remains bearish
Recent candles are small Market is consolidating after a sharp drop
Price near support Do not chase sell too late
The trend is bearish, but price is already near the lower support area. The better trade is to wait for either a pullback sell or a breakdown-retest sell.
⸻
Key Levels
Resistance
Level Meaning
3996.003 Main Pivot / first resistance
4009.029 Minor resistance
4019.557 Intraday resistance
4031–4033 Previous high / R1 zone
4078.373 R2
4115.567 R3
Main sell zone:
3996–4033
If price pulls back into this zone and rejects, that is the cleaner sell setup.
⸻
Support
Level Meaning
3960 area Previous low zone
3950.827 S1
3913.633 S2
3868.457 S3
If price breaks below 3960–3950, the next downside target is 3913.
⸻
Trading Plan
Plan A: Sell Pullback
Best setup:
Price pulls back toward:
3996–4033
Then wait for confirmation:
* Bearish rejection candle
* Long upper wick
* Bearish engulfing
* H1 closes back below 3996
* Failed breakout above Pivot
Targets:
Target Level
TP1 3960
TP2 3950.827
TP3 3913.633
TP4 3868.457
Stop-loss idea:
* Conservative SL: above 4033
* Wider SL: above 4078
⸻
Plan B: Breakdown Sell
If price breaks below 3960–3950 clearly:
1. Wait for price to retest 3950–3960
2. If price rejects that area, sell continuation is valid
3. Target 3913
4. Next target 3868
Avoid selling directly into support unless the breakout candle has strong momentum.
⸻
Buy Scenario
Buy is not the main plan.
A buy setup only becomes valid if:
1. Price reclaims 3996 Pivot
2. Holds above 4009–4019
3. Breaks above 4033 R1
4. Pullback holds above the broken resistance
If that happens, upside targets are:
* 4078
* 4115
Until then, counter-trend buy is weak.
⸻
Straight Conclusion
GOLD H1 is still bearish.
Best action:
* Do not chase sell at the low
* Wait for pullback into 3996–4033
* Sell only after rejection confirmation
* Breakdown sell is valid below 3950
* Main downside targets: 3950 → 3913 → 3868
Current view: Bearish continuation, but price is near support. Best trade is a patient sell setup, not emotional entry.
USDJPY June 25 , 2026 USDJPY M30 Chart Analysis
Overall bias: Bullish / Buy-side bias
The Dragon Flow panel shows:
Item Reading
Price 161.821
Trend Uptrend
Pivot 161.784
Main Plan Buy-side bias
Guardrail Avoid counter Sell
Price is currently above Pivot 161.784, and the short-term structure is still bullish. This is a cleaner buy-side setup than EURUSD.
⸻
Market Structure
USDJPY has been forming higher highs and higher lows on M30. There was a sharp liquidity sweep down near 161.55–161.60, followed by a strong recovery. That tells us buyers defended the lower zone aggressively.
Observation Meaning
Price above Pivot Buyers still have control
Price above moving averages Bullish momentum remains active
Recent strong recovery from wick low Demand appeared near lower support
Price now near R1 Do not chase blindly
The trend is bullish, but current price is already close to resistance, so the best entries are either pullback buys or breakout-retest buys.
⸻
Key Resistance Levels
Level Meaning
161.881 R1 / immediate upside target
161.937 R2
162.034 R3 / major short-term target
The nearest resistance is 161.881. Price needs to break and hold above this level to continue cleanly toward 161.937–162.034.
⸻
Key Support Levels
Level Meaning
161.784 Pivot / main intraday support
161.728 S1
161.700–161.728 Gap / support zone
161.631 S2
161.575 S3
The most important buy zone is:
161.728–161.784
If price pulls back into this area and rejects, it gives a cleaner buy setup.
⸻
Trading Plan
Plan A: Buy Pullback
Best buy zone:
161.728–161.784
Buy confirmation:
* Bullish rejection candle
* Long lower wick
* Bullish engulfing
* M30 candle closes back above 161.784
* Price holds above the moving averages
Targets:
Target Level
TP1 161.881
TP2 161.937
TP3 162.034
Stop-loss idea:
* Conservative SL: below 161.728
* Wider SL: below 161.631
⸻
Plan B: Breakout Buy
If price breaks above 161.881:
1. Wait for a retest of 161.881
2. If price holds above it, look for buy continuation
3. Target 161.937
4. Next target 162.034
This is better than buying directly into resistance.
⸻
When Bullish Bias Becomes Invalid
The buy-side view weakens if:
1. Price closes M30 below 161.784
2. Price breaks below 161.728
3. Price loses 161.631
If price breaks below 161.631, the bullish structure is damaged and USDJPY may rotate lower toward 161.575 or below.
⸻
Straight Conclusion
USDJPY M30 is currently bullish.
Best plan:
* Buy zone: 161.728–161.784
* Breakout buy: Above 161.881, then retest hold
* Main targets: 161.881 → 161.937 → 162.034
* Avoid counter-trend sells unless price breaks below Pivot and S1 clearly
Current view: Bullish continuation, but avoid chasing directly under R1. Wait for pullback or confirmed breakout.
EURUSD June 25 , 2026 EURUSD H1 Chart Analysis
Overall read: Bearish trend, but current setup is mixed.
The Dragon Flow panel shows:
Item Reading
Price 1.13543
Trend Downtrend
Pivot 1.13523
Main Plan Mixed signal
Guardrail Wait below Pivot
Price is currently slightly above Pivot 1.13523, so this is not a clean sell entry yet. The broader H1 trend is still bearish, but the short-term price action is consolidating around the pivot.
⸻
Market Structure
EURUSD had a strong selloff from the upper zone around 1.1450 down to the 1.1325–1.1330 area. After that, price bounced and is now moving sideways near 1.1350–1.1365.
Observation Meaning
Main H1 structure is still lower highs / lower lows Bearish trend remains
Price bounced from recent low Sellers are losing short-term momentum
Price is around Pivot Market is indecisive
Dragon Flow says “Mixed signal” Do not force entry
This pair is less clean than GOLD and SILVER. GOLD/SILVER had clearer sell-side bias. EURUSD needs confirmation.
⸻
Key Resistance Levels
Level Meaning
1.13634–1.13695 Immediate resistance / recent reaction high
1.13688 R1
1.13842 R2
1.14007 R3
1.13968–1.14000 Larger resistance area
The most important short-term sell zone is:
1.13630–1.13690
If price rejects this zone, sell continuation becomes valid again.
⸻
Key Support Levels
Level Meaning
1.13523 Pivot
1.13369 S1
1.13204 S2
1.13050 S3
The key level to watch now is 1.13523.
If price falls back below this level and holds below it, sellers regain control.
⸻
Trading Plan
Plan A: Sell Below Pivot
This is the cleaner bearish setup.
Sell condition:
* Price closes below 1.13523
* Retest of Pivot fails
* Bearish rejection candle appears
Entry zone: around 1.13520–1.13540 after failed retest
Targets:
Target Level
TP1 1.13369
TP2 1.13204
TP3 1.13050
Stop-loss idea:
* Above 1.13630
* Wider SL above 1.13690
⸻
Plan B: Sell from Resistance
If price pushes higher first, do not chase. Wait for rejection.
Sell zone:
1.13630–1.13690
Confirmation:
* Bearish engulfing
* Long upper wick
* Failed breakout above R1
* H1 candle closes back below 1.13630
Targets:
* TP1: 1.13523
* TP2: 1.13369
* TP3: 1.13204
Stop-loss:
* Above 1.13720
* Wider stop above 1.13842
⸻
Plan C: Buy Only After Breakout
Buy is not the main plan, but it becomes valid if price confirms strength.
Buy condition:
* H1 candle closes above 1.13688
* Price holds above R1
* Pullback does not break back below 1.13630
Targets:
Target Level
TP1 1.13842
TP2 1.14007
Stop-loss:
* Below 1.13523
* Aggressive SL below 1.13630
⸻
Straight Conclusion
EURUSD H1 is not a clean immediate sell yet.
Best action:
* Wait below Pivot 1.13523 for sell confirmation.
* Best sell zone above price: 1.13630–1.13690
* Downside targets: 1.13369 → 1.13204 → 1.13050
* Buy only if price breaks and holds above 1.13688
Current view: Bearish trend, but short-term mixed. Avoid entering inside the pivot chop zone.
Silver June 25, 2026SILVER H1 Chart Analysis
Overall bias: Bearish / Sell-side bias
Current price is around 57.3810, slightly below the Pivot at 57.4471. The Dragon Flow panel also shows:
* Trend: Downtrend
* Main Plan: Sell-side bias
* Guardrail: Avoid counter Buy
So the cleanest trade logic is still to look for sell setups, not random buys.
⸻
Market Structure
SILVER has sold off aggressively from the upper zone near 65–66 down into the 56–57 area. Price is now consolidating after a strong drop.
Observation Meaning
Price below moving averages Bearish momentum remains active
Lower highs / lower lows H1 structure is still downtrend
Price below Pivot 57.4471 Sellers still have control
Sideways candles near the low Market is pausing before next move
This does not yet look like a confirmed bullish reversal. It looks more like a bearish consolidation after a strong selloff.
⸻
Key Resistance Levels
Level Meaning
57.4471 Pivot / immediate resistance
58.36–58.68 Nearby resistance zone
59.3159 R1
61.4267 R2
63.2955 R3
The most important short-term area is:
57.45–58.68
If price pulls back into this zone and rejects, it may offer a better sell entry.
⸻
Key Support Levels
Level Meaning
56.50–56.80 Recent low / local support
55.3363 S1
53.4675 S2
51.3567 S3
If price breaks below 56.50, the next major downside target is 55.33.
⸻
Trading Plan
Main Plan: Sell Pullback
Best sell zone:
57.45–58.68
Look for confirmation such as:
* Bearish rejection candle
* Failed breakout above Pivot
* Bearish engulfing
* H1 close back below 57.4471
* Weak volume on the pullback
Targets:
Target Level
TP1 56.50–56.80
TP2 55.3363
TP3 53.4675
Stop-loss idea:
* Conservative SL: above 58.68
* Wider SL: above 59.3159
⸻
Alternative Plan: Breakdown Sell
If price breaks below 56.50 clearly:
1. Wait for a retest of 56.50–56.80
2. If price rejects that zone, look for sell entry
3. Target 55.3363
4. Next target 53.4675
Avoid chasing the breakdown candle directly unless momentum is very strong.
⸻
When Bearish Bias Becomes Invalid
The sell-side view weakens if:
1. Price closes H1 above 57.4471
2. Price holds above 58.68
3. Price breaks above 59.3159 R1
If that happens, price may attempt a recovery toward 61.42.
⸻
Straight Conclusion
SILVER H1 is still bearish.
Best plan:
* Sell zone: 57.45–58.68
* Breakdown sell: Below 56.50, then retest failure
* Main targets: 55.33 → 53.46 → 51.35
* Avoid buy entries unless price reclaims and holds above 58.68–59.31
Current view: Bearish continuation after consolidation.
GOLD H1 Analysis June 25,2026GOLD H1 Analysis from the Chart
Overall bias: The main structure is still bearish / sell-side bias.
Current price is around 3987.158, below the Pivot at 3996.003, and also below the moving averages. This means sellers are still controlling the H1 structure.
⸻
Market Structure
From the chart, GOLD has been selling off strongly from the upper zone around 4140–4150 down to the 3970–3990 area. Price is now consolidating near the lower area after the sharp drop.
Observation Meaning
Lower Highs / Lower Lows H1 trend is still bearish
Price below moving averages Momentum remains weak
Price below Pivot 3996 Sellers still have advantage
Candles are getting smaller Market is pausing after a strong selloff
The chart does not show a strong buy setup yet. Buying against the trend is risky unless price reclaims key levels.
⸻
Key Resistance Levels
Level Meaning
3996.003 Main Pivot level
4011–4022 Nearby resistance / reaction zone
4033.197 R1
4078.373 R2
4115.567 R3
The most important resistance zone now is 3996–4022.
If price pulls back into this area and rejects, it could become a good sell zone.
⸻
Key Support Levels
Level Meaning
3970–3980 Minor support / recent low zone
3950.827 S1 / first downside target
3913.633 S2
3868.457 S3
If price breaks below 3970 and fails to recover, the next downside targets are 3950, then 3913.
⸻
Trading Plan
Main Plan: Sell on Pullback
Look for a sell setup if price pulls back to:
3996–4022
Possible entry confirmation:
* Bearish rejection candle
* Pin bar
* Bearish engulfing
* H1 candle closes back below Pivot
* Failed breakout above 3996–4022
Targets:
Target Level
TP1 3950
TP2 3913
TP3 3868
Stop-loss idea:
* Conservative SL: above 4022
* Wider SL: above 4033
⸻
Alternative Plan: Breakdown Sell
If price breaks below 3970–3980 clearly:
1. Wait for price to retest the broken support.
2. If the retest fails, look for sell entry.
3. First target is 3950.
4. Next target is 3913.
This is safer than chasing price at the current level.
⸻
When the Sell Bias Becomes Invalid
The bearish view becomes weaker if:
1. Price closes H1 above 3996 Pivot
2. Price holds above 4011–4022
3. Price breaks above 4033 R1 with strong momentum
If that happens, short-term buy opportunities may open toward 4078 and 4115.
⸻
Straight Conclusion
For now, the better side is still Sell, not Buy.
Key levels:
* Sell zone: 3996–4022
* Breakdown sell: Below 3970, then retest failure
* Main targets: 3950 → 3913 → 3868
* Avoid random counter-trend buys unless price reclaims 3996 and holds above 4022
Current view: Bearish continuation after short-term consolidation.
XAUUSD: ผู้ขายยังคงควบคุมตลาดXAUUSD ยังคงอยู่ในแนวโน้มขาลง โดยการดีดตัวขึ้นซ้ำๆ ถูกบล็อกโดยเส้นแนวโน้มด้านบน ราคาปัจจุบันอยู่ที่ประมาณ 4,080 หลังจากมีการขายอย่างหนักและไม่สามารถกลับขึ้นไปที่โซนแนวรับก่อนหน้าประมาณ 4,033 ได้
จุดสำคัญอยู่ที่ 4,130 นี่คือโซนทดสอบที่ใกล้ที่สุด ซึ่งราคาอาจดีดตัวขึ้นเพื่อทดสอบเส้นแนวโน้มขาลงอีกครั้ง หากราคาทองคำถูกปฏิเสธในบริเวณนี้ การลดลงอาจดำเนินต่อไปยังบริเวณ 3,982
โครงสร้างปัจจุบันยังคงเอื้อต่อผู้ขาย: จุดสูงสุดที่ต่ำลง ราคาต่ำกว่าเส้นแนวโน้ม และแรงซื้อไม่เพียงพอที่จะพลิกกลับแนวโน้ม
จุดเข้าซื้อ: ให้ความสำคัญกับการขายที่ประมาณ 4,110 – 4,130 หากราคาดีดตัวขึ้นอย่างอ่อนแอ
เป้าหมาย: 3,982
การยกเลิก: สถานการณ์ขาลงจะยกเลิกหากแท่งเทียน H3 ปิดเหนือ 4,150
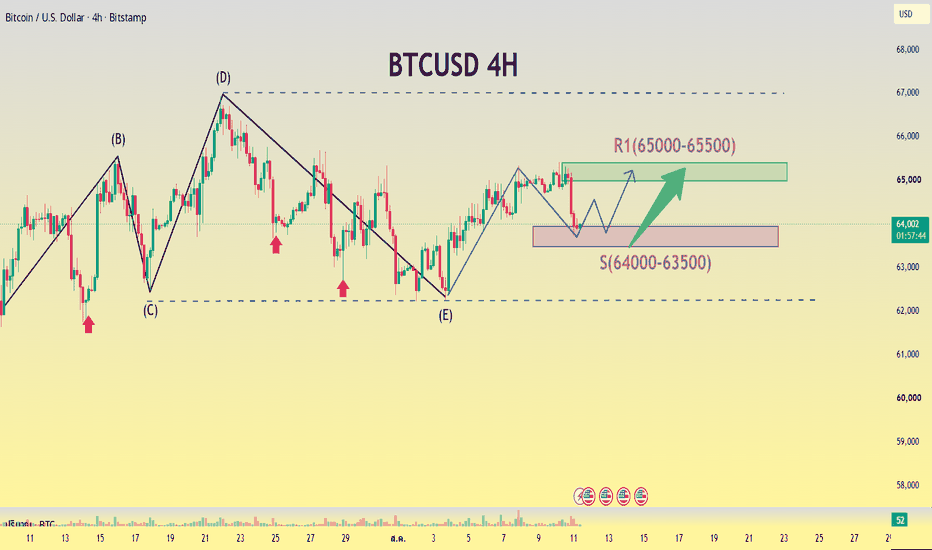
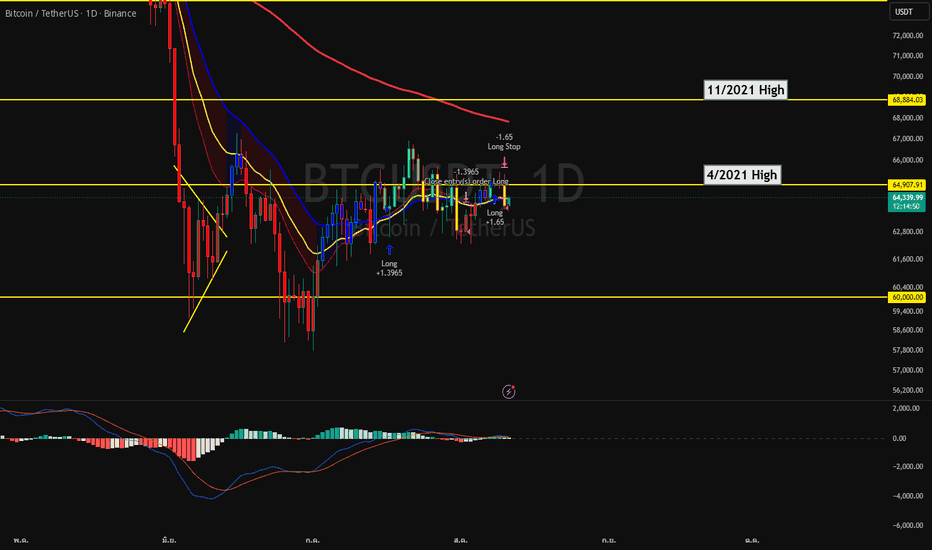
BTCUSD: โครงสร้างรายวันยังคงอ่อนแอ ผู้ขายเล็งเป้าหมายที่ 58,200ในกรอบเวลา D1 ราคา BTCUSD ยังไม่แสดงสัญญาณการกลับตัวที่ชัดเจน หลังจากร่วงลงอย่างรวดเร็วจากจุดสูงสุด ราคาได้ทรงตัวอย่างอ่อนแออยู่รอบๆ 62,676 ในขณะที่ด้านบนยังคงถูกปิดกั้นโดยเส้นแนวโน้มขาลงและโซนแนวต้านที่กว้าง
บริเวณ 63,410 เป็นจุดที่น่าจับตามอง หาก BTC ไม่สามารถทะลุและรักษาระดับเหนือบริเวณนี้ได้ แรงขายอาจเพิ่มขึ้นอย่างต่อเนื่อง เมื่อมองภาพรวมแล้ว โซนแนวรับ 58,200 เป็นเป้าหมายที่เหมาะสมสำหรับการลดลงครั้งต่อไป
บริบทตลาดปัจจุบันไม่เอื้ออำนวยต่อสินทรัพย์เสี่ยง: ดอลลาร์แข็งค่า ธนาคารกลางสหรัฐฯ มีท่าทีแข็งกร้าว และกระแสเงินทุนคริปโตไหลเข้าอ่อนแอ ดังนั้น การดีดตัวขึ้นของ BTC ในกรอบเวลา D1 ควรพิจารณาว่าเป็นโอกาสในการขายตามแนวโน้มหลัก
จุดเข้าซื้อ: เน้นขายที่ระดับประมาณ 63,000 – 63,410 หากราคาดีดตัวขึ้นอย่างอ่อนๆ
เป้าหมาย: 58,200
การยกเลิกสถานการณ์ขาลง: สถานการณ์ขาลงจะสิ้นสุดลงหาก BTC ปิดแท่งเทียน D1 เหนือ 66,000
AUDUSD: ช่องแนวโน้มขาลงยังไม่ถูกทะลุ การดีดตัวขึ้นยังคงเป็นโอกาสAUDUSD ในกราฟ H4 ยังคงเคลื่อนไหวอยู่ภายในช่องราคาขาลง โดยมีแรงขายที่ชัดเจนทุกครั้งที่ราคาแตะขอบบน ราคาปัจจุบันอยู่ที่ประมาณ 0.69082 หลังจากที่ร่วงลงใกล้จุดต่ำสุดของช่อง และไม่มีสัญญาณของแรงซื้อที่แข็งแกร่งที่จะกลับตัว
บริเวณ 0.69850 เป็นระดับแนวต้านสำคัญในกราฟ หาก AUDUSD ดีดตัวขึ้นใกล้บริเวณนี้ แต่ถูกบล็อกอีกครั้งโดยขอบบนของช่องขาลง ผู้ขายอาจฉวยโอกาสผลักดันราคาให้กลับเข้าสู่แนวโน้มหลัก
สถานการณ์ที่ต้องการคือการดีดตัวขึ้นทางเทคนิค ตามด้วยการถูกปฏิเสธต่ำกว่า 0.69850 และการลดลงอย่างต่อเนื่องภายในช่อง เป้าหมายที่เหมาะสมคือจุดต่ำสุดประมาณ 0.68900 – 0.68700
จุดเน้นในการเข้าซื้อ: ให้ความสำคัญกับการขายเมื่อราคาดีดตัวขึ้นไปที่ 0.69600 – 0.69850 และแสดงสัญญาณของความอ่อนแอ
เป้าหมาย: 0.68900
การยกเลิก: สถานการณ์ขาลงจะถือเป็นโมฆะหากแท่งเทียน H4 ปิดเหนือ 0.70000
USDCAD: คลื่นขาขึ้นกำลังขยายตัวกราฟ H4 ของ USDCAD อยู่ในโครงสร้างขาขึ้นที่แข็งแกร่ง โดยมีการเคลื่อนไหวขึ้นต่อเนื่องสร้างจุดต่ำสุดและจุดสูงสุดที่สูงขึ้น ราคาปัจจุบันอยู่ที่ประมาณ 1.42218 หลังจากดีดตัวขึ้นอย่างแข็งแกร่งจากโซนแนวรับด้านล่างและยังคงเคลื่อนไหวตามช่องแนวโน้มขาขึ้นระยะสั้น
บริเวณ 1.42160 เป็นระดับแนวรับที่สำคัญ ตราบใดที่ราคายังคงอยู่เหนือบริเวณนี้ ผู้ซื้อก็มีเหตุผลที่จะผลักดันตลาดต่อไปยังบริเวณ 1.42800 ซึ่งเป็นบริเวณเป้าหมายที่ทำเครื่องหมายไว้บนกราฟ และอยู่ใกล้กับขอบบนของช่องแนวโน้มขาขึ้นในปัจจุบัน
บริบททางเศรษฐกิจมหภาคยังสนับสนุน USDCAD ด้วยเช่นกัน: USD ได้รับการสนับสนุนจากความคาดหวังของอัตราดอกเบี้ยที่สูงขึ้น ในขณะที่ CAD อยู่ภายใต้แรงกดดันจากราคาน้ำมันที่อ่อนตัวลง ด้วยปัจจัยทั้งทางเทคนิคและข่าวสารที่เอื้อไปในทิศทางเดียวกัน การเคลื่อนไหวขึ้นในปัจจุบันจึงยังคงเป็นสิ่งสำคัญ
จุดเข้าซื้อ: เน้นซื้อที่ระดับ 1.42160 – 1.42200 หากราคาสามารถรักษาระดับแนวรับไว้ได้
เป้าหมาย: 1.42800
การยกเลิกสมมติฐาน: หากแท่งเทียน H4 ปิดต่ำกว่า 1.42000 สมมติฐานขาขึ้นจะต้องได้รับการพิจารณาใหม่
XAGUSD: อย่ารีบไล่ขายที่จุดต่ำแม้ภาพรวมจะเป็นขาลง แต่การเปิด Sell หลังจากราคาลงมาไกลแล้วมักให้ความเสี่ยงสูงกว่าผลตอบแทน
สิ่งที่น่าสนใจคือรอให้ตลาดดีดกลับก่อน แล้วค่อยดูว่าผู้ขายยังคงควบคุมสถานการณ์อยู่หรือไม่
แผนการเทรด
รอรีบาวด์ไปแถว 64.50–65.00
หากเกิดสัญญาณกลับตัวลง → พิจารณา Sell
เป้าหมาย: 60.50–60.00
ยกเลิกมุมมองขาลงเมื่อราคายืนเหนือ 66.00
XAUUSD: ทองคำกำลังทดสอบความแข็งแกร่งของผู้ซื้อแม้ทองคำจะพยายามฟื้นตัว แต่แรงกดดันจากดอลลาร์ที่แข็งค่าและมุมมองดอกเบี้ยสูงของ Fed ยังคงเป็นอุปสรรคสำคัญ
บริเวณ 4,270–4,330 USD กลายเป็นแนวต้านสำคัญในระยะสั้น หากราคาไม่สามารถกลับขึ้นไปยืนเหนือโซนนี้ได้ แนวโน้มหลักยังคงเป็นขาลง
แผนการเทรด:
รอจังหวะ Sell บริเวณ 4,270–4,330
เป้าหมายแรก: 4,150
เป้าหมายถัดไป: 4,100 และ 4,050
ยกเลิกมุมมองขาลง หากราคาปิดเหนือ 4,330 USD อย่างชัดเจน.
XAUUSD M45: ทองคำฟื้นตัวจากจุดต่ำสุดรายสัปดาห์ แต่ 4,360 XAUUSD M45: ทองคำฟื้นตัวจากจุดต่ำสุดรายสัปดาห์ แต่ 4,360 ยังคงเป็นแนวต้านสำคัญ
การวิเคราะห์พื้นฐาน
ทองคำกำลังฟื้นตัวหลังจากการลดลงอย่างรวดเร็วหลังการประชุม FOMC ไปยังพื้นที่ต่ำสุดรายสัปดาห์ ความหวังเกี่ยวกับข้อตกลงสันติภาพสหรัฐ-อิหร่านกำลังสนับสนุนความต้องการระยะสั้นเนื่องจากนักเทรดทำกำไรจากดอลลาร์สหรัฐ
อย่างไรก็ตาม ท่าทีที่เข้มงวดของเฟดยังคงจำกัดการขึ้นราคา ตราบใดที่ดอลลาร์สหรัฐยังคงได้รับการสนับสนุนจากการคาดการณ์อัตราดอกเบี้ย ทองคำต้องการการยืนยันที่แข็งแกร่งขึ้นก่อนที่การฟื้นตัวจะกลายเป็นการต่อเนื่องที่ชัดเจน
การวิเคราะห์ทางเทคนิค
ในกรอบเวลา M45 ทองคำกำลังซื้อขายอยู่รอบ 4,314 หลังจากถูกปฏิเสธจากโซนแนวต้าน 4,360 - 4,380 พื้นที่นี้เป็นโซนขายหลักบนกราฟและยังอยู่ใกล้กับจุดสูงสุดที่แข็งแกร่งในปัจจุบัน
จากมุมมอง SMC ราคาฟื้นตัวจากจุดต่ำสุดรายสัปดาห์และกลับมาอยู่เหนือ OB ที่เป็นขาขึ้นภายใน อย่างไรก็ตาม แรงซื้อยังไม่แข็งแกร่งพอในขณะที่ราคายังคงต่ำกว่า 4,330 - 4,340
โซนการตอบสนองการซื้อที่สำคัญคือ 4,220 - 4,240 หากราคาถอยกลับเข้าสู่พื้นที่นี้และผู้ซื้อปกป้องได้ ทองคำอาจสร้างการเคลื่อนไหวฟื้นตัวอีกครั้ง หากราคาสูญเสีย 4,220 พื้นที่ด้านล่างถัดไปคือ 4,180 - 4,200
โซนราคาที่สำคัญ
ราคาปัจจุบัน: 4,314
แนวต้านระยะสั้น: 4,330 - 4,340
โซนขายหลัก: 4,360 - 4,380
โซนการตอบสนองการซื้อ: 4,220 - 4,240
แนวรับล่าง: 4,180 - 4,200
โซนความต้องการลึก: 4,055 - 4,080
การยืนยันขาขึ้น: เหนือ 4,340
ความเสี่ยงขาลง: ต่ำกว่า 4,220
แผนการเทรด
สถานการณ์หลัก: ซื้อจากการถอยกลับ
จุดเข้า: 4,220 - 4,240 หลังจากการยืนยันขาขึ้น
จุดหยุดขาดทุน: ต่ำกว่า 4,180
เป้าหมายกำไร 1: 4,330 - 4,340
เป้าหมายกำไร 2: 4,360 - 4,380
เป้าหมายกำไร 3: 4,400
เงื่อนไขการเข้า
ราคาถอยกลับเข้าสู่โซนซื้อ 4,220 - 4,240
ผู้ซื้อแสดงการปฏิเสธที่ชัดเจนจากพื้นที่นี้
กรอบเวลา M45 หรือต่ำกว่าก่อตัว CHOCH ขาขึ้น
ราคากลับมาอยู่ที่ 4,304 - 4,314 ด้วยความแข็งแกร่ง
หลีกเลี่ยงการซื้อหากราคาทะลุและยืนต่ำกว่า 4,220
สถานการณ์ทางเลือก: ขายจากแนวต้าน
จุดเข้า: 4,360 - 4,380 หลังจากการยืนยันขาลง
จุดหยุดขาดทุน: เหนือ 4,400
เป้าหมายกำไร 1: 4,330
เป้าหมายกำไร 2: 4,240
เป้าหมายกำไร 3: 4,200
เงื่อนไขการขาย
ราคาต้องทดสอบโซนขาย 4,360 - 4,380 และไม่สามารถทะลุขึ้นได้ หากมีการปฏิเสธขาลงปรากฏที่นั่น ทองคำอาจปรับกลับไปยังโซนแนวรับล่าง
สถานการณ์การแตก
จุดเข้า: ต่ำกว่า 4,220 หลังจากการยืนยันการแตกและทดสอบใหม่
จุดหยุดขาดทุน: เหนือ 4,250
เป้าหมายกำไร 1: 4,200
เป้าหมายกำไร 2: 4,180
เป้าหมายกำไร 3: 4,080
มุมมองโดยรวม
ทองคำฟื้นตัวจากจุดต่ำสุดรายสัปดาห์ แต่โครงสร้างยังไม่เป็นขาขึ้นเต็มที่ ระดับสำคัญแรกที่ผู้ซื้อจำเป็นต้องกลับมาคือ 4,330 - 4,340 ในขณะที่ 4,360 - 4,380 ยังคงเป็นโซนแนวต้านหลัก
แผนที่ดีกว่าคือหลีกเลี่ยงการไล่ราคากลาง รอให้มีการถอยกลับที่ชัดเจนเข้าสู่ 4,220 - 4,240 เพื่อยืนยันการซื้อ หรือการปฏิเสธจาก 4,360 - 4,380 เพื่อการตอบสนองการขายระยะสั้น
คุณคิดว่าทองคำจะปกป้อง 4,220 - 4,240 และฟื้นตัวอีกครั้ง หรือปฏิเสธจาก 4,360 - 4,380 ก่อน?
XAUUSD H1: เคลื่อนไหวในกรอบแคบก่อน FOMC รอเขตซื้อที่ชัดเจน XAUUSD H1: เคลื่อนไหวในกรอบแคบก่อน FOMC รอเขตซื้อที่ชัดเจน
การวิเคราะห์ปัจจัยพื้นฐาน
ทองคำเคลื่อนไหวในกรอบแคบเนื่องจากนักลงทุนยังคงระมัดระวังก่อนการตัดสินใจอัตราดอกเบี้ยที่สำคัญของ FOMC ตลาดกำลังรอสัญญาณที่ชัดเจนจากเฟดก่อนที่จะสร้างแนวโน้มที่แข็งแกร่งขึ้น
ในขณะเดียวกัน ข้อตกลงสันติภาพระหว่างสหรัฐฯ-อิหร่านยังคงกดดันดอลลาร์สหรัฐ ซึ่งยังคงให้การสนับสนุนระยะสั้นสำหรับทองคำ อย่างไรก็ตาม ก่อนผลลัพธ์ของ FOMC ราคายังคงเคลื่อนไหวในกรอบแคบและล่อลวงสภาพคล่องทั้งสองด้าน
การวิเคราะห์ทางเทคนิค
ในกรอบเวลา H1 XAUUSD กำลังซื้อขายอยู่ที่ประมาณ 4,324 เคลื่อนไหวในกรอบแคบต่ำกว่าเขตต้านทานที่ 4,333 - 4,340 แนวโน้มระยะสั้นยังคงเป็นขาขึ้น แต่แรงซื้อเริ่มชะลอตัวใกล้บริเวณสูงสุดปัจจุบัน
จากมุมมอง SMC ราคายังคงอยู่เหนือ OB ขาขึ้นภายใน แต่ OB ขาลงภายในที่ 4,333 - 4,340 กำลังทำหน้าที่เป็นแนวต้านที่ใกล้ที่สุด หากราคาปฏิเสธจากบริเวณนี้ ทองคำอาจปรับตัวลงก่อนที่จะพบปฏิกิริยาซื้อครั้งต่อไป
เขตหลักที่ต้องจับตามองสำหรับโอกาสซื้อคือ 4,220 - 4,240 นี่คือบริเวณที่รออยู่บนกราฟที่ราคาจะกลับมาเก็บสภาพคล่องและสร้างปฏิกิริยาขาขึ้นที่ดีกว่า ตราบใดที่การสนับสนุนนี้ยังคงอยู่ ทองคำสามารถดำเนินโครงสร้างการฟื้นตัวต่อไปได้
เขตความต้องการที่ลึกกว่าคือ 4,055 - 4,080 ใกล้บริเวณต่ำสุดก่อนหน้านี้ เขตนี้จะมีความสำคัญก็ต่อเมื่อราคาสูญเสียการสนับสนุนที่ 4,220 - 4,240
เขตราคาที่สำคัญ
ราคาปัจจุบัน: 4,324
OB ขาลงภายใน: 4,333 - 4,340
OB ขาขึ้นภายใน: 4,300 - 4,315
เขตปฏิกิริยาซื้อหลัก: 4,220 - 4,240
เขตความต้องการที่ลึกกว่า: 4,055 - 4,080
บริเวณสูงสุดปัจจุบัน: 4,360 - 4,370
การยกเลิกขาขึ้นระยะสั้น: ต่ำกว่า 4,220
แผนการซื้อขาย
สถานการณ์หลัก: ซื้อจากการดึงกลับ
จุดเข้า: 4,220 - 4,240 หลังจากการยืนยันขาขึ้น
หยุดขาดทุน: ต่ำกว่า 4,190
ทำกำไร 1: 4,300 - 4,315
ทำกำไร 2: 4,333 - 4,340
ทำกำไร 3: 4,360 - 4,370
เงื่อนไขการเข้า
ราคาดึงกลับเข้าสู่เขตปฏิกิริยาซื้อ 4,220 - 4,240
ผู้ซื้อแสดงการปฏิเสธขาขึ้นที่ชัดเจนจากบริเวณนี้
CHOCH ขาขึ้นปรากฏใน H1 หรือกรอบเวลาที่ต่ำกว่า
ราคายังคงอยู่เหนือ 4,220
หลีกเลี่ยงการซื้อหากราคาทะลุและคงอยู่ต่ำกว่า 4,220
สถานการณ์ทางเลือก: ซื้อจากความต้องการที่ลึกกว่า
จุดเข้า: 4,055 - 4,080 หลังจากการยืนยันขาขึ้นที่แข็งแกร่ง
หยุดขาดทุน: ต่ำกว่า 4,020
ทำกำไร 1: 4,220
ทำกำไร 2: 4,300
ทำกำไร 3: 4,333 - 4,340
เงื่อนไขการซื้อ
การตั้งค่านี้จะมีผลก็ต่อเมื่อทองคำสูญเสียเขตซื้อแรกและเคลื่อนไหวลึกเข้าสู่เขตความต้องการ 4,055 - 4,080 ผู้ซื้อจำเป็นต้องแสดงปฏิกิริยาที่แข็งแกร่งที่นี่ก่อนที่จะพิจารณาการตั้งค่าซื้อใด ๆ
สถานการณ์ขาย
จุดเข้า: ต่ำกว่า 4,220 หลังจากการยืนยันการพังทลายและการทดสอบใหม่
หยุดขาดทุน: เหนือ 4,250
ทำกำไร 1: 4,120
ทำกำไร 2: 4,080
ทำกำไร 3: 4,055
เงื่อนไขการขาย
การตั้งค่าการขายจะมีผลก็ต่อเมื่อราคาทะลุต่ำกว่า 4,220 และไม่สามารถเรียกคืนได้ สิ่งนี้จะแสดงให้เห็นว่าโครงสร้างการฟื้นตัวระยะสั้นกำลังอ่อนแอลง และทองคำอาจเคลื่อนไหวกลับไปยังเขตความต้องการที่ลึกกว่า
มุมมองโดยรวม
ทองคำกำลังเคลื่อนไหวในกรอบแคบต่ำกว่าเขตต้านทาน 4,333 - 4,340 ขณะที่ตลาดรอทิศทางจาก FOMC โครงสร้างระยะสั้นยังคงเอนเอียงไปทางขาขึ้น แต่การซื้อโดยตรงใกล้บริเวณสูงสุดมีความเสี่ยง
แผนที่ดีกว่าคือรอให้ราคาดึงกลับเข้าสู่เขตซื้อ 4,220 - 4,240 และมองหาการยืนยัน ตราบใดที่บริเวณนี้ยังคงอยู่ ทองคำอาจขึ้นต่อไปที่ 4,333 - 4,340 และ 4,360 - 4,370
คุณคิดว่าทองคำจะทดสอบเขตซื้อ 4,220 - 4,240 ก่อนที่จะขึ้นสูงขึ้น หรือทะลุเหนือ 4,340 โดยตรงหลังจาก FOMC หรือไม่?
XAUUSD H2: ทองคำยังถือจังหวะฟื้นตัวหลังจากดีดขึ้นจากโซน 4,050 USD ทองคำยังทรงตัวได้ดีเหนือบริเวณ 4,320–4,330 USD แสดงให้เห็นว่าแรงซื้อยังพยายามประคองราคาในโซนสูง
หากราคายังไม่หลุด 4,300 USD โอกาสขึ้นต่อไปหา 4,360 USD และ 4,380–4,400 USD ยังเปิดอยู่
แต่ถ้าหลุด 4,300 USD ภาพฟื้นตัวระยะสั้นอาจเริ่มเสียโมเมนตัม
XAUUSD: การิส เทรน ไนค์ อดาลาห์ โซนา เปเนนตูXAUUSD ดูในส่วนนี้ของโครงสร้าง ในหน้า yang cukup gelas setelah membentuk titik terendah di sekitar 4.060 ราคานาฬิกาอยู่ที่ 4.313,015 และ 4.285,200 และ 4.285,200
เกกัวตันกราฟิกเริ่มต้น terletak pada garis tren naik yang mendukung seluruh pemulihan เกติกา ราคา โซน 4.285,200, แท่งเทียนจิกา มุนคัล พร้อม ซัมบู บาวาห์ หยาง ปันจัง, แท่งเทียน คอนเฟิร์มบาสิ รั้น, หรืออาเตา เรกซี เบลี หยาง เจลาส, อาดา เคมุงคินัน เบซาร์ บาฮวา เอมัส อะคาน เมมเบนตุก ทิติก เทอเรนดาห์ เลบีห์ ติงกิ เซเบลัม เมลันจุตกัน เคไนคาน
RSI พิจารณาการซื้อมากเกินไป, ยังเป็นสมาชิกอยู่ก่อนอื่น. Selama harga tidak menembus di bawah garis tren naik, สีชมพู masih memiliki keuntungan dalam jangka pendek.
กลยุทธ์ยัง disarankan:
เบลี: เซกิตาร์ 4.285.200
SL: น้อยกว่า 4,260,000
ประสบการณ์: 4,385,500
SpaceX Goes Public Today — Buckle Up, This Rocket Is...🚀 SpaceX Goes Public — The Biggest IPO in History Just Launched
Elon Musk started with a 10% chance of success. Today he rang the Nasdaq bell. Here's why everyone is watching ticker SPCX.
"It is hard to believe that a little company that started in a warehouse is going public in the largest IPO ever. If people had told me this was going to happen, I'd be like — you must be smoking some really good crack."
— Elon Musk, Starbase HQ, June 12, 2026
SpaceX didn't go public because growth slowed — it went public in the middle of a rocket-fueled explosion. Starlink already serves millions globally. Starship is being tested for Moon and Mars missions. And Musk holds 82% voting control — so the man with the vision stays firmly in command.
ARK Invest projects SpaceX could reach $3.1 trillion by 2030 — nearly double today's valuation. This isn't just a rocket company. It's the internet in space. It's the highway to the Moon.