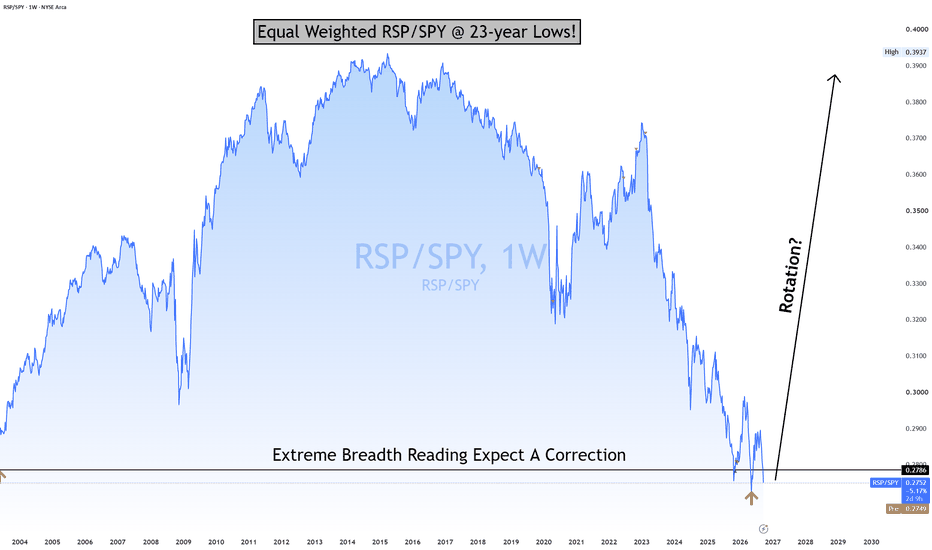
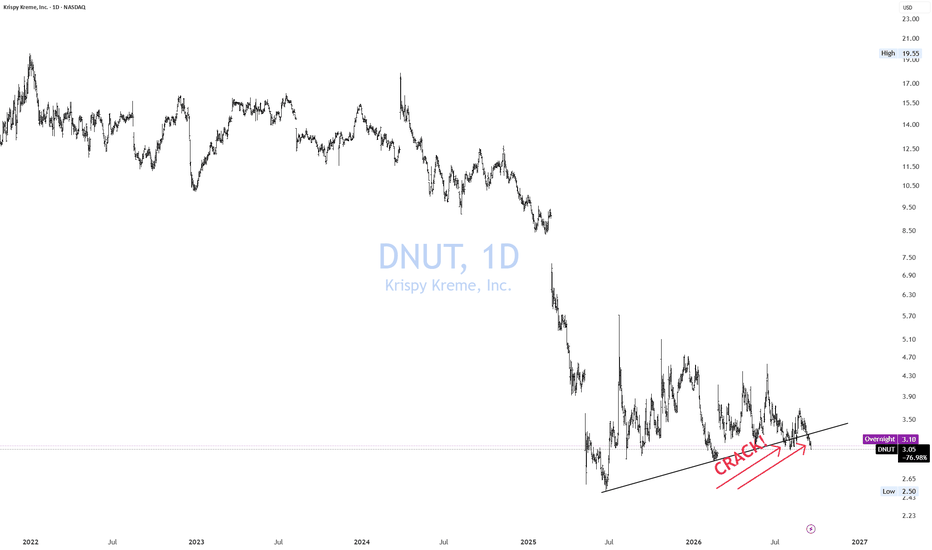
CRACK! Spread.The gasoline crack spread is approaching the same level reached after Russia invaded Ukraine—even though the disruption from Iran is far worse.
This isn’t booming demand. Refineries are already running near full capacity while war, damaged infrastructure and disrupted shipping have created a shortage of finished fuel.
Yet crude oil remains strangely disconnected from the fuels consumers actually use. The Trump regime’s manipulation of the headline oil price is now front and center.
The world doesn’t run on crude oil. It runs on gasoline, diesel and jet fuel—and that is where the real shortage is showing up.
If crude oil is genuinely bearish, why are refiners being paid nearly $60 a barrel to turn it into gasoline? 😆
Ticking Time bomb!
If you enjoy the work: 👉 Drop a solid comment. Let’s push it to 7,000 and keep building a community grounded in raw truth, not hype.
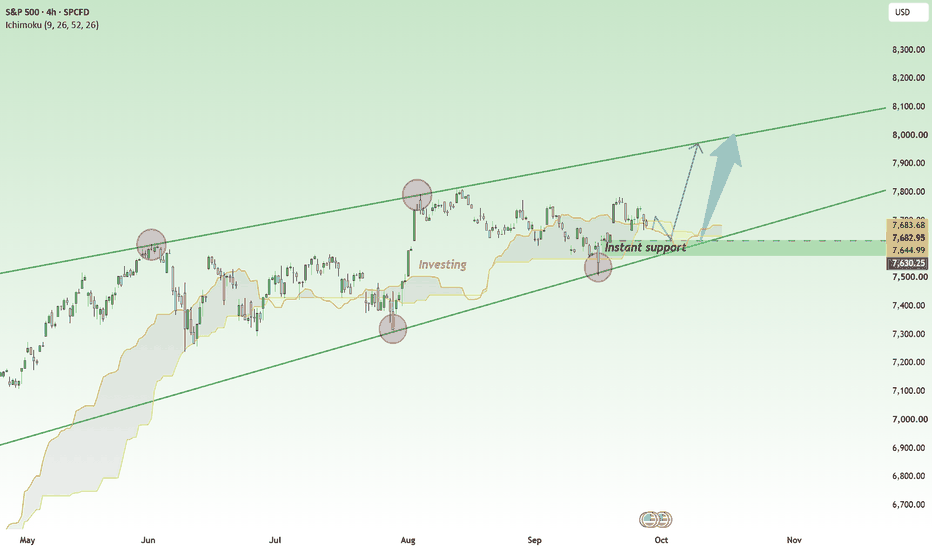
Investing
SOX Time@Mode #1: The Speedlines Cross Friday at 12,424.Everyone called the top in semiconductors last month. On my own timeframes, only one of them agreed.
The daily turned down. The weekly and the monthly are both still bullish. That is the whole disagreement, and the chart picks a side this week.
Look at the two panes. On the monthly, the advance off the April 2025 low is intact and the structure has not broken. On the daily, the selloff printed a drawdown north of 20% off the June high, and then the low bounced off the uptrend speedline rather than cutting through it. At 12,410 the index has clawed back to about 15% under that high. Real damage, still confined to the lower timeframe.
Friday is the first test. The 50% speedlines off the uptrend and the downtrend converge at 12,424, and price is already sitting on it. If that settles nothing, the 25% speedlines cross on August 7 at 13,055.
Everything that decides this falls between those two dates. The Fed meets on the 28th and 29th. Meta and Microsoft report after the close on the 29th, Amazon on the 30th. The next round of capex numbers lands on top of a rate decision, and then the chart reaches its second crossing.
Higher up sit two Warsh-era FOMC levels, 13,291.75 and 13,876.77. Those are the prices that baked in expectations going into those meetings, the same construction that has been capping QQQ at 731.62. Semis have to clear both before the monthly bull case means anything again.
This week's earnings argued for more upside. Texas Instruments guided the September quarter up around 8% sequentially, analog reaccelerated, embedded turned after lagging the entire correction, and data center showed up on their growth list. Cloud growth accelerated at Alphabet. Nobody reported a demand problem.
Then look at how the buyers are paying for it. Alphabet doubled quarterly capex year over year, went free cash flow negative, halted buybacks entirely, and raised 49.6 billion in equity and preferred in June with AI infrastructure named in the use of proceeds. Tesla capex is up 142% year over year and went free cash flow negative for the first time since early 2024. For three years this build came out of operating cash flow. A self funded build barely notices the rate path. An issued one does.
**Holding 12,424:** the daily loses the argument and 13,055 becomes the next test rather than a ceiling, with the two Warsh levels above it.
**Losing it:** the daily read carries, and the monthly still has to break before the rest matters. Only then am I looking at 9,755, and 7,095 into year end.
Invalidation is a monthly reclaim of 14,246.96. That prints and the bear case is finished outright, no reinterpretation.
Macro and Time@Mode, same as always. Everything I publish is timestamped.
Fed blackout; AI-capex cluster, tariff sunset 7/24Four dated events inside five days carry the tape into the July 28-29 FOMC and the Fed is in blackout the whole week. USTR Section 301 determinations on Monday 7/20 (weakly sourced date, verify). The midweek after-close earnings cluster (TSLA, TXN, NOW and IBM's formal print Tuesday, GOOGL the Wednesday marquee) is the first live test of the AI-capex top read that fired on 7/17 across the semis and hyperscaler shorts.
The SOX closed the week -12.5% and over 20% off its late-June high, bear-market territory, after China's Moonshot open model. Section 122 sunsets 00:01 ET Friday 7/24, taking the US effective tariff rate from about 11% to about 8.2% absent a Congressional extension (no extension bill pending). Friday 9:45 the Flash PMIs land, composite consensus ~51.9 (July), June manufacturing 55.7 and services 51.3. Composite over 50 keeps the growth crack un-tripped and the higher-for-longer, no-cut regime intact.
On Saturday I posted the QQQ weekly-top call: QQQ closed the week -4.16% at 695.33, back under the first Warsh FOMC key level 731.62 (my median of the event range, the price that bakes in expectations plus reaction plus digested positioning around the regime-reset FOMC). Weekly signal projects five downside targets stacking to 468. Structure rhymes with the January 2022 top. Invalidation is a weekly close over 731.62. SPY closed under its Warsh line 745.41 too, so the AI-capex re-rate is broader than one index.
Energy stays the receipt: Brent through $90 on the Monday reopen on an open US-Iran shooting war around the Strait; gasoline long half booked and a runner on (products over crude); NWE diesel crack a record ~$60-66 on Russia's producer-inclusive export ban. Signals scorecard: BULL 4 / BEAR 3 / NEUTRAL 11, two factors past kill lines (P/E 26.7x over 25, Junk Spreads 2.71 under 3.0). VIX 18.4 is sub-20 into the tariff binary and the AI-capex cluster; own cheap optionality over the directional bet.
Best of luck!
Cheers,
Ivan Labrie.
IRS - Can Buyers Defend the Broader Uptrend?IRS is one of Argentina's largest real estate companies, with a diversified portfolio that includes shopping centers, office buildings, hotels, and residential developments. The stock is often followed by investors seeking exposure to the Argentine real estate sector.
From a technical perspective, the stock remains overall bullish, continuing to trade inside the red ascending broadening wedge that has guided the long-term trend.
Following the rejection from the upper red resistance area, price is approaching an important technical region where the lower boundary of the broadening wedge aligns with a blue support zone.
⭕As price approaches this support area, we can start looking for trend-following buy setups on lower timeframes, anticipating a potential continuation of the broader bullish trend.
⭕However, if price breaks below the current support zone, the focus shifts toward the next lower support area, where buyers may become active once again.
Price action around this technical region may reveal whether the broader bullish structure remains intact, or if sellers have other plans.
⚠️ Disclaimer: This analysis reflects my personal market view and is not financial advice.
Rayan Nasser
#IRS #Stocks #Investing #TechnicalAnalysis #PriceAction #MarketStructure #TrendAnalysis
AMD GAP, CRACK & CRAP!AMD chart is a great chart to demonstrate what Euphoria looks like.
Up 660% in a little over a year.
Two Gap
Two CRACKS
One Crap coming right up!
It will be a bloodbath!
GAP fills more often than not. Want to bet NOT well, I wish you all well!
Ticking Time bomb!
If you enjoy the work: 👉 Drop a solid comment. Let’s push it to 7,000 and keep building a community grounded in raw truth, not hype.
NFLX & NVDA = Hagia Sophia WARNING!🚨 WARNING! NVDA is the next NFLX
I first started warning about NFLX in the summer. You can see the formation setups step by step here. From H&S to the Hagia Sophia (rounding top) with a tower (head test)
The only time you will see such a pattern is at tops!
The H&S never failed. instead it head tested, which ended up being extreme. (Not uncommon in a raging, euphoric, bubbalicious market.)
What is most important about the Hagia Sophia pattern is that it signals that we are in the endgame stages of the move.
It's time to GTFO & STFO!
When exactly you GTFO is not as relevant as actually GTFO! You always need an exit strategy. Otherwise, you will ride it all the way back down, right into losses.
Shorting it on the other hand is differnet animal. This is the time to start picking your battles. Dipping your toe in the water, ready to take losses until it fails.
In this case, there were 3 key areas (CRACKS) to short. Two out of the 3 would have gotten you huge gains IF you understood the pattern.
NVDA looks the same today as NFLX looked back in the summer.
If you are long - GTFO RUN with Profits & STFO!
If you want to short wait for the next key area to CRACK!
Lastly, I bet you are wondering if NFLX is done going down? Answer is NO!
NFLX is now at 4️⃣ Deep Decline (-30%) — Moral Pressure Phase
“Buy when there’s blood in the streets”
“This is how generational wealth is made”
“The smart money is buying”
“Be greedy when others are fearful”
“This is once-in-a-decade”
📌 Translation: We need new buyers to absorb forced selling.
#FAFO
If you enjoy the work:
👉 Drop a solid comment
Let’s push it to 6,000 and keep building a community grounded in raw truth, not hype.
RKLB - Trend-Following Opportunity Under Watch!RKLB (Rocket Lab) is a leading space technology company specializing in satellite launches, spacecraft manufacturing, and space systems. As one of the fastest-growing companies in the commercial space industry, it has attracted significant interest from long-term growth investors.
From a technical perspective, the stock remains overall bullish, continuing to respect the red ascending broadening wedge that has guided the long-term trend.
Price is now testing an important technical area where the lower boundary of the broadening wedge aligns with a weekly demand zone, creating an attractive region to monitor for a potential bullish reaction.
⭕As long as this support area continues to hold, we can start looking for trend-following buy setups on lower timeframes, anticipating a continuation of the broader bullish trend.
⭕However, if price breaks below the current demand zone, the focus shifts toward the lower blue support and demand area, where another buying reaction may develop.
The reaction from the current support area may provide a better indication of whether buyers are ready to resume the long-term uptrend, or if the current correction still has room to extend lower.
⚠️ Disclaimer: This analysis reflects my personal market view and is not financial advice.
Rayan Nasser
#RKLB #RocketLab #Stocks #Investing #TechnicalAnalysis #PriceAction #MarketStructure #Space
S&P 500 Daily Chart Analysis For Week of July 17, 2026Technical Analysis and Outlook:
The S&P 500 Index scored a substantial retreat in this week's trading activity from the Key Resistance 7,578 and successfully hit our Mean Support level at 7,440, indicating an upcoming strong bounce to continue the current rebound, eyeing a retest of the completed Outer Index Rally 7,610 via the Key Resistance 7,578 mark.
On the other side of the fence, there exists a significant likelihood of a pump-and-dump to resume the current active Retracement to Mean Support 7,355. This colossal movement may trigger a sustained, violent downward price trend to retest our completed Inner Index Dip of 7,295.
EUR/USD Daily Chart Analysis For Week of July 17, 2026Technical Analysis and Outlook:
Last week, the Eurodollar showed significant movement after retesting the Mean Support level at 1.138 and subsequently reaching the Mean Resistance level at 1.147. An upward trajectory might be at play here, potentially topping out with the completion of the Inner Currency Rally, designated at 1.149.
The session concluded with a retracement, suggesting a downside movement and indicating a repeat of the retest at Mean Support 1.138, alongside a movement to Key Support at 1.135, as well as a retest of the completed Inner Currency Dip at 1.133.
Bitcoin(BTC/USD) Daily Chart Analysis For Week of July 17, 2026Technical Analysis and Outlook:
In the previous week’s Bitcoin price action, the coin maintained its upward trend after retesting the Mean Support level at $62,500. It then rose higher to establish the Mean Resistance at $65,000, indicating potential further movement towards the Key Resistance at $66,300. This sets the stage for a strong push toward the Inner Coin Rally target of $69,500.
On the other side of the coin, there is also a sign that the crypto market may face a retracement. This could see Bitcoin decline from its current position to retest the Mean Support levels at $62,500 and $61,200, and possibly drop to the completed Inner Coin Dip at $58,500, along the critical Key Support at $58,600.
FSLR is trading near $185, sitting 0.9x weekly ATRFSLR is trading near $185, sitting 0.9x weekly ATR from its 200-week EMA. That distance places it inside the defined buy zone (≤1x ATR from the 200W EMA), well short of extended (≤4x). The 200-week EMA is up 31% over the last two years and still rising, with the 50-week EMA above it.
Gate 1, trend A rising 200W EMA with price pulled back to touch it, not through it, and the 50W holding above the 200W, is the structural definition of an intact long-term uptrend resting at support rather than breaking down. That's the first gate, and it's confirmed here.
Gate 2, momentum Confirm momentum is turning up from this level rather than still falling before treating this as a live entry. On a name this volatile a pullback to trend support is not the same as a base already forming. Wait for the weekly candle to show the reset resolving before sizing in.
Gate 3, risk Entry zone: near $185. Scale-out targets, scaled to this asset's own ATR: TP1 → $327 (+76%) TP2 → $468 (+152%) TP3 → $694 (+274%)
Volatility context: 14-day ATR is $11.44, average daily range $10.67, an expected day of roughly ±$11.44, around 6% of price. This is a genuine mover, which is both the source of the wide upside targets and the reason position size matters more here than on a slow name. A 1.5x ATR stop from entry is roughly $17.16 of room. No trailing stop until price reclaims and holds above the 50-week EMA, tightening risk before the trend has actually resumed just invites noise-driven stop-outs on a stock that swings this hard.
The seasonality overlay Kept in perspective, because this is a mild tailwind rather than the headline. Averaged over the last five years, FSLR has closed green in 7 of its 12 calendar months with a positive average monthly return of +2.65%. The strongest month has historically been May and the weakest June, both now behind us, so the seasonally worst stretch of the year has already passed. The structure is the reason this is on the chart. The calendar simply isn't working against it.
Build in stages rather than one entry. No leverage, and size it for the volatility. Assess Gate 1 first, then Gate 2, then size Gate 3 off current ATR, not a static stop distance.
Not financial advice. All commentary is for analytical purposes only.
ORCL - From Erections Come CorrectionsORCL is a textbook example of a setup I call: “From Erections Come Corrections.”
1. It also shows why log charts lie to you on the way down.
When you’re evaluating downside risk, remember: every stock is always 100% away from zero.
A linear chart makes the real danger obvious. I don’t even need to measure this one — the drop is roughly 50% staring you in the face.
2. Look at the speed of that drop.
If you’re one of those heroes trying to squeeze an extra 3% at the top and end up wearing a -50% drawdown because you had no exit plan… that’s not bad luck — that’s greed and negligence teaming up to hand you a bag of sh*t.
3. But if you actually respected risk, took profits, and GTFO/STFO with cash in hand?
Now you get to walk back in as a well-refined gentleman or lady, gracefully to start building a position at at a “500% discount,” as Trump would say.
4. Notice anything magical on my chart?0
No algos. No secret indicators. No fairy-tale narratives. Not even candlesticks. Just plain vanilla price action.
That’s proper charting. Keep it simple.
You chose to play this game, so at least play it right.
Lastly, if the market tanks here, ORCL will just keep tanking as well. BUT! you will be getting in with a 50% discount already. That, my friends, is the difference.
THANK YOU for getting me to 5,000 followers! 🙏🔥
Let’s keep climbing.
If you enjoy the work:
👉 Drop a solid comment
Let’s push it to 6,000 and keep building a community grounded in truth, not hype.
ABEV - Bearish Trend Faces a Major Test!ABEV (Ambev S.A.) is one of the largest beverage companies in Latin America, producing and distributing well-known beer, soft drink, and beverage brands across the region. The stock has attracted long-term investors due to its strong market position and defensive business model.
From a technical perspective, ABEV remains overall bearish, continuing to trade inside the red descending channel that has guided price action over the longer term.
Over the past few years, price has been consolidating inside the orange trading range and has now reached an important technical area where the upper boundary of the descending channel aligns with the range resistance.
⭕This confluence creates an attractive area to monitor for sell setups on lower timeframes, particularly if price shows signs of rejection from the current resistance.
⭕However, if buyers manage to break above both the range resistance and the descending channel, it could provide the first strong indication that the long-term bearish trend is losing control and that a broader bullish reversal may be beginning.
The reaction around this technical zone may determine whether sellers can maintain control of the broader trend, or if buyers are preparing to shift the long-term market structure.
⚠️ Disclaimer: This analysis reflects my personal market view and is not financial advice.
Rayan Nasser
#ABEV #Stocks #Investing #TechnicalAnalysis #PriceAction #MarketStructure #TrendAnalysis
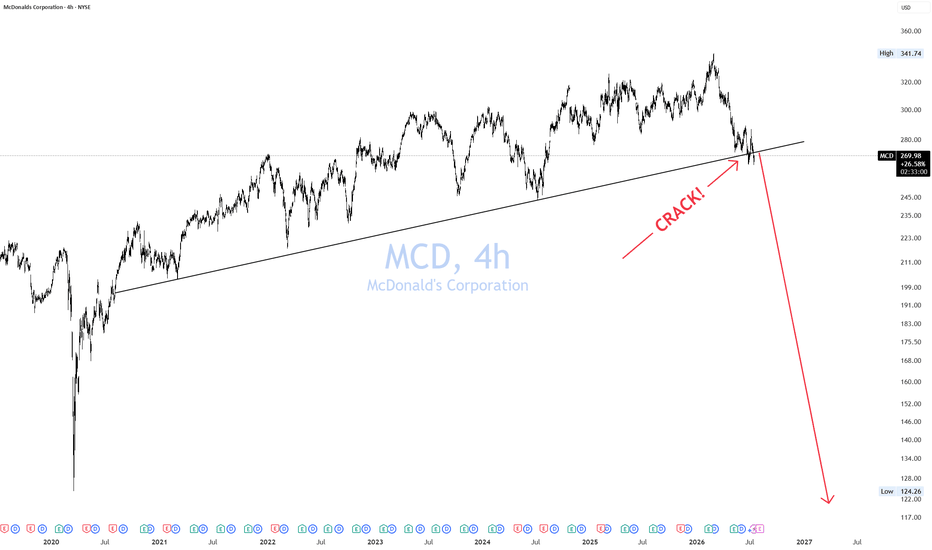
MCD Cracking!Short and Sweet!
Consumer is weakening
Fewer customers walking in
Stock is too expensive for its industry
Margins are under pressure
Competition has intensified
Forget about growth!
It's not by chance that MCD is cracking a key area.
Great short opportunity. No one should be long this.
If you enjoy the work: 👉 Drop a solid comment. Let’s push it to 7,000 and keep building a community grounded in raw truth, not hype.
Is USD/CLP Just a Bet on Copper Prices?USD/CLP trades near 933 today, up almost 1% in a single session and roughly 4% weaker over the past month. ING's currency strategists see 940 to 950 as the summer ceiling. Their reasoning is simple: firm copper prices should cap the peso's downside even as energy costs rise elsewhere. That single sentence captures the entire Chilean peso story. This currency trades less like a sovereign FX pair and more like a copper derivative with a government attached.
Macroeconomics: A Currency on Autopilot
Chile's central bank holds its policy rate at 4.50%. Real interest rates sit near a modest 1.5%. Markets price a small chance of one more cut, but strategists doubt it happens until the Federal Reserve's own path clarifies. Growth is expected near 2.5% for 2026 and 2027, respectable but unspectacular for an emerging market.
The more interesting number is Chile's current account deficit, running above 2% of GDP. That gap needs financing, and copper exports are what finance it. Copper's terms-of-trade shock has surged as much as 35% from its April low point this year. When copper is this strong, the deficit hardly matters. When it weakens, the peso's real vulnerability shows immediately.
Geopolitics: A Hard-Right Government Meets Global Realignment
Chile just underwent its sharpest political shift in decades. José Antonio Kast won December's runoff with 58% of the vote and took office on March 11, 2026, becoming the country's most conservative president since the Pinochet era. Days after his inauguration, his finance minister announced a $6 billion spending cut, and by May the government had already reshuffled its cabinet. His government immediately positioned itself closer to Washington, with the US ambassador publicly welcoming warmer ties under the new administration.
That alignment is not without friction. China remains Chile's second-largest trading partner at 17% of total trade, and Kast has insisted Chile can maintain strong ties with both Washington and Beijing simultaneously. Analysts are less certain, warning that Chile's economic dependence on China's copper demand could collide with its new ideological alignment with Trump's Washington.
A second geopolitical channel runs through energy and industrial inputs. Petroleum products make up roughly 20% of Chile's imports, so Middle East-driven oil spikes hit directly. Less obviously, Chile's copper producers depend on sulfuric acid for ore leaching, a supply chain also disrupted by Middle East tensions and Chinese export curbs.
Industry Trends and Business Models: The Cathode Exemption
Chile occupies a genuinely privileged position in the global copper trade war. Roughly 99% of its copper exports to the United States arrive as refined cathodes, and cathodes currently enter the US tariff-free even as Washington debates broader Section 232 duties on refined copper. That exemption, for now, insulates Chile's core export from the tariff risk hanging over other producers.
The business model risk sits elsewhere, in the sulfuric acid supply chain. Copper leaching requires steady acid input, and China's export curbs plus Middle East disruption have squeezed that input at exactly the moment global copper demand is accelerating. Producers are diversifying acid sourcing and investing in alternative extraction chemistry to reduce this single point of failure.
Management and Leadership: Fiscal Discipline Under Pressure
Finance Minister Jorge Quiroz set the tone within days of Kast's inauguration, ordering a 3% across-the-board cut to every ministry's budget, targeting roughly $6 billion in savings over eighteen months. That fiscal discipline aims to reassure credit rating agencies and bond markets simultaneously.
The central bank runs its own quiet, parallel operation. Chile's Treasury sells roughly $300 million a week, converting proceeds from FX bond auctions, while the central bank separately buys about $25 million a day, targeting $18 billion in reserve growth over three years. The goal is weaning Chile off its IMF Flexible Credit Line without spooking sovereign ratings, a delicate maneuver given that Chile's FX reserve adequacy already sits below recommended levels.
Technology and Science: Beyond Copper
Chile's technological relevance extends past copper into lithium. The country sits inside the so-called Lithium Triangle alongside Argentina and Bolivia, and ranks among the world's largest lithium producers. Battery-grade lithium extraction technology, including newer direct extraction methods that reduce water use in Chile's arid salt flats, is now a genuine area of scientific investment.
Copper technology itself keeps advancing too. Chilean producers are investing in bioleaching and improved flotation techniques to offset declining ore grades, the same structural challenge facing miners globally.
Patent Analysis and Innovation
Chilean and multinational miners operating in the country are filing patents around lower-acid-intensity leaching processes, directly responding to the sulfuric acid supply vulnerability. Lithium extraction patents are climbing too, particularly around direct lithium extraction technology that bypasses traditional evaporation ponds. Both patent trends point toward the same goal: reducing Chile's exposure to single-input supply shocks.
Cybersecurity in Chile's Financial and Mining Backbone
Chile's economy runs through a small number of critical nodes: state copper giant Codelco, the central bank's reserve operations, and cross-border FX settlement systems. That concentration makes cybersecurity a genuine sovereign concern, not just a corporate one. Mining operations increasingly rely on automated extraction and remote monitoring, systems that require the same industrial control security now standard across the global mining sector.
Company Culture and Innovation
Codelco, Chile's state-owned copper giant, has spent recent years modernizing a historically slow-moving, state-run culture. Automation, remote operations centers, and efficiency-linked management incentives now sit alongside the company's traditional role as a fiscal cash cow for the Chilean state. That cultural shift matters directly for the peso, since Codelco's output efficiency feeds straight into the terms-of-trade story driving USD/CLP.
The Pharmaceutical Connection
Chile's lithium industry creates an unexpected pharmaceutical link. Lithium carbonate, the same class of compound extracted from Chilean brine, is a first-line psychiatric medication for bipolar disorder. Global pharmaceutical-grade lithium supply chains draw on the same Atacama Desert brine operations that feed battery manufacturers. It is a modest connection next to copper's dominance of the peso story, but a genuine one.
Closing Thoughts
USD/CLP is, in practice, a leveraged proxy for global copper demand wrapped in a sovereign currency wrapper. Chile's new hard-right government, its careful reserve-building program, and its cathode tariff exemption all matter, but they are secondary to a single variable: whether copper holds above $13,000 a tonne. Watch three things going forward: the resolution of the sulfuric acid supply squeeze, whether Kast's fiscal consolidation holds against falling approval ratings, and whether Washington ultimately extends Section 232 tariffs to refined copper. Any of the three could move this currency more than a full central bank meeting.
Will the Polish Zloty Unseat the Euro's Eastern Moat?The Illusion of Euro Dominance
The EUR/PLN exchange rate sits at a fascinating crossroads in July 2026. Recent trading pushed the pair toward the 4.33 level. A dovish shift from the National Bank of Poland (NBP) triggered this temporary weakness. However, underlying economic fundamentals paint a vastly different picture.
The Eurozone faces structural stagnation. Germany expects a meager 0.6% GDP growth this year. France grapples with rising debt and 0.8% growth.
In contrast, Poland boasts a robust 3.5% growth forecast. Massive inflows of European Union funds will soon flood the Polish economy. This fiscal divergence positions the Polish Zloty for a major long-term rally against the Euro.
Macroeconomics and Monetary Divergence
The interest rate differential between the NBP and the ECB continues to support the Zloty. The NBP maintains its benchmark rate at 3.75%. Meanwhile, the European Central Bank (ECB) struggles to balance inflation against high debt.
Poland’s central bank holds substantial ammunition to combat currency depreciation. Analysts at major banks predict the EUR/PLN rate will descend back toward 4.25.
Record-breaking structural conversions will drive this appreciation. Poland will receive €43 billion in EU recovery funds throughout 2026. Converting these massive euro reserves into zlotys creates relentless upward pressure on the currency.
Metric (2026 Forecast) Poland Eurozone Core
GDP Growth 3.5%,0.9%
Central Bank Rate 3.75% 2.25%
FDI Sentiment 94.5% Positive Sluggish / Declining
Geopolitics and the Rise of Military Keynesianism
Poland is rapidly transforming into Europe's front-line defense fortress. Geostrategic realities force Warsaw to prioritize national defense. The nation remains the prime beneficiary of the Security Action for Europe (SAFE) instrument.
Poland secured €43.7 billion in defense loans to modernize its forces. The program represents a form of military Keynesianism. Nearly 90% of these funds flow directly into domestic defense manufacturers.
This capital injection stimulates industrial production. It attracts secondary investments without adding immediate fiscal pressure on the state. Consequently, geopolitics bolsters the Zloty's long-term sovereign value.
The Strategic Shift: Poland is leveraging massive EU inflows and military investments to transition from a cheap industrial hub into a high-tech powerhouse.
High-Tech, Patents, and Innovation
Military modernization demands advanced physical technology. Polish private defense contractors, like WB Group, lead this charge. Patent analysis shows a massive spike in Polish aerospace and communications filings.
Engineers actively patent novel drone guidance systems and secure tactical networks. These technological innovations attract substantial foreign venture capital.
Furthermore, this high-tech boom trickles down into civilian sectors. Startups leverage military research to develop commercial automation tools. This scientific progress ensures that Poland remains a high-value industrial hub, not just a cheap assembly line.
Cybersecurity and Financial Integrity
Securing these vital technological networks is paramount. Poland faces constant cyber threats from eastern state-sponsored actors. The nation has deployed state-of-the-art cybersecurity command centers to protect its infrastructure.
These centers safeguard sensitive transaction databases and critical supply chains. Financial institutions in Warsaw utilize advanced cryptography to defend regional capital markets.
This security framework guarantees flawless transaction integrity. Investors value this cyber resilience. It reassures global markets that Polish financial assets remain exceptionally safe.
The Biotech and Pharmaceutical Connection
Poland's high-tech evolution extends to the pharmaceutical industry. The domestic biotechnology sector relies heavily on secure cross-border payment networks.
Biotech firms use the strong Zloty to import critical chemical precursors. Fast, secure transactions streamline clinical trials and drug manufacturing.
This currency strength directly lowers the procurement costs of essential medicinal ingredients. Polish scientific research institutes utilize secure financial rails to purchase high-end laboratory equipment. Therefore, EUR/PLN dynamics play a key role in regional healthcare logistics.
Industry Trends and Agile Business Models
Global corporations are rewriting their supply chain strategies. Companies are near-shoring production to stable European nations. Poland’s highly skilled workforce and strategic geography make it an ideal target.
Industry trends show massive foreign direct investment flowing into Poland. An impressive 94.5% of foreign firms state they would invest in Poland again.
Agile corporate business models leverage Poland's cost advantages to maximize global efficiency. The country's strong service sector surplus offsets goods deficits. This consistent investment inflow generates persistent, non-speculative demand for the Zloty.
Management, Leadership, and Company Culture
Polish technology companies cultivate an agile, flat company culture. This structural design enables rapid innovation and iteration.
Corporate leadership prioritizes technical execution over bureaucratic hierarchy. Executives quickly adapt to changing market conditions. This dynamic management style attracts elite global talent to Warsaw.
A high-performance work culture drives productivity across the nation. This productivity leap supports higher wages. Higher productivity ultimately builds a foundation of real value for the domestic currency.
Strategic Conclusion
The Zloty's temporary decline against the Euro represents a buying opportunity. The Euro struggles under the weight of German industrial decline. Conversely, Poland’s economy is soaring.
Massive EU fund conversions, defense spending, and technological leadership support the Zloty. The EUR/PLN exchange rate reflects a changing European order. The Polish Zloty is emerging as the premier anchor of stability in Central Europe.
Al Rajhi Bank: Facing Liquidity and Regional HeadwindsDespite reporting solid Q1 2026 results, with a 14% growth in net profit, several systemic and macroeconomic risk factors could exert pressure on the stock in the medium term. Prolonged instability linked to the Iranian conflict represents a material risk for the entire Saudi banking sector. If the conflict were to escalate, Fitch warns that asset quality, profitability, and bank liquidity could contract, forcing an increase in provisions for credit losses (impairment charges). The sector is facing a contraction in liquidity conditions, with loan-to-deposit ratios hitting record levels across the board. In a stress scenario, Al Rajhi Bank's liquidity position could be tested: estimates indicate that the liquidity coverage on deposits for Al Rajhi, Riyad Bank, and Bank Albilad could fall to critical levels (10% or less) in the event of significant outflows. Growing competition for deposit gathering is driving up the cost of funding. If interest rates remain "higher for longer," banks with a high reliance on certificates of deposit or subject to greater domestic competition would see their net interest margins (NIM) compressed. The massive adoption of fintech, instant payments, and digital banking in Saudi Arabia is "compressing" risk timelines. The need to constantly update Anti-Money Laundering (AML) frameworks and cybersecurity in a rapidly evolving environment entails increasing operational investments which, over time, could weigh on the cost-to-income ratio. Despite the positive Q1 2026 results, shares have shown immediate signs of weakness on the stock exchange, reflecting growing "market caution" rather than simple fundamental weakness. When a stock reacts negatively to positive news, it often signals that the market has already priced in optimistic growth scenarios, making the asset vulnerable to potential corrections should future expectations not be met.
CRM - Long-Term Bullish Structure at Key Support!CRM (Salesforce, Inc.) is one of the world's leading cloud-based software companies, providing customer relationship management (CRM) solutions that help businesses manage sales, marketing, customer service, and business operations.
From a long-term perspective, the stock remains overall bullish, continuing to respect the red ascending broadening wedge that has guided price action since 2018.
The current decline appears to be a corrective phase, with price moving inside the blue descending channel. It has now reached a key technical area where the lower boundary of the broadening wedge aligns with a strong support and demand zone.
⭕As long as this support area continues to hold, we can start looking for buy setups on lower timeframes. A break above the green trigger area around 210 would provide the first strong confirmation that buyers are regaining control and that the next bullish leg may be underway.
⭕However, if price breaks below the current support zone, the focus shifts toward the next major support area between 65 and 85, where another buying reaction may develop.
The reaction from this support area may reveal whether the current correction is approaching its end, or if sellers can extend the decline toward the next long-term support zone.
⚠️ Disclaimer: This analysis reflects my personal market view and is not financial advice.
Rayan Nasser
#CRM #Salesforce #Stocks #Investing #TechnicalAnalysis #PriceAction #MarketStructure #CloudComputing
S&P 500 Daily Chart Analysis For Week of July 10, 2026Technical Analysis and Outlook:
In the previous week's trading session, the S&P 500 Index posted a substantial gain after successfully retesting the Mean Support level at 7,440. This led the Index to surpass the Mean Resistance level of 7,553.
Forecasts indicate that this vital Index is likely to continue its upward trajectory, with the potential to revisit the completed Outer Index Rally at 7,610. Furthermore, there is the possibility of extending to the subsequent Outer Index Rally levels of 7,707 and 7,815.
On the other hand, there exists a significant likelihood of triggering an In-Force retracement back toward the Mean Support level at 7,440. This movement may trigger a sustained violent downward price trend, as shown in the accompanying chart.
EUR/USD Daily Chart Analysis For Week of July 10, 2026Technical Analysis and Outlook:
In last week’s trading session, the Eurodollar exhibited considerable volatility, oscillating between Mean Support at 1.138 and Mean Resistance at 1.147. The session concluded with a notable downward movement, pointing towards Mean Support 1.138, ultimately, with great fanfare, going deeper to hit the completed Inner Currency Dip 1.133.
On the other hand, currency players need to remain vigilant for a potential reversal from the current level, which could trigger an upward trajectory towards Mean Resistance at 1.147. This movement may come to a head in the completion of the significant Inner Currency Rally at 1.149.
Bitcoin(BTC/USD) Daily Chart Analysis For Week of July 10, 2026Technical Analysis and Outlook:
In the trading session of the previous week, Bitcoin sustained its upward course after retesting the Mean Resistance level at $64,300. Subsequently, it experienced a pullback to the Mean Support at $61,500, which signals potential for further advancement toward the Key Resistance at $66,300 and may spur a move toward the Inner Coin Rally target of $69,500.
On the other hand, there is a growing expectation that the cryptocurrency may undergo a retracement, declining from the Mean Resistance at $66,300 to the Mean Support at $64,000. Such a decline could result in a retest of the additional Mean Support at $61,500 and a revisit of the completed Inner Coin Dip at $58,500.
Is Micron Too Strong for Burry's Short Bet?Famed investor Michael Burry just shorted the entire semiconductor industry. Through a massive bet against the iShares Semiconductor ETF, Burry targets top player Micron Technology. Micron ranks among the ETF's two largest holdings, essentially tied with AMD near the top. The company recently posted a staggering 345% revenue growth. It supplies vital high-bandwidth memory (HBM) for AI data centers. However, Burry questions the sustainability of this AI hardware spending spree. Will this short position succeed, or will Micron continue its astronomical ascent? We must analyze Micron across multiple critical domains to find the truth.
Geopolitics and Geostrategy
Micron operates at the volatile center of global tech supremacy. The United States views semiconductor dominance as a national security imperative. Washington aggressively restricts advanced chip technology exports to China. Consequently, Micron faces complex geopolitical crossfires. Beijing previously banned certain Micron products from critical infrastructure. However, Micron maneuvers these geostrategic landmines by diversifying its global manufacturing footprint. The company builds new multibillion-dollar fabrication plants in New York and Idaho. This strategic domestic expansion secures vital supply chains. It also perfectly aligns with federal CHIPS Act incentives.
Macroeconomics and Economics
Burry grounds his short bet in macroeconomic reality. High inflation and elevated interest rates squeeze corporate IT budgets. A recent UBS survey reveals that 60% of businesses are curbing their AI spending. The underlying economics of AI remain unproven for many end-users. Tech giants buy billions in hardware, but their software profits lag. If these massive investments fail to generate immediate returns, capital expenditure will plummet. Despite these macroeconomic headwinds, Micron commands significant pricing power. Its fast-growing position in advanced HBM chips ensures robust short-term margins.
Industry Trends and Business Models
The semiconductor industry currently rides an unprecedented AI wave. Micron thrives by pivoting its business model toward premium AI components. Instead of selling low-margin consumer memory, Micron prioritizes data center solutions. High-bandwidth memory chips act as the ultimate bottleneck for AI processing. Nvidia and AMD desperately need Micron's HBM to power their GPUs. This symbiotic relationship locks in massive, long-term contracts. Consequently, Micron transitions from a cyclical hardware vendor to an indispensable AI infrastructure partner. However, Burry warns that this concentrated reliance on a single sector brings massive downside risk.
Technology, Science, and High-Tech
At its core, Micron executes a masterclass in applied physics and material science. The company pushes the absolute boundaries of extreme ultraviolet lithography. Engineers stack multiple silicon layers vertically to create HBM3E chips. This high-tech architecture dramatically increases data transfer speeds while reducing power consumption. Science dictates that pushing electrons through silicon generates massive heat. Micron solves this thermal challenge through groundbreaking packaging innovations. Its memory chips enable generative AI models to process massive datasets instantaneously. Without this technological leap, the current AI revolution simply halts.
Company Culture and Patent Analysis
Relentless innovation drives Micron's internal corporate culture. Management fosters a highly competitive engineering environment. The company aggressively files thousands of patents annually. A rigorous patent analysis reveals Micron's strong position in 3D NAND and DRAM architecture. The legal team aggressively defends this vast intellectual property portfolio against international espionage. This deep moat of patents helps prevent new entrants from disrupting the market. Employees consistently race to break data density records. This culture of excellence helps Micron narrow the gap with its larger HBM rivals.
Management and Cybersecurity
CEO Sanjay Mehrotra executes a flawless strategic vision. His leadership transformed Micron from a struggling manufacturer into an AI juggernaut. Management wisely anticipated the massive memory demands of generative AI early on. They decisively allocated capital to high-margin HBM research. Furthermore, leadership heavily prioritizes corporate cybersecurity. Hackers constantly target semiconductor companies to steal proprietary designs. Micron deploys military-grade cybersecurity protocols to protect its precious intellectual property. The executive team understands that a single data breach could destroy their competitive advantage overnight.
The Pharmaceutical Industry Connection
You might wonder how memory chips connect to pharmaceuticals. The link lies entirely within AI-driven drug discovery. Pharmaceutical giants deploy massive supercomputers to simulate molecular interactions. These AI models require immense computing power and instantaneous memory access. Micron's advanced chips slash the time needed to map complex proteins. Researchers now discover life-saving compounds in months rather than decades. Therefore, Micron acts as the silent, high-tech engine powering modern biomedical science. If AI hardware spending slows down, medical breakthroughs could tragically stall.
Conclusion
Michael Burry sees an unsustainable AI bubble ready to burst. He logically identifies the massive disconnect between hardware spending and software profits. However, shorting Micron requires betting against fundamental human progress. The company competes at the high-tech memory frontier through sheer scientific innovation. Its geostrategic importance and robust patent portfolio provide a meaningful defensive moat. Whether powering autonomous vehicles or revolutionizing pharmaceutical research, Micron remains indispensable. Burry might win a short-term market correction. Nevertheless, Micron's long-term trajectory as an AI titan appears overwhelmingly secure.