Euro Holds Key Support as Fed Hike Bets Firm and Oil CoolsEUR/USD traded lower on Friday but held a remarkably tight range for the week as a whole, with a heavy calendar failing to dislodge the pair from its recent footing. U.S. CPI landed roughly in line with expectations, and the Dollar firmed on the release as traders read the print as clean enough to allow the Federal Reserve to tighten next week. Offsetting that, crude retreated around 3% from its highs, easing the energy-linked drag that had weighed on the Euro through the first half of the week and leaving EUR/USD only modestly softer into the weekend.
The Euro's inability to capitalize on Thursday's ECB decision remains the story of the week. Policymakers raised rates and President Christine Lagarde struck a mildly hawkish tone, pointing to the likelihood of further increases through year-end, yet the single currency gained little traction as surging crude prices sustained safe haven demand for the Dollar. Friday reversed that dynamic in part: with oil off its highs and market-implied odds of a hike at next week's FOMC meeting now above 80%, the relative rate story is being priced from the U.S. side rather than the European one. That leaves the week ahead dependent primarily on the Fed, with oil back on the front page as a secondary driver; fresh highs in crude have so far translated into marginal Dollar strength against the Euro and other risk sensitive currencies.
In the above chart, EUR/USD rates are clinging to the 1.1600 handle after a week of compressed, two-way trade. The initial Dollar bid on the CPI release stretched the pair down to 1.1570, where the daily 50- and 100-EMAs (exponential moving average) cluster, and the rejection there ahead of the U.S. cash open was firm. Euro bulls now need a spot close above 1.1600, home to the 5- and 20-EMA cluster, to carry a neutral technical balance into next week. Dollar bulls, by contrast, need another test of support near 1.1580 that gives way on a closing basis; without it, Friday's probe lower reads as a failed break rather than the start of a larger downturn.  Long
Long
S&P 500 ($SPX) 4H: Price Action Retests Crucial 7,576S&P 500 ( SPCFD:SPX ) 4H: Price Action Retests Crucial 7,576 Support Baseline at Make-or-Break Wedge Confluence
### 🇺🇸 S&P 500 Index ( SPCFD:SPX / SPCFD) 4-Hour (4H) Technical Matrix (Ref: SPX_2026-09-11_08-41-26.png)
We are issuing an intraday 4-Hour (4H) technical update for the S&P 500 Index ( SPCFD:SPX / SPCFD). Following a corrective move off the recent macro high, price action has pulled back to test a key structural decision node, compressing directly along the lower boundary of its local consolidation wedge and horizontal polarity support.
The index is trading down **-0.10% (-7.71 pts)** at **7,591.69**, holding just above critical baseline support with volume recorded at **1.41B**.
---
### 🔍 Technical Architecture & Level Roadmap:
Our quantitative 4H framework isolates the core static thresholds, dynamic moving average guides, and trendlines governing this pivotal test:
1. **Immediate Decision Support Node Under Test:**
* **Key Horizontal Polarity Support:** **7,576.21** (red line) — Major structural pivot floor currently being actively tested.
* **Consolidation Wedge Lower Boundary:** Sloping trendline guide creating immediate confluence at the **7,576** node.
2. **Overhead Resistance Ceilings:**
* **17-Period Dynamic Resistance (17-EMA):** **7,664.09** (red line) — Trailing dynamic ceiling to reclaim to resume bullish intraday momentum.
* **Local Descending Trendline (LTD):** Upper diagonal barrier currently capping recent swing highs around the **7,720.00** area.
* **Macro High Resistance Target:** **7,806.20** — Primary horizontal range ceiling.
3. **Lower Institutional Demand Floor:**
* **200-Period Exponential Moving Average (200-EMA):** **7,457.62** (purple line) — Core institutional macro trend anchor and primary downside target if support fails.
---
### 🛡️ Strategic Operational Scenarios:
* **Scenario A — Bullish Bounce & Recovery (Blue Arrow Projection):** Buyers successfully defending the **7,576.21** horizontal floor and reclaiming **7,664.09 (17-EMA)** will confirm a bullish defense, driving momentum back toward the upper wedge boundary and the **7,806.20** peak.
* **Scenario B — Bearish Breakdown Below 7,576 (Red Arrow Projection):** A decisive 4H candle close below **7,576.21** invalidates local demand, unlocking acceleration down toward the **7,457.62 (200-EMA)** dynamic institutional floor.
### 📊 Tactical Parameters Summary:
* **Current Bias:** Neutral / Testing Key Support Node
* **Primary Decision Floor:** 7,576.21
* **Dynamic Resistance Ceiling (17-EMA):** 7,664.09
* **Macro Range High Target:** 7,806.20
* **Institutional Dynamic Floor (200-EMA):** 7,457.62
---
📊 **ChartPro Data**
*US Equities Architecture, Intraday Moving Averages & Systematic Risk Management.*
⚠️ **Disclaimer:** For educational and informational purposes only. This active market study represents a personal trading framework and does not constitute financial or investment advice.  Short
Short
$QQQ Daily Close — Sep 10NASDAQ:QQQ Daily Close — Sep 10
NASDAQ:QQQ closed 708.69, down 1.06%, below both @ripster47 EMA clouds. Price opened under the 34-50, high of the day was 712.06, and it closed at 708.69 — through the whole cloud. That's a 34-50 Break. The 5-12 Break came first in the same bar.
The volume finally answered the question
For six sessions I've been flagging the same thing on this chart: every up bar came on below-average volume. The Sep 3 curl, the follow-through, the bounces — all of it on light participation. The one day volume did expand was last Friday, and that was profit-taking into strength.
Today: 31.33M against a 30.77M average, 102% relative volume. First above-average day in a week. It came on a red bar that broke two clouds.
When buyers won't show up for six sessions and then sellers show up once, you have your answer about who was actually in this move.
The bar itself
Range 5.20 against a 9.01 ATR — 58% of a normal day, on above-average volume. More effort than result. Sellers had to work for a five-point move, which means there was some bid absorbing it, but not enough to matter. Close finished in the lower third at 708.69, no recovery into the bell.
What we did not get is climactic volume. This was above average, not heavy. Nobody has stepped in to catch it yet, and the 700 shelf below is untested.
My position
I'm out. The 5-12 Break on a closing basis is my exit rule and it fired today. That trade was up 1.6R last Friday and I gave it back — which is the honest cost of managing against a level instead of taking profit into a target. The rule did its job. I'd rather post that than pretend it didn't happen.
Levels into CPI
706.86 is today's low and it's the line. Lose it and 704 comes in, then 700 — which is both a psych number and a shelf that's been defended twice since June.
There is no long trigger until price reclaims the @ripster47 5-12 EMA cloud around 716. That's a 5-12 Curl and it's seven points away.
CPI tomorrow. A hot print is hawkish for the dollar and bearish for the indices, and it lands on a structure with nothing tested underneath. A cool print has to fight back through two clouds before it means anything.
One thing worth watching at 700: if we get there on genuinely heavy volume with a close well off the lows, that's stopping volume, and the read changes completely. Heavy volume at a major low is a buy signal, not a sell one.
Levels, not opinions. 706.86 below, 716 above.  Short
Short
GOLD: Big Rejection Coming? Bearish OB & Supply Confluence!🔻 XAUUSD (GOLD) – Bearish Setup Off Supply & OB! Target 4,319 🔻
Gold is setting up a high-probability short opportunity following a clean rejection from the descending trendline resistance and upper supply cluster. Price is building internal liquidity to sweep Buy-Side Liquidity (BSL) into the Bearish Order Block ($4,433.00) before initiating a strong bearish expansion toward lower demand pools.
📊 Smart Money Concepts (SMC) & Structural Breakdown
Liquidity Setup (BSL Sweep): Equal high structures forming just below the Bearish OB act as engineered liquidity. Expect a quick surge into the $4,430 – $4,435 zone to trigger retail buy stops before institutionally turning lower.
Bearish Order Block (OB): The supply block at $4,433.07 represents institutional heavy selling interest, coinciding directly with the long-term descending trendline confluence.
Trendline & Structure Confluence: Lower-high market structure remains fully intact on higher timeframes. The rejection from the trendline resistance reaffirms strong overhead distribution.
Target Liquidity Pool: Below current price levels, clean sell-side liquidity rests around $4,398.00 and $4,350.00, leading down to the primary target objective at $4,319.55.
🎯 Execution Parameters
Bias: Bearish (Sell on Rally / BSL Sweep)
Entry Zone: $4,430.00 – $4,435.00 (Post-BSL Sweep into Bearish OB)
Stop Loss (SL): $4,455.60 (Invalidation strictly above recent swing supply high)
Target 1 (TP1): $4,398.00 (Local Support & Structural High Low)
Target 2 (TP2): $4,350.00 (Mid-range Liquidity Pool)
Target 3 (TP3): $4,319.55 (Major Demand & Key Liquidity Target)
Risk-to-Reward Ratio (RRR): ~4.5R
💬 Will the trendline supply hold for a clean drop to $4,319, or are you expecting a bullish breakout above $4,455? Drop your technical perspective below!
👍 If you find this institutional breakdown valuable, please support with a like, comment, and follow for daily high-probability trade setups!
Disclaimer: This analysis is strictly for educational and informational purposes and does not constitute financial advice. Always practice strict risk management and position sizing based on your personal trading plan.
#XAUUSD #Gold #SmartMoneyConcepts #OrderBlock #ForexTrading #TechnicalAnalysis #TradingView #PriceAction  Short
Short
Ares Could Have Space to the DownsideAres Management bounced in July and August, but some traders may see downside risk.
The first pattern on today’s chart is the August 7 weekly close of $136.85. That level provided support for more than a month, but yesterday the private-credit company closed below it.
Second, the falling 200-day simple moving average could reflect a bearish longer-term trend.
Third, ARES ended January at $149.67 before dropping below that level. Its peaks in mid-August were in the same zone. Has resistance been confirmed at the old monthly close?
Finally, the 8-day exponential moving average (EMA) just crossed under the 21-day EMA. MACD is also falling. Those signals may be consistent with a bearish short-term trend.
TradeStation has, for decades, advanced the trading industry, providing access to stocks, options and futures. If you're born to trade, we could be for you. Learn more here about TradingView’s Broker of the Year!
Past performance, whether actual or indicated by historical tests of strategies, is no guarantee of future performance or success. There is a possibility that you may sustain a loss equal to or greater than your entire investment regardless of which asset class you trade (equities, options or futures); therefore, you should not invest or risk money that you cannot afford to lose. Online trading is not suitable for all investors. View the document titled Characteristics and Risks of Standardized Options at www.TradeStation.com . Before trading any asset class, customers must read the relevant risk disclosure statements on www.TradeStation.com . System access and trade placement and execution may be delayed or fail due to market volatility and volume, quote delays, system and software errors, Internet traffic, outages and other factors.
Securities and futures trading is offered to self-directed customers by TradeStation Securities, Inc., a broker-dealer registered with the Securities and Exchange Commission and a futures commission merchant licensed with the Commodity Futures Trading Commission). TradeStation Securities is a member of the Financial Industry Regulatory Authority, the National Futures Association, and a number of exchanges.
TradeStation Securities, Inc. and TradeStation Technologies, Inc. are each wholly owned subsidiaries of TradeStation Group, Inc., both operating, and providing products and services, under the TradeStation brand and trademark. When applying for, or purchasing, accounts, subscriptions, products and services, it is important that you know which company you will be dealing with. Visit www.TradeStation.com for further important information explaining what this means. **My View on NIFTY 50 — Daily Chart****1. Key Observation**
NIFTY is forming a lower-high structure below the major volume zone around **24,000–24,500**. The current blue-line structure looks similar to the previous corrective pattern, but a full repeat is not confirmed yet.
**2. My View**
Bias remains bearish while NIFTY stays below the recent swing-high zone. However, I would not treat **20,000** as confirmed immediately. First, NIFTY needs to break the **22,000–22,200** support zone with strong selling confirmation.
**3. Invalidation**
The bearish study becomes weak if NIFTY reclaims **24,800–25,000** and sustains above it with volume.
**4. Risk-Reward**
The downside setup offers favorable risk-reward if short entries come near resistance or after confirmed breakdown, with risk defined above the recent swing high.
**5. Target Point / Range**
TG1: **22,000–22,200**
TG2: **20,600–20,000**
Extended support: **18,778**
**6. Why It’s Good for Short**
Lower highs are forming, recovery attempts are struggling near the high-volume resistance zone, and a break below 22K can open the path for a larger correction.
**7. Time Period**
This is a **medium-term bearish view** for the next few months.
Key sequence: **23.4K → 22K → confirmation → 20.6K / 20K**
#NIFTY #NIFTY50 #PriceAction #VolumeProfile #BearishSetup #MarketCorrection #SwingTrading #OptionsTrading #IndianStockMarket
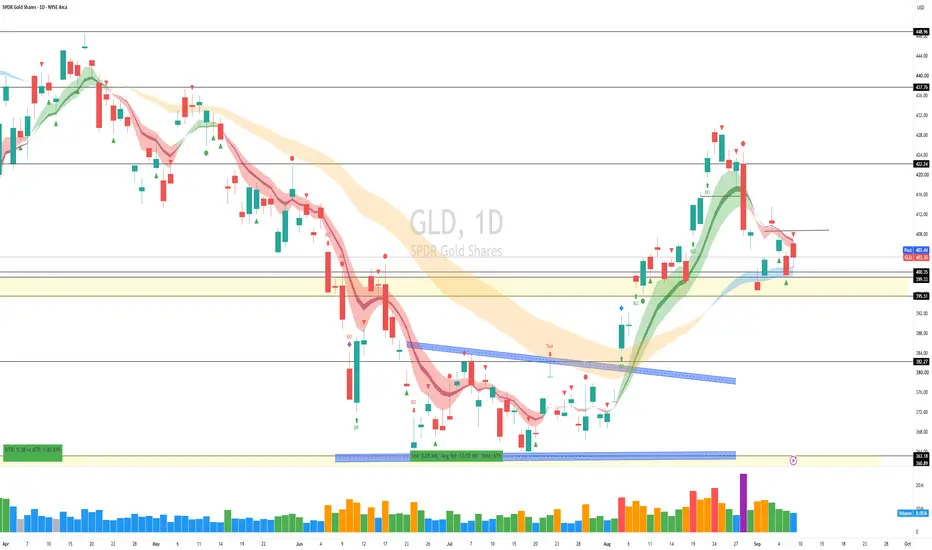
$GLD Daily Close — Sep 9AMEX:GLD Daily Close — Sep 9
The level held. This was the point I made in yesterday's summary, and I added long from there.
Where it held is worth being precise about. Yesterday's close was 399.72 — actually just under the round number. What held was 399.33: the Key Level, and the lower edge of the MTF cloud (@ripster47 EMA cloud) sitting right on top of it. Three reasons stacked in one point. Today the 400 psych number held properly, with a 401.18 low.
One correction on my own wording from yesterday: I called it a big wide-spread candle. Checking the chart, the range was 4.80 against a 7.90 ATR — 61% of a normal day. Below average. I'll flag that because it changes the read: a genuinely wide-spread down bar on low volume is a bullish sign, sellers stepping back. A narrow one closing on its low is much weaker. Yesterday was the second one.
Today the market opened with a gap up — and got rejected right at the 5-12 @ripster47 EMA cloud. High of 406.56, straight into the underside of the cloud, then faded to close 403.35, giving back 60% of the day's range.
That rejection came on 8.04M shares against a 12.02M average — 67% relative volume, below average and below yesterday. Up bar, low volume, close in the lower half, into resistance. That's No Demand. Price went up because nobody was selling, not because anybody was buying.
Zoom out on the volume and it's the real story: 9.82M, then 8.68M, then 8.04M. Three days of it drying up. Sellers aren't pressing 400 and buyers aren't taking 407. Both sides are out. Compression like that resolves with an expansion, and until the volume shows up the direction isn't in the tape.
So on my long — I'm in it, and I'll be straight about what it is. This is an MTF Cloud Bounce (@ripster47 EMA cloud) at a stacked level, and it is unconfirmed. My own rule is a Bounce wants Stopping Volume or a hammer to confirm it, and we got neither. The level is holding on an absence of sellers, not a presence of buyers. That's a real distinction and it's why the trade is sized off a defined stop rather than conviction.
No shorts here. I'm looking for longs as long as 400 holds. The confirmation is a 5-12 Curl (@ripster47 EMA cloud) — a close back above the cloud on volume above 12.02M. That's what opens 415 and then 420, where the options flow is sitting. A curl on 8M shares isn't a curl, it's drift.
Trigger: reclaim of the 5-12 cloud. Invalidation: 399.33. Below 395.51 and the whole bias flips. $SPY Daily Close — Sep 9, 2026AMEX:SPY Daily Close — Sep 9, 2026
AMEX:SPY held the previous breakout area on low volume. Price dipped to 760.94, right on the 760.57 shelf, and closed back up at 762.40 — 1.46 off the low.
I want to be precise about what that is, because it matters for how you trade it. This closed red, with a lower high, a lower low, and a lower close than yesterday. So it's a hold of support, not a bounce yet. The bounce is still the thing we're waiting for.
The volume tells the real story. 32.08M against a 36.6M average — 88% relative volume, lower than yesterday. Range was 3.53 against a 6.06 ATR, only 58% of a normal day and the narrowest bar of this entire sequence.
Narrow spread down bar on falling volume into support. That's No Supply. Sellers are not committing here.
Look at the last four sessions: three of them red, and not one brought volume. Ranges compressing, volume declining, price drifting lower. This isn't distribution. It's drift. Nobody is selling with size and nobody is buying with size either.
It's shaping up as a test, but I won't call it confirmed until we get an up bar closing strong. Today's close came in at 41% of the range — just below mid. A proper test closes in the upper third.
What I'm watching: I'll consider longs over 764.50, which is today's high. But understand that's the aggressive add — the 5-12 Curl (@ripster47 EMA cloud) around 766–767 is the confirm long signal. Two different levels, two different levels of conviction.
On either one, I want volume above 36.6M. Six sessions and only one has come in above average. A move over 764.50 on another 32M day is No Demand, and this is exactly the environment where that trap lives.
No short as long as the market holds the 760–757 area. That floor has now been probed twice in two sessions on light volume and hasn't broken. If it goes, I need the range expanding and volume above average — then 756.70 and 750 come into play.
Until then, flat and waiting.  Long
Long
AT&T May Have PeakedAT&T rallied sharply in July and August, but some traders may think the telecom giant has peaked.
The first pattern on today’s chart is the April 17 weekly close of $26.51. It marked the top of a range in the spring and prices stalled in the same area last week.
Second, the 50-day simple moving average (SMA) had a “death cross” under the 200-day SMA in May. The 100-day SMA fell under the 200-day SMA in July. The resulting configuration, with faster SMAs under slower ones, may be consistent with a long-term downtrend.
Next, stochastics are dropping from an overbought condition.
Finally, MACD has turned negative.
TradeStation has, for decades, advanced the trading industry, providing access to stocks, options and futures. If you're born to trade, we could be for you. Learn more here about TradingView’s Broker of the Year!
Past performance, whether actual or indicated by historical tests of strategies, is no guarantee of future performance or success. There is a possibility that you may sustain a loss equal to or greater than your entire investment regardless of which asset class you trade (equities, options or futures); therefore, you should not invest or risk money that you cannot afford to lose. Online trading is not suitable for all investors. View the document titled Characteristics and Risks of Standardized Options at www.TradeStation.com . Before trading any asset class, customers must read the relevant risk disclosure statements on www.TradeStation.com . System access and trade placement and execution may be delayed or fail due to market volatility and volume, quote delays, system and software errors, Internet traffic, outages and other factors.
Securities and futures trading is offered to self-directed customers by TradeStation Securities, Inc., a broker-dealer registered with the Securities and Exchange Commission and a futures commission merchant licensed with the Commodity Futures Trading Commission). TradeStation Securities is a member of the Financial Industry Regulatory Authority, the National Futures Association, and a number of exchanges.
TradeStation Securities, Inc. and TradeStation Technologies, Inc. are each wholly owned subsidiaries of TradeStation Group, Inc., both operating, and providing products and services, under the TradeStation brand and trademark. When applying for, or purchasing, accounts, subscriptions, products and services, it is important that you know which company you will be dealing with. Visit www.TradeStation.com for further important information explaining what this means.  Long
Long
PayPal: What Goes Up, Must Come Down?PayPal leaped on takeover hopes two months ago, but it may have reversed.
The first pattern on today’s chart is the bullish gap on July 15 after Reuters and CNBC reported a potential purchase. It was followed by a drop on August 28 after Bloomberg reported that the attempted deal was abandoned.
Second, the 100-day simple moving average (SMA) has remained below the 200-day SMA. That may indicate PYPL’s longer-term trend is bearish. It could also suggest the recent surge was a countertrend move.
Third, the payments stock peaked under $57 last Thursday. That level is near the July 28 low and a 50 percent retracement of its August 28 drop. Both points may confirm resistance is in place.
Next, the 8-day exponential moving average (EMA) crossed below the 21-day EMA. MACD is also falling. Those signals may reflect a bearish short-term trend.
Finally, PYPL has turned negative again on a year-to-date basis. Could that weigh on sentiment as the final months of 2026 come into view?
TradeStation has, for decades, advanced the trading industry, providing access to stocks, options and futures. If you're born to trade, we could be for you. Learn more here about TradingView’s Broker of the Year!
Past performance, whether actual or indicated by historical tests of strategies, is no guarantee of future performance or success. There is a possibility that you may sustain a loss equal to or greater than your entire investment regardless of which asset class you trade (equities, options or futures); therefore, you should not invest or risk money that you cannot afford to lose. Online trading is not suitable for all investors. View the document titled Characteristics and Risks of Standardized Options at www.TradeStation.com . Before trading any asset class, customers must read the relevant risk disclosure statements on www.TradeStation.com . System access and trade placement and execution may be delayed or fail due to market volatility and volume, quote delays, system and software errors, Internet traffic, outages and other factors.
Securities and futures trading is offered to self-directed customers by TradeStation Securities, Inc., a broker-dealer registered with the Securities and Exchange Commission and a futures commission merchant licensed with the Commodity Futures Trading Commission). TradeStation Securities is a member of the Financial Industry Regulatory Authority, the National Futures Association, and a number of exchanges.
TradeStation Securities, Inc. and TradeStation Technologies, Inc. are each wholly owned subsidiaries of TradeStation Group, Inc., both operating, and providing products and services, under the TradeStation brand and trademark. When applying for, or purchasing, accounts, subscriptions, products and services, it is important that you know which company you will be dealing with. Visit www.TradeStation.com for further important information explaining what this means. My view on Intel Stock: Going against the crowd (#INTC)NASDAQ:INTC
While most market participants react blindly to the initial impulse, believing in an immediate and sharp reversal to the upside, I prefer to look deeper into market mechanics. My view contrasts sharply with the crowd: I believe it is way too early to celebrate this local bounce in Intel shares, and the technical structure clearly points to another wave of downside.
On the daily timeframe, a well-defined descending channel is unfolding. From above, price is facing heavy pressure from a dynamic resistance block consisting of the 50-day and 100-day moving averages, which have recently formed a bearish cross. This factor serves as a major psychological barrier for buyers. Any attempts to rally from current levels will be heavily capped by profit-taking within the channel, as retail demand simply lacks the strength to break this block without institutional backing.
The path of least resistance for the price right now is downward. The primary target for this move is the $70–$74 range, where a key technical confluence zone is forming. This is exactly where the long-term 200-day moving average has caught up. However, the core of my thesis lies much deeper than simple lines on a chart.
Just below, in the $65 area , lies a massive April imbalance accompanied by colossal horizontal volume profiles. To me, it is obvious that the primary position of smart money is accumulated right there. Large institutional players think in terms of liquidity: they will not add to their positions at current prices alongside the retail crowd. The price will move down not for the sake of "filling the gap," but because a large buyer will intentionally push the market into the $70 zone to trigger a massive sweep of early long stops.
Only after this harsh shakeout—when the crowd finally capitulates and panics into selling at the absolute bottom—will smart money absorb these sell orders into their limit bins. As soon as this high-volume accumulation process is complete, the true institutional reversal will begin. It is exactly within this $70–$74 range that I will be looking for signs of selling exhaustion to enter the market at the most favorable price, targeting long-term goals at $143 and $220. Trading off institutional liquidity rather than retail emotion is the only safe way to approach this chart.
This publication is for analytical purposes only and does not constitute individual investment advice. Share your thoughts in the comments and don't forget to support the idea with a like if you found the analysis useful! $78K Hold or $76K Next?Hey everyone! ☀️💰
In my last publication, I highlighted the beginning of the bullish scenario that we had been discussing repeatedly:
“An impulsive break above the $78K level, followed by a breakout above $80K, would almost certainly send the price toward a breakout above the local high at $81.5K and potentially toward the $82.5K level.”
✅The $81.5K target was reached fairly quickly.
✅We came just short of the $82.5K target, with price forming a local high at $82.3K.
What’s happening on the chart right now?
After failing to break and hold above the $82.5K level, price quickly returned to the $76–80K trading range, first breaking back below its upper boundary at $80K and, just a few hours ago, testing the mid-range at $78K.
There has been a clear reaction from this level. The attempt to break below it was aggressively bought up by the bulls. The level is also further reinforced by the 4H 100 EMA, adding additional technical significance.
For now, the $78K mid-range level is the key area to watch.
🦬🚀As long as price holds above $78K, there is a high probability of a quick move back toward the upper boundary of the range at $80K, followed by another attempt at the previously mentioned $82.5K target.
🐻🪓If $78K fails to hold and price establishes below it, the bearish scenario is in play:
“Failure to hold $78K would weaken the bulls’ position and could quickly send price toward the lower boundary of the range at $76K.”
The reaction around $78K level could determine the next short-term direction of the market 📈📉
⚠️ Disclaimer:
All information shared on this channel is for educational and informational purposes only and is not investment advice. The author is not responsible for your trading decisions. Always manage your risk and make decisions independently. $QQQ Daily Close — Sep 8Fundamental & geopolitical
No major data reported today, but yields are rising and there's plenty of news flow on the Iran-USA escalation. Rising yields are a headwind for tech specifically, since it's the most rate-sensitive part of the market. Price holding its level against that backdrop is worth something.
Technical side
Perfect daily 5-12 bounce. Price traded down to 715.57, tagged the @ripster47 5-12 EMA cloud, and closed back above it at 718.37. In the bigger picture the market is bouncing off the @ripster47 5-12 EMA cloud, and on the smaller timeframes I added long on the curls.
Volume
Volume was low — 22.88M against a 30.79M average, 74% relative volume. No real interest from the big players today.
But that's the good version of low volume, and it's worth understanding why. On Friday I said I was waiting for a low-volume pullback. This is it. Price came down into support, sellers had a clean shot at the cloud, and they couldn't put any volume behind the push. It closed back above the level.
That's a test. Sellers went quiet at the exact spot they needed to show up. Different from a quiet up bar — that one's No Demand and it's a warning. A quiet down bar that holds support and closes back up is the opposite signal.
One caveat I'll keep honest: a test carries more weight when it follows a heavy-volume down bar. This whole range has been quiet. So it's a valid test, not a maximum-conviction one.
What I'm doing
Watching the previous day low at 715.57 closely. I'll add long as long as PDL holds along with the @ripster47 5-12 EMA cloud. Those two are stacked in the same place — 715.57 sits right inside the 715.29–715.98 cloud. One level doing two jobs, which makes it more meaningful than either on its own.
Targets unchanged: 724.20, then 730, then the all-time high at 748.65.
What I want to see: a green bar tomorrow above 721.89 with volume back above 30M. Volume has been the missing piece on every up bar since the curl.
What I don't want: another up bar on volume lighter than today's. That's no demand, and we've had two of those already in this move.
Below 715.29 on rising volume and this becomes a 5-12 Break — that's my exit, not a decision I make in the moment.
One honest note on my own trading: I traded too much today. Long in premarket, short off an @ripster47 MTF cloud fail, then long again — on a day that closed six-tenths of a point from the open. The daily curl I've held since Sep 3 is what's actually working. The intraday flips are the leak. Worth saying out loud. Long 
Japanese Yen Rips as BOJ Hike Bets BuildUSD/JPY traded lower as U.S. trading resumed on Tuesday as the Japanese Yen extended its sharp rally, briefly strengthening to its best level since February before giving back part of the move later in the session. The catalyst? Domestic Japanese data: real wages rose 2.4% year-over-year in July, the strongest gain since 2021; and second-quarter GDP was revised up to a 1.4% annualized pace. That gave markets more confidence that the Bank of Japan has enough cover to raise rates again at the September 17-18 meeting, with traders pricing in 97% chance of a 25-basis-point hike to 1.25%, per Japan overnight index swaps.
The U.S. side is keeping the move from becoming a straight-line collapse in USD/JPY. Friday’s stronger payrolls report kept September Fed hike odds alive near 60%, and this week’s U.S. inflation data can still reset the U.S. Dollar quickly. Intervention risk remains in the background after the summer’s Yen-buying operations, but today’s move looked more like carry-trade stress and BOJ repricing than fresh official action. Rate checks and MOF warnings can still hit the tape if price action gets disorderly, but the Japanese Yen finally has a cleaner fundamental driver, at least through the end of next week: wages, growth, and a BOJ that may be ready to move again.
USD/JPY has broken trend support, losing the rising trendline that carried the entire advance from the April 2025 low. The pair has since sliced through the moving-average cluster and is now sitting below the 155.00 shelf that had been the key support zone since the summer intervention scare. The chart’s structure has evolved, from controlled uptrend to downside momentum with failed rebounds likely to get sold.
A clean bearish setup could be selling failed rebounds into 155.00-156.50. That zone is now the first major test. Momentum confirms the damage. MACD has rolled over below the zero line with red histogram expanding, and stochastics are buried near oversold. The pair is stretched short term, so a snapback is possible, but the broader message is clear: the Japanese Yen has taken control and the U.S. Dollar has lost the rate-driven trend support. If USD/JPY cannot reclaim it quickly, sellers could stay in control and the next downside levels are 152.00, then 150.00-150.50. A move into that area would mark a full reset of the summer breakout.  Long
Long
Micron Has Been SqueezingMicron Technology has consolidated for two months, and some traders may see potential for the longer-term uptrend to continue.
The first pattern on today’s chart is the narrowing range that began in late July. Bollinger Bandwidth has shrunk to the tightest level since late March. That compression may create potential for movement to resume.
Second, the memory-chip giant ended last week at its highest weekly close since late June. Prices also pushed above the 50-day simple moving average. Both signals may reflect intermediate-term bullishness.
Next, the 8-day exponential moving average (EMA) crossed above the 21-day EMA. MACD is also rising. Those signals may reflect short-term bullishness.
Finally, MU is a highly active underlier in the options market. (Its average daily volume of 921,000 contracts ranks fourth in the S&P 500, according to TradeStation data.) That could help traders take positions with calls and puts.
TradeStation has, for decades, advanced the trading industry, providing access to stocks, options and futures. If you're born to trade, we could be for you. Learn more here about TradingView’s Broker of the Year!
Past performance, whether actual or indicated by historical tests of strategies, is no guarantee of future performance or success. There is a possibility that you may sustain a loss equal to or greater than your entire investment regardless of which asset class you trade (equities, options or futures); therefore, you should not invest or risk money that you cannot afford to lose. Online trading is not suitable for all investors. View the document titled Characteristics and Risks of Standardized Options at www.TradeStation.com . Before trading any asset class, customers must read the relevant risk disclosure statements on www.TradeStation.com . System access and trade placement and execution may be delayed or fail due to market volatility and volume, quote delays, system and software errors, Internet traffic, outages and other factors.
Securities and futures trading is offered to self-directed customers by TradeStation Securities, Inc., a broker-dealer registered with the Securities and Exchange Commission and a futures commission merchant licensed with the Commodity Futures Trading Commission). TradeStation Securities is a member of the Financial Industry Regulatory Authority, the National Futures Association, and a number of exchanges.
Options trading is not suitable for all investors. Your TradeStation Securities’ account application to trade options will be considered and approved or disapproved based on all relevant factors, including your trading experience. See www.TradeStation.com . Visit www.TradeStation.com for full details on the costs and fees associated with options.
Margin trading involves risks, and it is important that you fully understand those risks before trading on margin. The Margin Disclosure Statement outlines many of those risks, including that you can lose more funds than you deposit in your margin account; your brokerage firm can force the sale of securities in your account; your brokerage firm can sell your securities without contacting you; and you are not entitled to an extension of time on a margin call. Review the Margin Disclosure Statement at www.TradeStation.com .
TradeStation Securities, Inc. and TradeStation Technologies, Inc. are each wholly owned subsidiaries of TradeStation Group, Inc., both operating, and providing products and services, under the TradeStation brand and trademark. When applying for, or purchasing, accounts, subscriptions, products and services, it is important that you know which company you will be dealing with. Visit www.TradeStation.com for further important information explaining what this means. $BTC Bottom Is In w/ One Final Leg DownAs with ₿itcoin’s last cycle top, lots of indicators from previous cycles were not met, and I see the same playing out with this cycle’s bottom.
At the very least, a lot of us have been waiting for the REALIZED PRICE ~$54K to be tested... but from what I’m seeing, I don’t think PA will go there.
Currently PA is being squeezed between the 50SMA, STH 90EMA and 50EMA.
I do think the local top is in, and CRYPTOCAP:BTC will start to correct going into October. A Weekly Close below ~$76,3 would confirm this.
This flipped fractal I shared from March - April suggests an inverse head and shoulders pattern going into October 5th. That aligns with the 12-month bear market bottom thesis, and would give us a couple more tests at the 200SMA.
If you’ve been following me for the past few years, you might be familiar with my ₿ITCOIN CYCLE ANALYSIS, where I predicted the cycle top to the day (Oct. 6, 2025) ~1.5 years before it occurred.
In that same analysis, I predicted the following bear market bottom to be Nov. 3, 2026. This date lines up near perfectly with this IHS fractal, showcasing a double bottom inside of the IHS.
BTC is already up ~42% off the cycle lows, and a ~21% correction to confirm the bottom with an IHS seems very probable at this point.
Could it wick lower? Sure, anything is possible, but I believe it more likely than not that upcoming sell-offs will be bid up very aggressively considering how late we are in the cycle.
We have still yet to see an overpowering surge in VOLUME to suggest a change in trend, so I’ll very much be watching for this.
If you’re looking for a narrative to drive this final leg down, there’s many to choose from…
the war in Iran, supply chain shocks, uncertainty around midterms, sticky inflation, rate hike fears, and an inevitable >10% stock market correction. Take your pick.
Trade safe my frens 🙌  Short
Short
 Long
Long