Short
Short
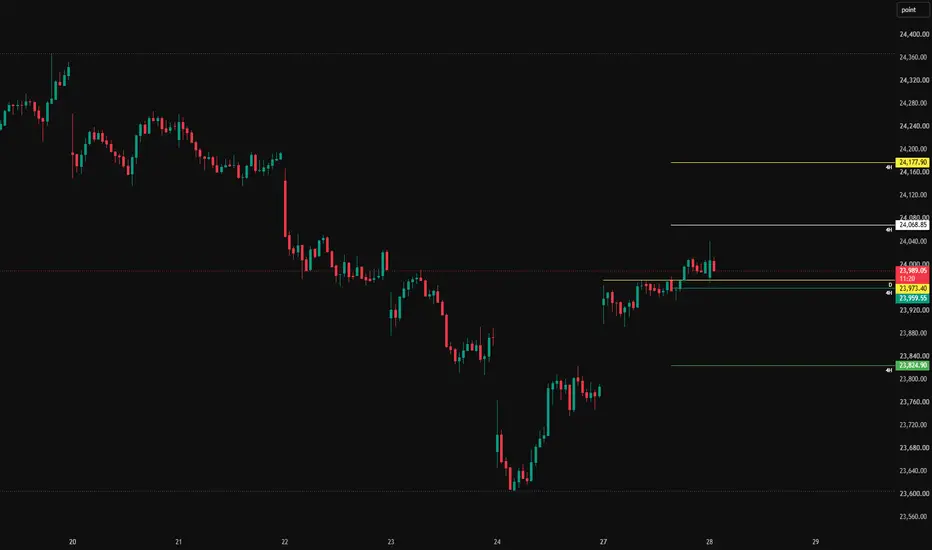
NIFTY50 Market Analysis BreakdownNIFTY50 is currently trading around 24,003, holding above a key support confluence after a strong recovery from the recent bottom. The market has reclaimed the 24,000 psychological level, and price is now testing an immediate resistance zone.
Key Levels
Resistance Levels
24,003.65 – Immediate resistance/current reaction zone
24,068.85 – Major 4H resistance
24,177.90 – Higher 4H resistance and next bullish target
Support Levels
23,973.40 – Daily support
23,959.55 – 4H support
23,824.90 – Major 4H support
Market Structure
The short-term structure remains bullish as price continues to form higher lows after the sharp recovery from the marked 15M–1H bottom. Buyers have successfully defended the 23,973–23,959 support zone, allowing the index to reclaim the 24,000 level.
However, NIFTY50 is now trading directly beneath an important resistance area around 24,003, making this a crucial level for determining the next directional move.
Bullish Scenario 🟢
A sustained move and close above 24,003.65 would strengthen bullish momentum.
The next upside objective would be 24,068.85.
If buyers successfully break and hold above 24,068.85, the rally could extend toward 24,177.90, which is the next major 4H resistance.
Bearish Scenario 🔴
Failure to sustain above 24,003 could result in a pullback toward the 23,973–23,959 support zone.
As long as this support cluster holds, the broader bullish structure remains intact.
A decisive breakdown below 23,959.55 would increase the probability of a deeper correction toward 23,824.90.
Overall Outlook
NIFTY50 is trading at a pivotal resistance while maintaining a positive short-term structure. The 23,973–23,959 zone remains the key support for buyers, whereas 24,003 is the immediate hurdle. A breakout above this resistance would likely shift momentum toward 24,068 and 24,178, while rejection could lead to a healthy retest of support before the next directional move. BTC Market Analysis BreakdownBTC has experienced a sharp rejection from the 66.3K–66.9K resistance zone, confirming selling pressure from higher levels. Price is now trading around 63,285, approaching a critical support region that could determine the next directional move.
Key Levels
Resistance
63,666 – Immediate resistance (D-61.8)
66,390 – 4H Major Resistance
66,924 – Higher Timeframe Major Resistance
Support
62,503 – Immediate Support (D-50)
62,180 – Major 4H Support
61,384 – Strong Support (D-38.2)
Market Structure
BTC remains within a broader rising channel, but the recent rejection from the upper resistance cluster has shifted short-term momentum in favor of the bears. The breakdown below 63,666 indicates that buyers have temporarily lost control, making the current support zone extremely important.
The purple ascending trendlines continue to define the larger structure, suggesting that the overall trend remains constructive as long as price respects the lower trendline.
Bearish Scenario 🔴
If BTC remains below 63,666, bearish pressure could continue toward:
62,503 (D-50 Support)
62,180 (Major 4H Support)
Failure to hold 62,180 would expose 61,384, where the rising trendline and Fibonacci support converge. This area represents the strongest demand zone on the chart.
Bullish Scenario 🟢
For buyers to regain momentum, BTC must first reclaim and hold above 63,666.
A successful recovery above this level could lead to:
66,390 (4H Resistance)
66,924 (Major Higher-Timeframe Resistance)
A breakout above 66,924 would invalidate the current short-term bearish structure and signal renewed bullish strength.
Overall Outlook
BTC is currently testing an important decision zone after losing immediate support. While the broader trend remains supported by the ascending channel, short-term momentum has turned bearish following rejection from the 66K resistance region. The 62,503–62,180 support cluster is the key area to watch. Holding this zone could trigger another recovery attempt toward 63,666 and eventually 66,390, whereas a breakdown below 62,180 would increase the probability of a move toward 61,384, where the next major buying interest is expected. GOLD (XAU/USD) Market Analysis BreakdownGold is currently trading around 4,049, testing an important support zone after failing to sustain its recent rally. The market is positioned between immediate support at 4,038.64 and resistance at 4,062.69, making this a key decision area for the next move.
Key Levels
Resistance
4,062.69 – Immediate 4H Resistance
4,087.31 – Major 4H Resistance
4,140.00 – Higher Resistance
4,165.00 – Major Swing Resistance
Support
4,038.64 – Immediate 4H Support
4,008.43 – Major 4H Support
3,960.00 – Strong Long-Term Support Zone
Market Structure
Gold has pulled back after rejecting from the 4,140–4,165 resistance region, indicating that sellers are defending higher prices. Despite the recent decline, price is still trading above the immediate support at 4,038.64, making this the first level buyers need to protect.
The current structure suggests consolidation within a broader range, with price awaiting confirmation from either a support bounce or a breakdown below key levels.
Bullish Scenario 🟢
If buyers successfully defend 4,038.64 and reclaim 4,062.69, bullish momentum could strengthen toward:
4,087.31 (Major 4H Resistance)
4,140.00 (Higher Resistance)
4,165.00 (Major Swing Resistance)
A sustained break above 4,087.31 would improve the short-term outlook and increase the probability of another test of the recent highs.
Bearish Scenario 🔴
If Gold fails to hold 4,038.64, selling pressure may increase toward:
4,008.43 (Major 4H Support)
A decisive break below 4,008.43 could expose the stronger support zone near 3,960.00, where buyers may look to re-enter the market.
Overall Outlook
Gold is trading at a critical support zone after rejecting from higher resistance. The 4,038.64 level is the immediate line separating bullish recovery from further downside. Holding above this support could lead to a rebound toward 4,062.69 and 4,087.31, while a breakdown below 4,038.64 would shift focus to 4,008.43 and potentially 3,960.00. The reaction around the current support will likely determine the next significant move in the market.  Long
Long
TIP: Why high inflation won’t save this ETF - July 2026SYMBOL: AMEX:TIP | Direction: Short | Timeframe: 3-Week
Published: July 2026
TIPS are supposed to protect you from inflation. The clue is in the name. Treasury Inflation Protected Securities. So why is this chart signalling a correction?
Because the popular understanding of how TIPS work is incomplete. The inflation adjustment is
real. It is simply not the only thing driving the price of a bond ETF. Duration risk is. Real yields
are. And both of those are moving in the wrong direction for TIP holders right now.
TIP has rallied from the 2022 lows in a well-defined ascending channel. That channel is now
exhausted at its upper boundary. Bearish momentum signals are printing. The 3-week chart is
asking a question that the inflation narrative cannot answer.
On the above 3-week chart TIP has reached the upper boundary of its multi-year
ascending channel with bearish momentum signals printing across multiple oscillators.
Three reasons now exist to expect a corrective move lower. They include:
1) Upper channel exhaustion with a bear pending signal . TIP has been climbing within
a clear ascending channel since the 2022 lows. Price is now pressing the upper
boundary of that channel at ~$107. A Bear Pending signal has printed at this level.
Historically, this break of support has marked every significant reversal in this ETF, including the
2021 top and the 2019 peak. It does not print often, but when it does at an upper channel
resistance, Look left.
2) Bearish divergence across the majority of momentum oscillators. More than half of
the oscillators and momentum gauges on the 3-week chart print bearish divergence at
current levels. Price has made a higher high within the channel. Momentum has not
confirmed it. That divergence is the market’s internal structure signalling that buyers are
losing the argument, even as the price tag says otherwise. RSI is simultaneously testing
the upper boundary of its own ascending channel, a level at which it has repeatedly
turned lower. Mean reversion from here is the higher probability path.
3) Duration risk is running faster than the inflation credit. TIP holds intermediate-term
U.S. Treasury Inflation-Protected Securities with an average duration of approximately 6
years. The mathematics of this matters. A 1% rise in nominal Treasury yields inflicts
roughly a 5–6% price drag on a bond of this duration. The CPI adjustment to principal is
real and it helps, but it does not move fast enough to offset aggressive yield moves.
When the Fed holds rates high, when Treasury supply is heavy, and when real interest
rates rise, the base bond price falls faster than inflation adds to it. The price of TIP
drops. The ETF structure cannot change the maths.
Targets (corrective)
• 1st target: ~$101. Mid-channel mean reversion. Prior consolidation zone.
• 2nd target: ~$93. Lower channel boundary. A deeper correction to this level would
represent a full round-trip to the post-2022 recovery base.
A 3-week close above the upper channel boundary, sustained, would invalidate this setup. That
level is approximately $109–$110. If TIP breaks and holds above there, the corrective thesis is
wrong.
The crowd
The crowd holds TIPS as the inflation hedge. That logic is not wrong. It is incomplete. Retail
investors who own TIP have been told, correctly, that the principal adjusts with CPI. What they
have not always been told is that the ETF price is also a function of its underlying bond prices,
which move inversely with yields and are sensitive to duration. When the two forces work
against each other, the net result depends on the maths, not the narrative.
This idea is not a call that inflation disappears. It is a call that the channel is exhausted, the
signals are bearish, and the duration drag is not being fully priced in. Owning the right
instrument for the wrong reason is still the wrong trade. The chart does not care about the
rationale. It cares about price.
The inflation hedge that falls when inflation is high is not a paradox. It is duration. It has always
been duration. The chart is just the most recent reminder.
Ww
Type: Fixed income / ETF technical | Timeframe: 3–9 months
=============================================
Disclaimer : This idea is for educational and informational purposes only. It is not financial advice. It is not a call that inflation is declining or that TIPS will permanently underperform. TIP is a fixed income ETF that tracks U.S. Treasury Inflation-Protected Securities. The price of this ETF is sensitive to changes in nominal interest rates, real yields, and duration, in addition to inflation adjustments. A rise in nominal Treasury yields will negatively affect the price of this
ETF irrespective of the prevailing inflation rate.
Always do your own research and consult a qualified financial adviser before making any investment decisions. Past performance is not indicative of future results.  Short
Short
Long 
Education
 Short
Short
 Long
Long

 Short
Short
The First Grand Impulse or the Beginning of an Extended Fifth WaS&P 500: The First Grand Impulse or the Beginning of an Extended Fifth Wave?
The aggressive Elliott Wave scenario suggests that the S&P 500 continues to develop within the first major impulsive market cycle. Our current wave count places price action in Wave (III) of Wave (V), while the overall structure remains consistent with Elliott Wave rules and guidelines.
This research is supported by several key observations, including alternation between Waves (II) and (IV) across two different degrees, the equality relationship between Waves (I) and (V) at the current stage, valid channeling, and the alignment of Fibonacci relationships in both price and time. In this methodology, time is treated as an equally important validation tool alongside price, providing an additional layer of confidence in the wave count.
If this interpretation remains valid, the current advance may evolve into an Extended Fifth Wave, followed by Wave (IV) and a final Wave (V) of (V), potentially completing the first major impulsive cycle of this long-term structure.
As always, Elliott Wave analysis is based on probabilities, and this scenario will be updated as market structure continues to develop.
— Research by Mr. Nobody
Independent Elliott Wave Principle Researcher
"Patterns whisper. I listen." 🎧📊
S&P 500 Index
May 19
The Fibonacci Sequence and Cycle in the Complete Wave Cycle of t
Long 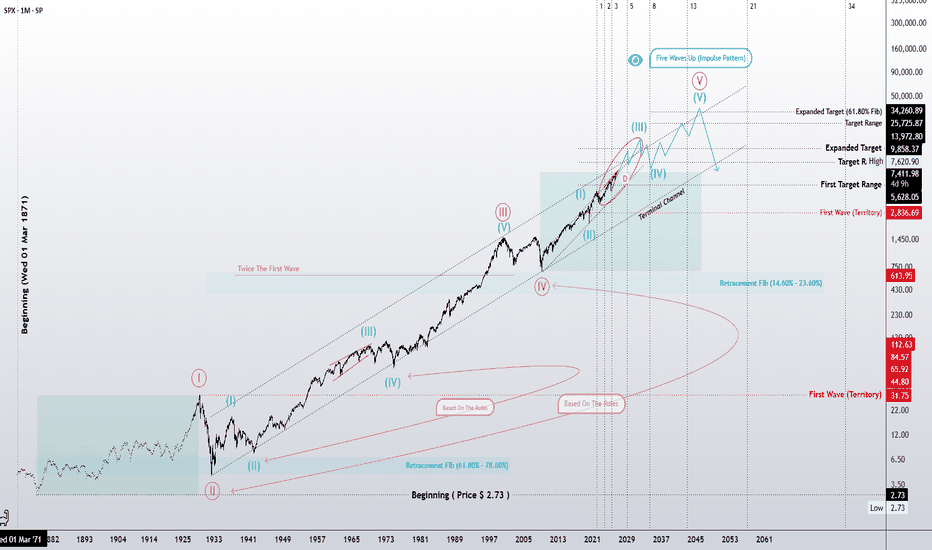
XAU/USD 27 July 2026 Intraday AnalysisH4 Analysis:
-> Swing: Bullish.
-> Internal: Bearish.
Bias and analysis to remain the same as analysis dated 30 June 2026.
Price did not print bullish CHoCH to indicate bullish pullback phase initiation. Price instead printed a new low followed by a bullish CHoCH
Price is currently trading within and established internal range, however, I will continue to monitor price with respect to depth of pullback.
Intraday expectation:
Price to trade up to either premium of internal 50% EQ, or H4 demand zone before targeting weak internal low, currently priced at 3,942.100.
Note:
Gold remains volatile as tensions between the US, Israel, and Iran keep safe‑haven demand elevated.
Markets are reacting quickly to every headline, while uncertainty around the Fed’s easing path and shifting U.S. policy under President Trump, especially tariffs continues to fuel choppy price action.
For newer traders, the key is simple, stay flexible and manage risk carefully, as fast spikes and sudden reversals are a normal part of the current XAU/USD environment.
H4 Chart:
M15 Analysis:
-> Swing: Bearish.
-> Internal: Bearish.
Analysis and bias remains the same as analysis dated 20 July 2026.
Price has printed according to analysis dated 14 July 2026 where I mentioned price to trade up to either premium of internal 50% EQ, or M15 demand zone before targeting weak internal low, priced at 3,983.545. This is how price printed.
Price has subsequently printed a bullish CHoCH to indicate bullish pullback phase initiation. Price has since printed lower. Depth of pullback has been insignificant, therefore, I will not classify the bearish iBOS, however, I have marked this in red for illustration purposes.
Price has since printed a further bullish CHoCH and once again price is trading within an established internal range, however, I shall again monitor price action with regards to depth of pullback.
Intraday expectation:
Price to trade up to either premium of internal 50% EQ, or M15 demand zone before targeting weak internal low, priced at 3,959.800.
Note:
Gold remains highly reactive on M15 as geopolitical risk continues to drive quick, headline‑led moves.
The tension between the US, Israel, and Iran is keeping safe‑haven demand elevated, with markets still sensitive to any sign of escalation.
At the same time, shifting US tariff policy under President Trump is adding extra uncertainty, fuelling sharp intraday swings and increasing the likelihood of sudden sentiment flips. Liquidity pockets and whipsaws remain common, making disciplined risk management essential.
Gold’s geopolitical premium is still firmly in place, and until tensions ease, short‑term volatility is likely to stay front‑loaded.
M15 Chart:

GBPUSD | Fresh Bearish StructureFOREXCOM:GBPUSD has recently transitioned from a bullish market structure into a bearish one, with a clear Change of Character (CHoCH) confirming that sellers have regained control of the higher-timeframe order flow.
Following this structural shift, the market is now in a corrective pullback, retracing into premium pricing before the next potential bearish continuation.
This bearish transition has created three institutional execution zones, each offering a potential opportunity to participate in the continuation move.
The first area of interest is the HTF Flip Zone; the origin of the displacement that shifted market structure from bullish to bearish. A lower-timeframe bearish confirmation here would provide the earliest continuation entry.
Should price trade through the Flip Zone without confirmation, attention shifts to the HTF Supply Zone, where fresh institutional selling interest may be waiting.
If buyers continue to push higher, the final area of interest becomes the Extreme HTF Supply Zone, representing the highest premium area within the current bearish market structure.
Liquidity continues to rest beneath each bearish leg, making those pools the logical downside objectives if sellers successfully defend any of these institutional zones.
The execution plan remains disciplined:
• Sell from the HTF Flip Zone with lower-timeframe confirmation.
• If no confirmation develops, wait for the HTF Supply Zone.
• If price continues higher, allow it to reach the Extreme HTF Supply before reassessing.
The market has already revealed its directional intent through the recent structural shift. Now the focus is simply on allowing price to retrace into value before looking for confirmation.
Structure first. Confirmation second. Execution last. EURUSD | Trading the Structural ShiftFOREXCOM:EURUSD has recently transitioned from a bullish market structure into a bearish one after printing a decisive Change of Character (CHOCH), signalling that buyers have lost control and sellers have begun taking over the order flow.
This structural shift changes the entire market narrative. Rather than looking for buying opportunities, the focus now shifts to identifying the optimal area for sellers to re-enter the market.
Following the bearish CHOCH, the market created a 4H Flip Zone; the origin of the structural shift where previous demand transitioned into supply. This is the first area of interest, as institutions often revisit these zones before continuing in the new trend direction.
If price delivers a valid lower-timeframe bearish confirmation (CHOCH/MSS) from this Flip Zone, it presents the first high-probability continuation opportunity in line with the newly established bearish trend.
However, if the Flip Zone fails to produce confirmation and price trades through it, the bearish bias remains intact. In that case, attention shifts to the major higher-timeframe supply zone positioned above, where a deeper premium retracement may provide the next institutional selling opportunity.
This approach allows the market to dictate execution rather than forcing an entry.
Trading Narrative
• Previous Trend: Bullish
• Structural Shift: Bearish CHOCH confirmed
• Current Bias: Bearish
• First Area of Interest: 4H Flip Zone
• Secondary Area of Interest: Higher-Timeframe Supply
• Execution Plan:
Sell from the Flip Zone only if lower-timeframe confirmation develops.
If no confirmation appears and price trades through the Flip Zone, remain patient and wait for the major HTF Supply before looking for shorts.
The objective is not to predict where price must reverse, but to allow price to reach institutional areas and let market structure confirm the next move.  Short
Short
 Short
Short