XAUUSD – ทองคำยืนเหนือ 4,600 ก่อนการประชุมแจ็กสันโฮลXAUUSD – ทองคำยืนเหนือ 4,600 ก่อนการประชุมแจ็กสันโฮล
ทองคำกำลังเคลื่อนไหวอย่างระมัดระวังใกล้โซนตัดสินใจสำคัญในระยะสั้น
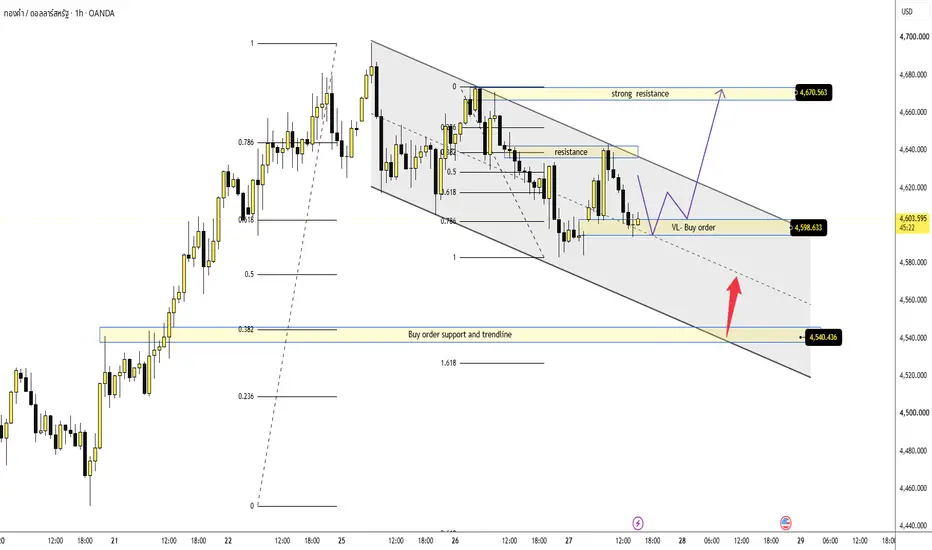
ราคาปัจจุบันอยู่บริเวณ 4,603 และยังคงยืนเหนือโซนคำสั่งซื้อที่มีปริมาณต่ำบริเวณ 4,598 ได้อยู่ ตลาดยังไม่ได้แสดงสัญญาณไปต่อแบบแข็งแรง แต่ฝั่งขายก็ยังไม่สามารถกดราคาหลุดต่ำกว่าจุดต่ำสุดของสัปดาห์ได้อย่างชัดเจน
สิ่งนี้บอกว่าทองคำกำลังรอปัจจัยกระตุ้นสำคัญ ก่อนเลือกทิศทางที่ชัดเจนรอบต่อไป
มุมมองปัจจัยพื้นฐาน
ทองคำกำลังเคลื่อนไหวอย่างระมัดระวัง เพราะนักลงทุนกำลังรอคำกล่าวของประธานธนาคารกลางสหรัฐ Kevin Warsh ที่การประชุม Jackson Hole
เหตุการณ์นี้อาจให้สัญญาณเพิ่มเติมเกี่ยวกับทิศทางนโยบายการเงินในอนาคต ซึ่งจะส่งผลโดยตรงต่อดอลลาร์สหรัฐ อัตราผลตอบแทนพันธบัตร และทิศทางถัดไปของทองคำ
ตอนนี้ฝั่งซื้อยังพยายามป้องกันราคาทองเหนือ 4,600 แต่แรงส่งยังไม่ได้รับการยืนยันเต็มที่ หากดอลลาร์สหรัฐมีการตอบสนองแรงหลังคำกล่าว ความผันผวนของทองคำอาจเพิ่มขึ้นอย่างรวดเร็ว
มุมมองทางเทคนิค – โครงสร้างเงินทุนรายใหญ่ + ฟีโบนักชี
จากมุมมองโครงสร้างเงินทุนรายใหญ่ ทองคำกำลังเคลื่อนไหวอยู่ในโครงสร้างพักตัวขาลงระยะสั้น หลังจากการปรับขึ้นแรงก่อนหน้า
แนวรับแรกที่สำคัญคือโซนคำสั่งซื้อที่มีปริมาณต่ำบริเวณ 4,598 ซึ่งเป็นโซนตัดสินใจหลักในตอนนี้ หากฝั่งซื้อสามารถป้องกันโซนนี้ได้ ราคาทองอาจพยายามฟื้นตัวกลับไปหาแนวต้านระยะสั้นบริเวณ 4,635 – 4,640
เหนือขึ้นไป แนวต้านสำคัญอยู่บริเวณ 4,670 ระดับนี้สำคัญ เพราะสอดคล้องกับโซนอุปทานเดิม จุดตอบสนองฟีโบนักชี และขอบบนของช่องพักตัวระยะสั้น
หากทองคำไม่สามารถยืนเหนือ 4,598 ได้ แนวรับถัดไปอยู่บริเวณ 4,540 ซึ่งเป็นโซนแนวรับคำสั่งซื้อ + เส้นแนวโน้ม และอาจกลายเป็นโซนอุปสงค์สำคัญถัดไป
โซนราคาสำคัญ
ราคาปัจจุบัน: 4,603
โซนคำสั่งซื้อปริมาณต่ำ: 4,598
แนวต้านระยะสั้น: 4,635 – 4,640
แนวต้านแข็งแรง: 4,670
แนวรับคำสั่งซื้อ + เส้นแนวโน้ม: 4,540
การตอบสนองขาขึ้นยังใช้ได้: เหนือ 4,598
การยืนยันขาขึ้น: เหนือ 4,640
การทะลุขาขึ้นที่แข็งแรงกว่า: เหนือ 4,670
ความอ่อนแรงระยะสั้น: ต่ำกว่า 4,598
มุมมองขาขึ้นระยะสั้นเป็นโมฆะ: ต่ำกว่า 4,540
แผนการเทรด
สถานการณ์ซื้อ – มุมมองหลัก
โซนซื้อ: 4,598
เงื่อนไขเข้า: การปฏิเสธขาลงแล้วเด้งกลับ, การกวาดสภาพคล่อง, การเปลี่ยนโครงสร้างในกรอบเวลาย่อย หรือแรงตอบสนองชัดเจนจากโซนคำสั่งซื้อ
จุดตัดขาดทุน: ต่ำกว่า 4,590 หรือต่ำกว่าจุดต่ำสุดใกล้สุด
เป้าหมายกำไร 1: 4,635 – 4,640
เป้าหมายกำไร 2: 4,670
สถานการณ์ซื้อเมื่อย่อลึก
โซนซื้อ: 4,540
เงื่อนไขเข้า: รอการยืนยันขาขึ้นที่ชัดเจนจากโซนแนวรับเส้นแนวโน้ม
จุดตัดขาดทุน: ต่ำกว่า 4,540
เป้าหมายกำไร 1: 4,598
เป้าหมายกำไร 2: 4,640
เป้าหมายกำไร 3: 4,670
สถานการณ์ขาย – การตอบสนองจากแนวต้าน
โซนขาย: 4,635 – 4,670
เงื่อนไขเข้า: การปฏิเสธขาขึ้น, การทะลุไม่สำเร็จ หรือโครงสร้างขาลงในกรอบเวลาย่อย
จุดตัดขาดทุน: เหนือจุดสูงสุดของแท่งปฏิเสธ
เป้าหมายกำไร 1: 4,598
เป้าหมายกำไร 2: 4,540
ขายเมื่อหลุดแนวรับ
เงื่อนไข: ราคาหลุดต่ำกว่า 4,598 อย่างชัดเจน
เป้าหมาย: 4,540
มุมมองของฉัน
ทองคำยังไม่ได้อ่อนแรงชัดเจน แต่ฝั่งซื้อต้องป้องกัน 4,598 ให้ได้
กราฟตอนนี้แสดงการพักตัวก่อนการตัดสินใจใหญ่ หากราคายืนเหนือ 4,598 และทะลุเส้นแนวโน้มพักตัวได้ ทองคำอาจฟื้นตัวกลับไปหา 4,640 และ 4,670
แต่ถ้า 4,598 หลุด ตลาดอาจลงไปกวาดสภาพคล่องลึกขึ้นบริเวณ 4,540 ก่อนที่ฝั่งซื้อจะกลับเข้ามาอีกครั้ง
สำหรับฉัน นี่คือแผนที่ต้องรอการยืนยัน ไม่ใช่จุดที่ควรไล่ราคา
ทองคำกำลังยืนเหนือ 4,600 ก่อนการประชุม Jackson Hole และการตอบสนองถัดไปอาจเป็นตัวตัดสินว่ารอบขาขึ้นจะไปต่อ หรือการพักตัวจะลึกขึ้น
คุณคิดว่าทองคำจะป้องกัน 4,598 และดันขึ้นไปหา 4,670 ได้ไหม หรือฝั่งขายจะกดให้ราคาย่อลึกก่อน?  เพิ่มขึ้น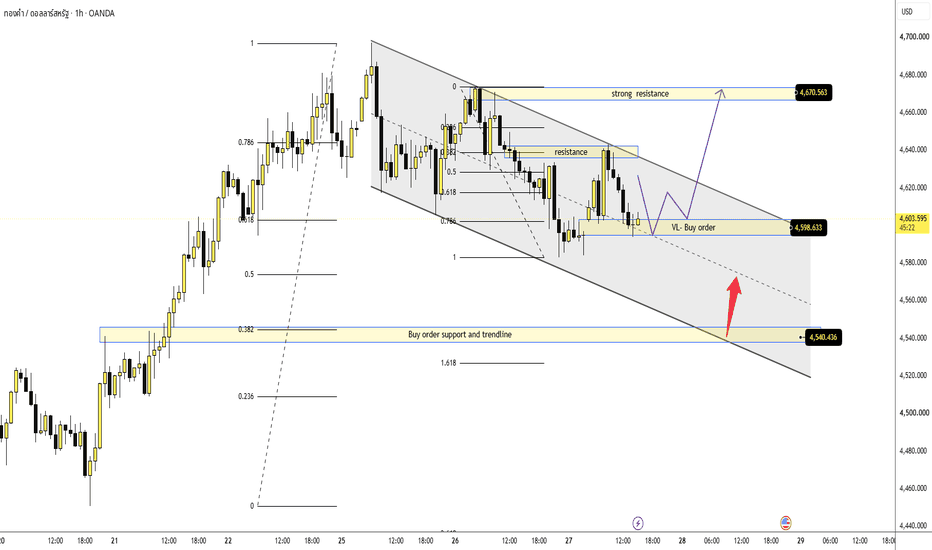
BRIAN XAUUSD – ทองคำยังรักษา POC ได้ แต่ Warsh BRIAN XAUUSD – ทองคำยังรักษา POC ได้ แต่ Warsh อาจเป็นตัวกำหนดการเบรกครั้งต่อไป
ทองคำกำลังพยายามดึงโมเมนตัมขาขึ้นกลับมา แต่ตลาดยังไม่ได้เคลื่อนไหวอย่างอิสระเต็มที่
การฟื้นตัวล่าสุดได้รับแรงหนุนจากกลยุทธ์ซื้อคืนของกระทรวงการคลังสหรัฐ ซึ่งช่วยควบคุมอัตราผลตอบแทนพันธบัตรรัฐบาลสหรัฐให้อยู่ในกรอบ อัตราผลตอบแทนที่ต่ำลงสามารถลดแรงกดดันต่อทองคำได้
อย่างไรก็ตาม อีกด้านหนึ่งของเรื่องนี้ยังคงสำคัญ: ข้อมูลเงินเฟ้อของสหรัฐยังคงสนับสนุนแนวคิดที่ว่า Fed อาจยังคงระมัดระวัง และสิ่งนี้อาจช่วยหนุนดอลลาร์สหรัฐต่อไป
นี่คือเหตุผลที่ทองคำในตอนนี้กำลังตอบสนองอยู่รอบโซนมูลค่า ไม่ใช่การพุ่งขึ้นอย่างรุนแรง
ตอนนี้เทรดเดอร์กำลังรอฟังสุนทรพจน์ของประธาน Fed Kevin Warsh ในวันศุกร์ คำพูดครั้งนี้อาจตัดสินว่าทองคำจะเบรกขึ้นจากโครงสร้างนี้ หรือจำเป็นต้องย่อตัวลึกลงก่อนแล้วค่อยไปต่อ
โครงสร้างทางเทคนิค
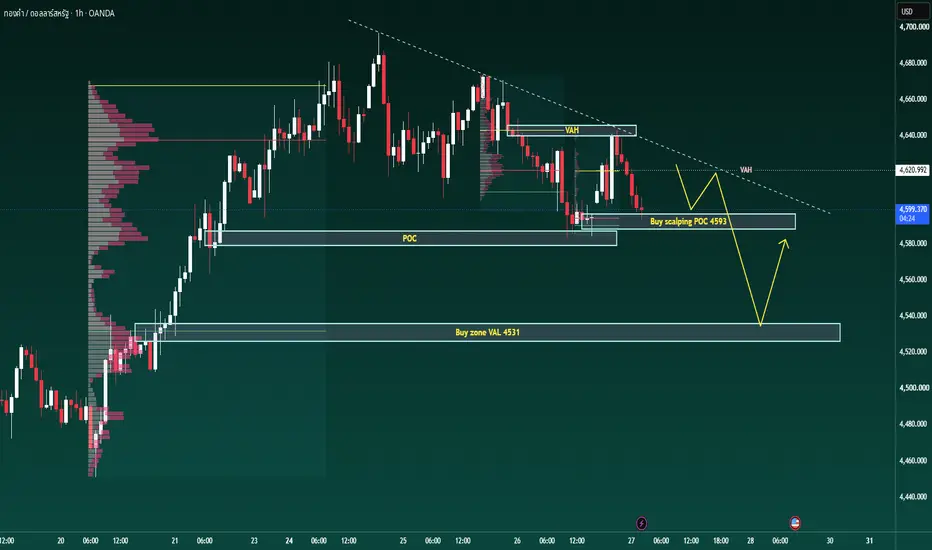
บนกราฟ H1 ทองคำกำลังซื้อขายบริเวณ 4,595 - 4,600 หลังจากเสียโมเมนตัมระยะสั้นจากโซน VAH ด้านบน
โซนสำคัญตอนนี้คือ POC สำหรับแรงซื้อระยะสั้นบริเวณ 4,593 ราคากำลังยืนอยู่ตรงโซนนี้พอดี นี่เป็นพื้นที่ตัดสินใจที่สำคัญมาก เพราะอยู่ใกล้กับโครงสร้าง POC ที่ใหญ่กว่าจากฐานสะสมก่อนหน้า
หากผู้ซื้อป้องกันโซน 4,590 - 4,595 ได้ ทองคำอาจพยายามรีบาวด์กลับไปยังโซน VAH บริเวณ 4,620 - 4,625
การเบรกขึ้นเหนือโซนนี้อย่างชัดเจนจะเปิดทางให้ราคาดันขึ้นไปยังกรอบด้านบนอีกครั้ง
แต่ถ้า 4,593 ล้มเหลว ทองคำอาจหมุนตัวลงไปยังโซนซื้อ VAL บริเวณ 4,531 ซึ่งจะเป็นโซนมูลค่าที่ลึกกว่า และเป็นจุดที่ผู้ซื้ออาจกลับเข้ามาอีกครั้ง
โซนสำคัญ
บริเวณราคาปัจจุบัน: 4,595 - 4,600
ทองคำกำลังยืนใกล้ POC ระยะสั้นหลัก
POC สำหรับแรงซื้อระยะสั้น: 4,593
โซนตัดสินใจของผู้ซื้อทันที
แนวรับ POC: 4,580 - 4,590
แนวรับมูลค่าหลักจากฐานปริมาณก่อนหน้า
แนวต้าน VAH: 4,620 - 4,625
แนวต้านแรกด้านบนและโซนเบรกระยะสั้น
โซนซื้อ VAL: 4,531
แนวรับมูลค่าที่ลึกกว่า หากทองคำปรับฐานแรงขึ้น
แผนการเทรด
รอแรงซื้อจาก POC ระยะสั้นบริเวณ 4,593
จุดเข้า:
มองหาโอกาสซื้อเฉพาะเมื่อราคายืนบริเวณ 4,590 - 4,595 และแสดงการปฏิเสธขาลงอย่างชัดเจน
จุดตัดขาดทุน:
ต่ำกว่าแนวรับ POC หรือใต้จุดกวาดสภาพคล่องด้านล่างระยะสั้น
จุดทำกำไร:
เป้าหมาย 1: 4,620 - 4,625
เป้าหมาย 2: 4,650
เป้าหมาย 3: ถือไล่ตามต่อเฉพาะเมื่อทองคำเบรกและยอมรับราคาเหนือโซน VAH
แผนนี้ตามโครงสร้างมูลค่าขาขึ้นในปัจจุบัน แต่ยังต้องรอการยืนยัน เพราะราคายังอยู่ใต้แนวต้านระยะสั้น
แผนสำรอง
หากทองคำหลุด 4,590 และไม่สามารถกลับมายืนเหนือได้ ผมจะไม่ฝืนซื้อ
ในกรณีนั้น ราคาอาจต้องหมุนลงไปยังโซนซื้อ VAL บริเวณ 4,531 ก่อนที่จะเกิดแรงซื้อที่แข็งแรงขึ้นอีกครั้ง
มุมมองสุดท้าย
ทองคำยังคงยืนอยู่เหนือโครงสร้างมูลค่าขาขึ้นที่ใหญ่กว่า แต่โมเมนตัมระยะสั้นกำลังชะลอตัว
ตอนนี้ตลาดกำลังรอการยืนยันบริเวณ 4,593 หากผู้ซื้อป้องกัน POC นี้ได้ ทองคำสามารถรีบาวด์ไปยัง 4,625 และอาจขยายตัวขึ้นต่อได้
หากระดับนี้หลุด โซนซื้อที่สะอาดกว่าอาจอยู่บริเวณ 4,531
ตอนนี้ผมมองทองคำเป็นขาขึ้นเมื่ออยู่เหนือโซนมูลค่า แต่ยังไม่สะอาดพอให้ไล่ราคา
ประเด็นสำคัญง่ายมาก:
ยืนเหนือ 4,593 = ผู้ซื้อยังคง active
หลุด 4,593 = รอโซนมูลค่าที่ลึกกว่า
เบรก 4,625 = โมเมนตัมขาขึ้นกลับมา
ก่อนที่ Warsh จะพูด ทองคำจะป้องกัน POC ได้ หรือว่าตลาดจะกวาดสภาพคล่องลงล่างก่อน? ลดลง 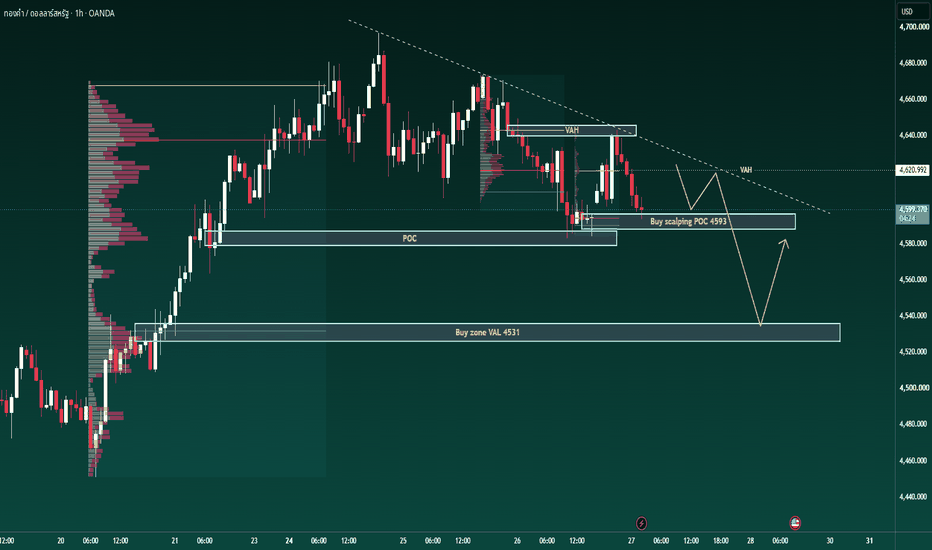
XAUUSD 1H — เปลี่ยนเป็นขาลง และมีโอกาสลงต่อกราฟ 1H แสดงให้เห็นถึง การเปลี่ยนแปลงของโครงสร้างตลาดอย่างชัดเจน ก่อนหน้านี้ทองคำยังคงอยู่ในโครงสร้างขาขึ้นที่แข็งแกร่ง พร้อมการเกิด BOS หลายครั้ง แต่หลังจากราคาถูกปฏิเสธจาก FVG บริเวณ 4,670–4,680 ราคาได้สร้าง CHoCH บริเวณ 4,600 ซึ่งบ่งชี้ว่าโมเมนตัมขาขึ้นกำลังอ่อนตัวลง และผู้ขายเริ่มเข้าควบคุมตลาด
📊 การวิเคราะห์ทางเทคนิค
ราคาปัจจุบัน: ~4,602
แนวต้าน / โซนอุปทานหลัก: 4,650–4,680
ระดับโครงสร้างสำคัญ: 4,600
แนวรับ / FVG ระยะใกล้: 4,550–4,560
FVG ด้านล่างหลัก: 4,485–4,515
ขณะนี้ราคาอยู่บริเวณ ระดับโครงสร้าง 4,600 การปิดแท่งเทียน 1H ใต้บริเวณนี้อย่างต่อเนื่องจะเพิ่มความแข็งแกร่งให้กับสถานการณ์ขาลง และอาจเปิดทางไปยังโซน FVG ที่อยู่ด้านล่าง
🔴 แผนการเทรดขาลง
โซนเข้า Sell: 4,595–4,605
ควรรอการยืนยันด้วยแท่งเทียน 1H ที่ปิดต่ำกว่า 4,600 หรือรอ Bearish Retest ของระดับที่ถูกทำลาย
Stop Loss: 4,635–4,645
Take Profit 1: 4,560
Take Profit 2: 4,515
Take Profit 3: 4,485
⚠️ จุดยกเลิกสถานการณ์
หากราคากลับขึ้นไปยืนเหนือ 4,635–4,645 และโดยเฉพาะอย่างยิ่งสามารถทะลุกลับเหนือ 4,650 ได้ สถานการณ์ขาลงระยะสั้นจะอ่อนตัวลง หากราคาสามารถเคลื่อนตัวเหนือ FVG ด้านบนบริเวณ 4,680 ได้อย่างต่อเนื่อง จะถือว่าโครงสร้างขาลงในปัจจุบันถูกยกเลิก
🎯 มุมมองตลาด
Bearish ต่ำกว่า 4,600–4,605
กราฟมีโอกาสเคลื่อนตัวลงต่อไปยัง 4,560 และอาจลงต่อถึง FVG ขนาดใหญ่บริเวณ 4,485–4,515 หากแรงขายยังคงแข็งแกร่ง. XAUUSD: 4,620 อาจเป็นกับดักก่อน Jackson Hole XAUUSD: 4,620 อาจเป็นกับดักก่อน Jackson Hole
ภาพรวมตลาด
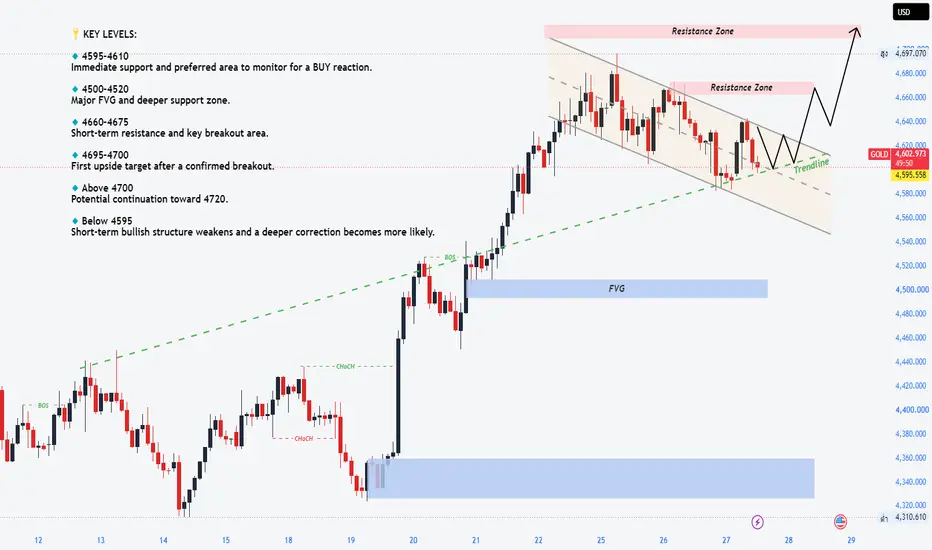
ทองคำยังคงยืนเหนือ 4,600 ได้ แต่แรงซื้อยังไม่แข็งแรงมากนัก เทรดเดอร์กำลังรอ Jackson Hole ซึ่งอาจสร้างความผันผวนให้กับ USD, อัตราผลตอบแทนพันธบัตร และราคาทองคำ
ตราบใดที่ราคายังอยู่ต่ำกว่า 4,660 - 4,675 ฝั่งขายยังคงได้เปรียบ
โครงสร้างทางเทคนิค
ทองคำกำลังซื้อขายบริเวณ 4,602 ใกล้กับ Buyer Reaction Base ที่ 4,600 - 4,610
หากโซนนี้ยังรับราคาได้ ราคามีโอกาสรีบาวด์ไปที่ 4,620 และต่อไปยัง 4,660 - 4,675 แต่แนวต้านหลักยังอยู่ที่ 4,660 - 4,675 ขณะที่ 4,680 - 4,700 เป็น Premium Liquidity Zone
หากราคาหลุดต่ำกว่า 4,600 ทองคำอาจลงต่อไปยัง 4,505 - 4,525 และถัดไปที่ 4,455 - 4,475
ระดับสำคัญ
ราคาปัจจุบัน: 4,602
โซนตัดสินใจ: 4,620
แนวรับ: 4,600 - 4,610
โซนขาย: 4,660 - 4,675
Premium Liquidity: 4,680 - 4,700
แนวรับล่าง: 4,505 - 4,525
Deep Demand: 4,455 - 4,475
ยืนยันขาขึ้น: เหนือ 4,675
ขาลงต่อเนื่อง: ต่ำกว่า 4,600
แผนการเทรด
Sell Scenario
Entry: 4,660 - 4,675 หลังมีสัญญาณยืนยันขาลง
SL: เหนือ 4,700
TP: 4,620 / 4,600
Premium Sell
Entry: 4,680 - 4,700 หลังเกิดแรงปฏิเสธราคา
SL: เหนือ 4,725
TP: 4,660 / 4,620 / 4,600
Buy Reaction
Entry: 4,600 - 4,610 หลังมีสัญญาณยืนยันขาขึ้น
SL: ต่ำกว่า 4,580
TP: 4,620 / 4,660
Breakdown Sell
Entry: ต่ำกว่า 4,600 หลังรีเทสต์ล้มเหลว
SL: เหนือ 4,620
TP: 4,560 / 4,525 / 4,505
Deep Buy Re-entry
Entry: 4,505 - 4,525 หลังมีสัญญาณยืนยันขาขึ้น
SL: ต่ำกว่า 4,475
TP: 4,600 / 4,620
มุมมองโดยรวม
ทองคำยังมีแรงรับบริเวณ 4,600 - 4,610 แต่โครงสร้างยังคงเอียงไปทางขาลงตราบใดที่ราคายังต่ำกว่า 4,660 - 4,675
หากยืนเหนือ 4,600 ได้ อาจเกิดการรีบาวด์ แต่ถ้าหลุดต่ำกว่าระดับนี้ อาจเปิดทางลงไปยัง 4,505 - 4,525
รอการยืนยันก่อนเสมอ หลีกเลี่ยงการไล่ซื้อใต้แนวต้าน หรือขายตรงใส่แนวรับ
ฝั่งซื้อจะป้องกัน 4,600 ก่อน Jackson Hole ได้หรือไม่ หรือฝั่งขายจะกดราคาหลุดฐานนี้?
เพิ่มขึ้น 
เพิ่มขึ้น 
XAUUSD — ย่อซื้อที่แนว Fibonacci (Buy the Fibonacci Pullback)การวิเคราะห์ปัจจัยพื้นฐาน (Fundamental Analysis)
ราคาทองคำกำลังอยู่ในช่วงพักตัว (Consolidate) เนื่องจากเงินดอลลาร์สหรัฐที่แข็งค่าขึ้นเล็กน้อยจำกัดแรงส่งฝั่งขาขึ้น ก่อนการเปิดเผยข้อมูลเงินเฟ้อ PCE เดือนกรกฎาคม อย่างไรก็ตาม ราคาน้ำมันที่ลดลงและอัตราผลตอบแทนพันธบัตรที่ย่อตัวลงยังคงเป็นปัจจัยหนุน ขณะที่ตลาดกำลังเฝ้ารอถ้อยแถลงของ Kevin Warsh ประธานเฟด ในงานประชุม Jackson Hole เพื่อความชัดเจนเกี่ยวกับแนวโน้มอัตราดอกเบี้ย
การวิเคราะห์ทางเทคนิค (Technical Analysis)
ในไทม์เฟรม H1 ราคาทองคำ (XAUUSD) เคลื่อนไหวอยู่ใกล้ระดับ 4,621 หลังจากปรับฐานลงมาจากบริเวณ 4,670 โครงสร้างในภาพรวมยังคงเป็นเทรนด์ขาขึ้น (Bullish) หลังจากเกิดสัญญาณ BOS (Break of Structure) หลายครั้ง แต่การเกิด CHoCH (Change of Character) ล่าสุดชี้ให้เห็นว่าโมเมนตัมระยะสั้นเริ่มอ่อนกำลังลง โซนเข้าซื้อที่ได้เปรียบ (Preferred Buy Zone) อยู่ที่ 4,578–4,590 ซึ่งเป็นจุดร่วม (Confluence) ระหว่างระดับ Fibonacci 0.5 และโครงสร้างแนวรับจากการเบรกเอาต์รอบก่อน หากฝั่งซื้อสามารถรับมือและรักษาแนวนี้ไว้ได้ ราคาทองคำมีโอกาสรีบาวด์กลับขึ้นไปที่ FVG (Fair Value Gap) ช่วง 4,643–4,658 ก่อนจะมุ่งหน้าไปทดสอบจุดสูงสุดเดิมที่เปราะบาง (Weak High) บริเวณ 4,695–4,700
ระดับราคาสำคัญ (Important Key Levels)
ราคาปัจจุบัน: 4,621.55
โซนซื้อหลัก (Main Buy Zone): 4,578–4,590
แนวรับระยะสั้น: 4,605–4,615
แนวต้านระยะสั้น: 4,643–4,658
บริเวณสภาพคล่อง (Liquidity Area): 4,695–4,700
เป้าหมายหลัก: 4,695–4,700
จุดยกเลิกแผน (Invalidation): หลุดต่ำกว่า 4,560
แผนการเทรด (Trading Scenario)
แผนการเข้าซื้อหลัก (Main Buy Setup)
จุดเข้าซื้อ (Entry): 4,578–4,590
จุดตัดขาดทุน (Stop Loss): 4,560
จุดทำกำไร 1 (Take Profit 1): 4,645–4,658
จุดทำกำไร 2 (Take Profit 2): 4,675
จุดทำกำไร 3 (Take Profit 3): 4,695–4,700
เงื่อนไขการเข้าซื้อ (Buy Condition)
รอให้ราคาปรับตัวลงมายังโซนซื้อหลักและแสดงสัญญาณยืนยันการกลับตัวเป็นขาขึ้น เช่น การกวาดสภาพคล่อง (Liquidity Sweep), ไส้เทียนล่างยาว, รูปแบบแท่งเทียนกลืนกินฝั่งซื้อ (Bullish Engulfing), การทะลุลงหลอก (Failed Breakdown) หรือราคาเปิดกลับขึ้นมาปิดเหนือ 4,590 บนไทม์เฟรม H1 ซึ่งอาจยืนยันแรงซื้อที่กลับเข้ามา หากราคาทะลุและยืนอยู่ต่ำกว่า 4,560 จะถือว่าแผนการเทรดฝั่งซื้อนี้โมฆะ
มุมมองโดยรวม (Overall View)
โครงสร้างหลักบน H1 ยังคงเป็นขาขึ้น แต่การปรับฐานรอบนี้อาจดำเนินต่อไปอีกสักระยะก่อนที่ฝั่งซื้อจะกลับมาคุมตลาด แผนที่เหมาะสมที่สุดคือหลีกเลี่ยงการไล่ราคาบริเวณ 4,620 และควรรอการย่อตัวที่ลึกกว่าเข้าสู่โซน 4,578–4,590 หากมีสัญญาณตอบรับที่ชัดเจน จะช่วยเปิดโอกาสให้ราคาขึ้นไปทดสอบ FVG ด้านบนอีกครั้ง ก่อนที่ราคาจะพยายามขึ้นไปกวาดสภาพคล่องที่จุดสูงสุดเดิมใกล้ระดับ 4,700
คุณคาดว่าราคาทองคำจะย่อลงมาถึงโซนซื้อ 4,578–4,590 ก่อนที่จะเริ่มการปรับตัวขึ้นรอบใหม่หรือไม่? เพิ่มขึ้น 
ลดลง 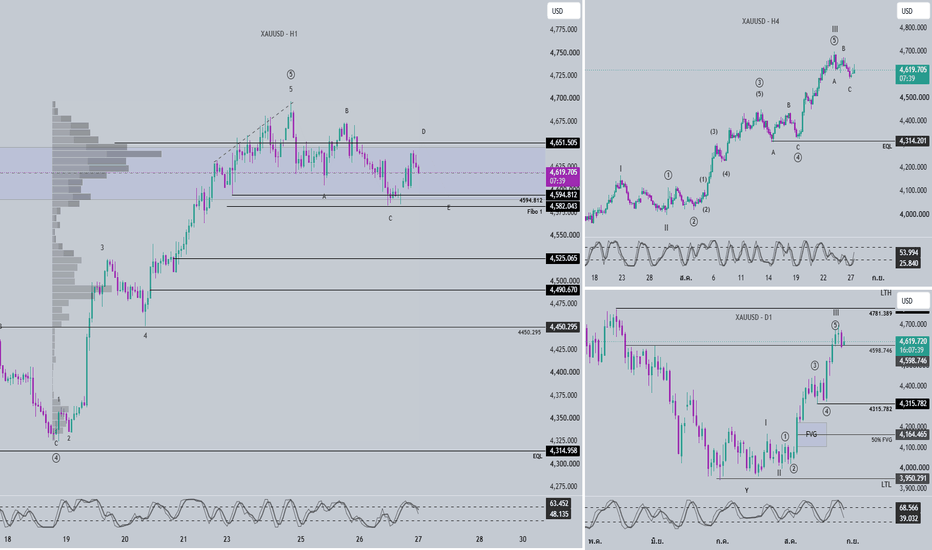
XAUUSD — รูปแบบ Double Top MSS บ่งชี้การขายต่อเนื่อง
บริบทตลาด
ราคาทองคำซื้อขายอยู่ที่ประมาณ 4,636 ดอลลาร์ หลังจากล้มเหลวสองครั้งใกล้บริเวณ 4,670 ดอลลาร์ รูปแบบลิ่มขาขึ้นที่สมบูรณ์ รูปแบบ Top 1 / Top 2 และ MSS ขาลงที่ตามมา บ่งชี้ว่าการขยายตัวขาขึ้นล่าสุดกำลังเปลี่ยนไปเป็นการกระจายตัวขาลงในระยะสั้น
ภาพรวมเศรษฐกิจมหภาคกำลังระมัดระวังมากขึ้นสำหรับทองคำ ราคาได้ปรับตัวลงจากระดับสูงสุดในรอบสามเดือน เนื่องจากตลาดรอข้อมูลอัตราเงินเฟ้อ PCE เดือนกรกฎาคม ในขณะที่ราคาน้ำมันที่ลดลงและผลตอบแทนพันธบัตรที่ผ่อนคลายลงตามมาหลังจากการเจรจาอิหร่าน-โอมานรอบช่องแคบฮอร์มุซ การประชุม Jackson Hole เริ่มต้นในวันที่ 27 สิงหาคม โดยประธานเฟด เควิน วอร์ช มีกำหนดกล่าวสุนทรพจน์ในวันที่ 28 สิงหาคม ดังนั้นความผันผวนเกี่ยวกับอัตราเงินเฟ้อและความคาดหวังอัตราดอกเบี้ยอาจยังคงอยู่ในระดับสูง
มุมมองของ SMC
ความล้มเหลวของรูปแบบ Double Top ใกล้ 4,670 ดอลลาร์ ตามมาด้วย MSS ขาลงรอบโครงสร้าง 4,628–4,635 ดอลลาร์ แสดงให้เห็นว่าผู้ซื้อกำลังสูญเสียการควบคุมในระยะสั้นหลังจากการขยายตัวของลิ่มขาขึ้น
สภาพคล่องฝั่งขายยังคงเปิดช่องว่างอยู่ต่ำกว่าราคาปัจจุบัน เป้าหมายแรกคือระดับราคา $4,600–$4,610 SSL ขณะที่เป้าหมายที่ระดับ $4,565–$4,575 ยังคงเป็นเป้าหมายขาลงที่ใหญ่กว่า แทนที่จะไล่ตามการลดลงในปัจจุบัน รูปแบบการซื้อขายที่ชัดเจนกว่าคือการพยายามกลับขึ้นไปเหนือพื้นที่ MSS ที่ถูกทำลายแต่ไม่สำเร็จ ตามด้วยการปรับตัวลงอีกครั้ง
สถานการณ์การซื้อขายหลัก
เงื่อนไข:
ราคาทองคำทดสอบพื้นที่ MSS ที่ $4,628–$4,638 อีกครั้ง แต่ไม่สามารถกลับมาได้รับแรงหนุนขาขึ้นได้ จำเป็นต้องมีการปฏิเสธขาลงที่ชัดเจนพร้อมการยืนยันจาก MSS หรือ CHOCH ในกรอบเวลาที่ต่ำกว่าก่อนเข้าซื้อ
จุดเข้า (Entry): $4,628–$4,638 (หลังจากมีสัญญาณยืนยันฝั่งขาลง)
จุดตัดขาดทุน (SL): เหนือโครงสร้างการปฏิเสธราคา (rejection structure)
TP1: $4,600–$4,610
TP2: $4,565–$4,575
โซนสำคัญที่ต้องจับตา
ราคาปัจจุบัน: $4,636.135
โซน MSS / ปฏิกิริยาฝั่งขาย (sell reaction): $4,628–$4,638
สภาพคล่องด้านบน (Top liquidity): $4,665–$4,675
เป้าหมาย SSL แรก: $4,600–$4,610
เป้าหมายหลัก: $4,565–$4,575
เงื่อนไขยกเลิกแผน (Invalidation): ราคากลับมายืนเหนือโครงสร้าง Top 2 ได้อีกครั้ง
สัญญาณยืนยัน: การปฏิเสธราคาฝั่งขาลง (Bearish rejection) ร่วมกับ MSS หรือ CHOCH
มุมมองสำหรับทองคำ
มุมมองฝั่งขาย (Sell bias) ยังคงมีน้ำหนัก ตราบใดที่ราคาทองคำไม่สามารถกลับขึ้นไปยืนเหนือโครงสร้างขาลงที่ถูกทำลายไปก่อนหน้านี้ และยังคงเคลื่อนไหวต่ำกว่าจุดสูงสุดของรูปแบบ Double-top แผนที่แนะนำคือการรอสัญญาณยืนยันบริเวณโซน MSS แทนที่จะไล่ราคาตามแรงเทขาย
หากฝั่งขายยังคงคุมสถานการณ์ได้ ราคาอาจปรับตัวลงไปที่ระดับ $4,600–$4,610 ก่อน และมีโอกาสลงไปลึกถึงโซน Deep Discount Demand ใกล้ระดับ $4,570 ทั้งนี้ หากราคาสามารถกลับมายืนเหนือโครงสร้าง Top 2 ได้อย่างมั่นคง จะทำให้สถานะฝั่งขาลงอ่อนกำลังลง
หากไม่มีสัญญาณยืนยัน ก็จะไม่ทำการเทรด ลดลง 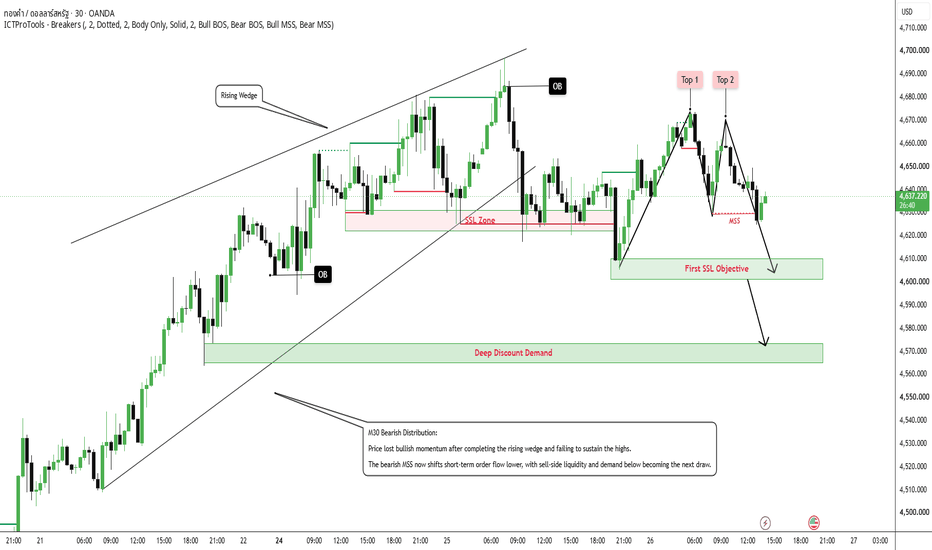
ทองคำ (TF 1H) กับรูปแบบ Descending Channelแนวรับ 4,615 จะรับอยู่หรือไม่ ก่อนที่จะร่วงลงแรงสู่ระดับ 4,570?
ภาพรวมตลาด
• ปัจจัยขับเคลื่อนหลัก: ราคาทองคำ Spot เคลื่อนไหวอยู่ที่ระดับประมาณ 4,643 ดอลลาร์ ในวันพุธที่ 26 สิงหาคม 2026 โดยราคาอยู่ในช่วงพักตัว (consolidation) ภายในโครงสร้างการปรับฐาน หลังจากไม่สามารถยืนเหนือระดับ Weak High ที่ 4,696.928 ได้ สภาพคล่องในตลาดเริ่มเบาบางลงและนักลงทุนหันมาถือครองสินทรัพย์เชิงรับ (defensive positioning) เพื่อเตรียมรับมือกับการประชุม Jackson Hole Economic Symposium ที่จะเริ่มขึ้นในวันพรุ่งนี้ (27–29 ส.ค.) โดยตลาดต่างเฝ้ารอถ้อยแถลงสำคัญจาก Kevin Warsh ประธานเฟด เกี่ยวกับทิศทางอัตราดอกเบี้ยและนโยบายงบดุล
• ภาวะตลาด: กระแสคำสั่งซื้อขายของสถาบัน (Institutional order flow) แสดงให้เห็นถึงรูปแบบการกระจายตัวเพื่อปรับฐาน (corrective distribution) ตามตำรา การที่ราคาหลุดเส้นแนวโน้มขาขึ้น (ascending trendline) ระยะหลายวันลงมา ทำให้รูปแบบปัจจุบันเปลี่ยนผ่านเข้าสู่ลักษณะของช่องราคาคู่ขนานขาลง (descending parallel channel) หรือรูปแบบธงปรับฐาน (corrective flag) อย่างชัดเจน
บริบททางเทคนิค
• โครงสร้างราคา: ช่องราคาปรับฐานขาลง (Bearish Corrective Channel) ในกรอบเวลา 1 ชั่วโมง (1H) เกิดสัญญาณ Bearish CHoCH (การเปลี่ยนโครงสร้างเป็นขาลง) อย่างชัดเจนหลังจากราคาขึ้นไปกวาดสภาพคล่องเหนือระดับ Weak High ที่ 4,696.928 ขณะนี้ราคากำลังสร้างจุดสูงสุดที่ต่ำลง (lower highs) และจุดต่ำสุดที่ต่ำลง (lower lows) ภายในช่องราคาขาลง
• สภาพคล่องและความไม่สมดุล (Liquidity & Imbalance): ปัจจุบันราคาเคลื่อนไหวอยู่ใกล้กึ่งกลางช่องราคาที่ระดับประมาณ 4,643.465 โดยฝั่งผู้ซื้อพยายามดันราคาให้ดีดตัวขึ้นชั่วคราว (relief bounce) ไปยังขอบบนของช่องราคา ก่อนที่จะมุ่งหน้าสู่การหลุดแนวรับโซน 4,615–4,625 เพื่อลงไปทดสอบโซนความต้องการซื้อในระดับราคาต่ำ (Discount Demand) และกลุ่ม FVG หลักที่ระดับ 4,560–4,580
โซนราคาสำคัญ (Key Zones)
• Macro Swing High (Weak High): 4,696.92
• ราคาตลาดปัจจุบัน: 4,643.46
• โซนแนวรับระยะสั้น / กรอบล่างของ Channel: 4,615.00 – 4,625.00
• โซน Demand หลักในระดับราคาต่ำ (Discount Demand) และ FVG Array: 4,560.00 – 4,580.00
• โซน Demand สำรอง (Secondary Demand Pool): 4,520.00 – 4,540.00
• ฐานโครงสร้างราคาหลัก (Strong Low): 4,324.24
แผนการเทรด (เงื่อนไข IF–THEN)
• หากราคาถูกปฏิเสธที่กรอบบนของ Channel (4,655–4,665) หรือปิดแท่งเทียน 1 ชั่วโมงต่ำกว่าโซนแนวรับ 4,615 อย่างชัดเจน -> ให้พิจารณาเปิดสถานะ Short เพื่อเล่นตามแนวโน้มขาลง โดยมีเป้าหมายที่ 4,600 และโซน Discount Demand หลัก/FVG Array (4,560.00 – 4,580.00)
• หากราคาหลุดออกจากกรอบ Channel โดยปิดแท่งเทียน 1 ชั่วโมงเหนือระดับ 4,675 อย่างแข็งแกร่ง -> รูปแบบ Bearish Corrective Flag จะถือว่าถูกยกเลิก และการปรับตัวลงต่อจะหยุดชะงักลง
มุมมองจาก MMFLOW
• มุมมองตลาด (Bias): มองเป็นการปรับตัวลงต่อในลักษณะการพักตัว (Bearish Corrective Continuation) แม้ว่าแนวโน้มหลัก (Macro Trend) จะยังคงแข็งแกร่ง แต่การเคลื่อนไหวของราคาในระหว่างวันเอื้อต่อการเปิดสถานะ Short เมื่อราคาดีดตัวกลับมาทดสอบแนวต้านภายใน Channel เพื่อมุ่งหน้าสู่โซน Demand ราคาต่ำ (Discount Demand) ของกลุ่มสถาบัน
คุณกำลังวางแผนเทรดจังหวะราคาหลุดกรอบ Descending Channel เพื่อลงไปที่ 4,570 หรือกำลังรอจังหวะเข้าซื้อที่โซน Demand ราคาต่ำ (Deep Discount) กันแน่? ลดลง 
ลดลง

คลื่น B หมดแรง 4,650 เป้าหมาย 4,460 | XAUUSD 26/08📊 XAUUSD 1H: คลื่น B หมดแรงที่ 4,650 – ขายสั้นอย่างแม่นยำไปยังโซนความต้องการ 4,460
ทองคำ (XAU/USD) ในกรอบเวลา 1H กำลังถึงจุดเปลี่ยนสำคัญ หลังจากโครงสร้างคลื่น 5 คลื่นเสร็จสมบูรณ์ที่ระดับสูงสุดที่ 4,685 ราคาได้ดำเนินการตามลำดับการแก้ไข A-B-C ตามตำรา เรากำลังติดตามการหมดแรงของคลื่น (B) เข้าสู่แนวต้านสั้นที่สำคัญ เสนอการเข้าสั้นที่มีอัตราส่วนความเสี่ยงต่อผลตอบแทนสูงก่อนการลดลงใหญ่เข้าสู่ความต้องการหลัก
🔍 1. โครงสร้างตลาด & อคติทิศทาง
อคติโดยรวม: ขาลง (ระยะสั้น / วันนี้) ➔ ขาขึ้น (ระยะกลางที่ความต้องการ)
การคาดการณ์เส้นทางราคาวันนี้: คาดว่าจะมีการกวาดล้างสภาพคล่อง/ทดสอบซ้ำที่ 4,650 – 4,655 วันนี้ ราคาคาดว่าจะปฏิเสธโซนนี้อย่างแรงในช่วงการซื้อขายที่จะมาถึง ทะลุแนวรับท้องถิ่นที่ 4,636 และเร่งลงไปที่ 4,600 ก่อนที่จะขยายแรงกระตุ้นคลื่น (C) ลงไปที่ 4,460
โซนหลัก (POI หลัก): 4,450 – 4,480 (บล็อกคำสั่ง + การรวมกันของจุดควบคุม)
💡 2. การตั้งค่าการซื้อขายเฉพาะ & แผนการดำเนินการ
📉 แผนการซื้อขายหลัก: ขายสั้นในวัน (แรงกระตุ้นคลื่น C ลง)
ทิศทาง: ขาย / ขาย
จุดเข้า (จำกัด / ยืนยัน): 4,650 – 4,655 (การย้อนกลับ 50%–61.8% ของขาท้องถิ่น / อุปทานขาลง)
หยุดขาดทุน (SL): 4,688 (วางไว้อย่างเคร่งครัดเหนือจุดสูงสุดของคลื่น B / จุดสูงสุด BSL ภายในที่ 4,685 การปิดเหนือ 4,688 จะทำให้การนับคลื่น C ขาลงเป็นโมฆะโดยสิ้นเชิง)
ระดับทำกำไร (TP):
TP1: 4,600.00 🎯 (กวาดล้างสระสภาพคล่อง — เลื่อน SL ไปที่จุดคุ้มทุนที่นี่)
TP2: 4,550.00 🎯 (โซนการย้อนกลับฟีโบนัชชี 50% — รับกำไร 70%)
TP3 (เป้าหมายหลัก): 4,465.00 🎯 (ด้านบนของ OB + โซนความต้องการ POC ปริมาณ — ออกทั้งหมด)
อัตราส่วนความเสี่ยงต่อผลตอบแทน: ~1 : 5.3
📈 แผนการซื้อขายรอง: ซื้อยาว (โซนปฏิกิริยาความต้องการ)
ทิศทาง: ซื้อ / ซื้อ
จุดเข้า (POI): 4,455 – 4,475 (การรวมกันของบล็อกคำสั่ง H1 & POC ปริมาณ)
ทริกเกอร์: รอการเปลี่ยนแปลงลักษณะ (ChOCH) ของ H1 หรือแท่งเทียนขาขึ้นที่แข็งแกร่งภายในโซนก่อนเข้า
หยุดขาดทุน (SL): 4,428.00 (วางไว้ต่ำกว่าจุดต่ำสุดของโครงสร้างที่ 4,430)
ระดับทำกำไร (TP):
TP1: 4,550.00 🚀 (แนวต้านโครงสร้างก่อนหน้า)
TP2: 4,680.00 🚀 (ทดสอบซ้ำจุดสูงสุด BSL ภายใน)
อัตราส่วนความเสี่ยงต่อผลตอบแทน: ~1 : 7.5
⚠️ 3. การจัดการความเสี่ยง & การซื้อขาย
เสี่ยงไม่เกิน 1% ถึง 1.5% ของทุนบัญชีทั้งหมดในตำแหน่งสั้น
ย้ายหยุดขาดทุนไปที่จุดคุ้มทุน (BE) ทันทีที่ราคาถึง TP1 (4,600.00) เพื่อล็อคการซื้อขายที่ปราศจากความเสี่ยง
หากการตั้งค่าระดับต่อระดับนี้สอดคล้องกับการวิเคราะห์ของคุณ กดปุ่ม Boost 🚀 และแบ่งปันความคิดของคุณในความคิดเห็นด้านล่าง! ซื้อขายอย่างปลอดภัย! ลดลง 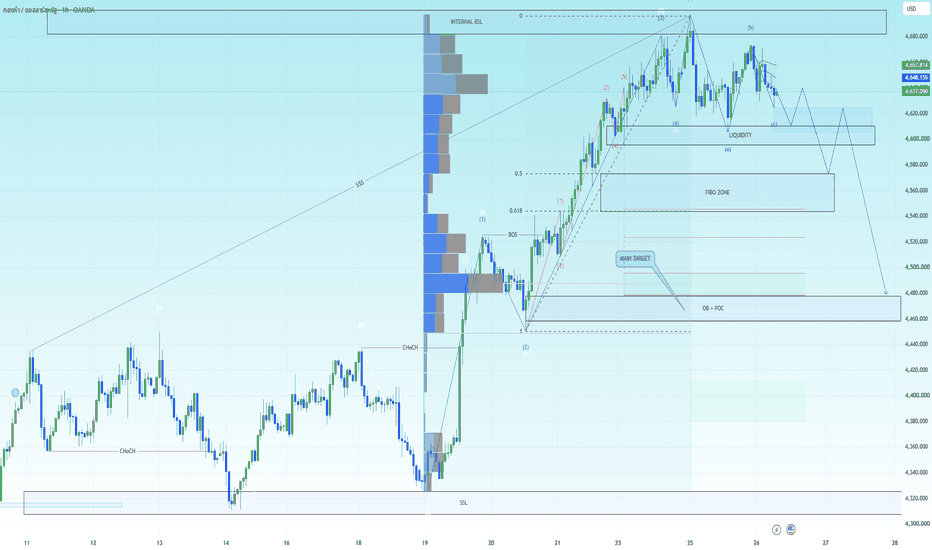
ลดลง 
XAUUSD — ซื้อเมื่อย่อทดสอบเส้นแนวโน้ม H1 (Trendline Retest)การวิเคราะห์ปัจจัยพื้นฐาน
ราคาทองคำมีการย่อตัวลงหลังจากพุ่งแตะระดับสูงสุดในรอบ 3 เดือน เนื่องจากแรงขายทำกำไรและการแข็งค่าของเงินดอลลาร์สหรัฐเข้ามาชะลอแรงส่งชั่วคราว ขณะนี้ตลาดกำลังให้ความสนใจกับข้อมูลเงินเฟ้อ PCE ของสหรัฐฯ ที่กำลังจะประกาศ และการกล่าวสุนทรพจน์ของ Kevin Warsh ประธานเฟด ในงาน Jackson Hole ซึ่งทั้งสองปัจจัยอาจส่งผลต่อการคาดการณ์อัตราดอกเบี้ยและจุดชนวนให้เกิดความผันผวนสูงขึ้น
การวิเคราะห์ทางเทคนิค
ในกราฟ H1 XAUUSD กำลังเคลื่อนไหวอยู่ใกล้ระดับ 4,640 ภายใต้โครงสร้างขาขึ้นที่กว้างกว่าซึ่งได้รับการสนับสนุนจากการเกิด BOS อย่างต่อเนื่อง ขณะนี้ราคาปรับตัวเหนือเส้นแนวโน้มขาขึ้น โดยมีโซนซื้อที่ได้เปรียบอยู่ที่ประมาณ 4,620–4,638 หากราคาสามารถรักษาโซนนี้ไว้ได้พร้อมสัญญาณยืนยันฝั่งซื้อ ราคาทองคำอาจกลับขึ้นไปปิดช่องว่าง FVG ด้านบนที่บริเวณ 4,660–4,678 ก่อนที่จะมุ่งหน้าไปยังจุดสูงสุดเดิมที่อ่อนแอ (Weak High) แถวๆ 4,695–4,700
ระดับราคาสำคัญ
ราคาปัจจุบัน: 4,640.20
โซนซื้อหลัก: 4,620–4,638
แนวรับระยะสั้น: 4,600–4,610
แนวต้านระยะสั้น: 4,660–4,678
โซนสภาพคล่อง (Liquidity Area): 4,695–4,700
เป้าหมายหลัก: 4,695–4,700
จุดยกเลิกแผน (Invalidation): หลุดต่ำกว่า 4,590
แผนการเทรด
แผนการเข้าซื้อหลัก (Main Buy Setup)
จุดเข้าซื้อ (Entry): 4,620–4,638
จุดตัดขาดทุน (Stop Loss): 4,590
จุดทำกำไร 1 (Take Profit 1): 4,660
จุดทำกำไร 2 (Take Profit 2): 4,678
จุดทำกำไร 3 (Take Profit 3): 4,695–4,700
เงื่อนไขการเข้าซื้อ
รอให้ราคาลงมาทดสอบโซนซื้ออีกครั้งและแสดงสัญญาณยืนยันฝั่งซื้อ การเกิด Liquidity Sweep, แท่งเทียนที่มีไส้ล่างยาว, แท่งเทียนกลืนกินฝั่งซื้อ (Bullish Engulfing), การทะลุหลอก (Failed Breakdown) หรือการที่ H1 ปิดกลับขึ้นมาเหนือ 4,638 ได้ อาจเป็นสิ่งยืนยันถึงแรงซื้อที่กลับเข้ามา หากราคาหลุดและปิดแท่งยืนยันต่ำกว่า 4,590 แผนฝั่งซื้อนี้ถือว่ายกเลิก
ภาพรวมทั้งหมด
แนวโน้มใน H1 ยังคงเป็นขาขึ้น ตราบใดที่ XAUUSD ยังเคารพเส้นแนวโน้มขาขึ้นและโครงสร้างการเบรกเอาต์ล่าสุด แผนที่แนะนำคือการหลีกเลี่ยงการไล่ราคาบริเวณ 4,640 แล้วควรรอสัญญาณยืนยันจากโซน 4,620–4,638 การตอบรับที่ดีจากโซนนี้จะช่วยเปิดโอกาสให้ราคาขึ้นไปทดสอบ FVG ด้านบน และพุ่งไปสู่จุดสูงสุดเดิมที่อ่อนแอใกล้ระดับ 4,700 ในที่สุด
คุณคิดว่าทองคำจะสามารถรักษาโซนซื้อ H1 ไว้ได้ก่อนที่จะขึ้นไปกวาดสภาพคล่องตรงจุดสูงสุดเดิม (Weak High) หรือไม่? เพิ่มขึ้น 
XAUUSD – ทองคำบีบตัวก่อนการทะลุครั้งถัดไป XAUUSD – ทองคำบีบตัวก่อนการทะลุครั้งถัดไป
ทองคำกำลังเคลื่อนเข้าสู่โครงสร้างที่แคบลงหลังจากการวิ่งขึ้นที่แข็งแกร่ง
ราคาปัจจุบันซื้อขายอยู่ที่ประมาณ 4,635 ตลาดไม่ได้ดันขึ้นอย่างรุนแรงอีกต่อไป แต่ก็ไม่ได้แตกลงอย่างแรงเช่นกัน แต่ทองคำกำลังบีบตัวระหว่างเส้นแนวโน้มขาลงระยะสั้นด้านบนและโซนสนับสนุนฟีโบนัชชีด้านล่าง
โครงสร้างประเภทนี้มักจะเกิดขึ้นก่อนการเคลื่อนไหวในทิศทางที่แข็งแกร่งกว่า
มุมมองพื้นฐาน
ทองคำยังคงได้รับการสนับสนุนจากโมเมนตัมขาขึ้นที่กว้างขึ้น แต่ผู้ซื้อระยะสั้นเริ่มระมัดระวังมากขึ้นหลังจากการวิ่งขึ้นล่าสุด
ตลาดยังคงจับตาดูการเคลื่อนไหวของ USD ผลตอบแทนของสหรัฐฯ ความคาดหวังของเฟด แรงกดดันจากเงินเฟ้อ และความรู้สึกเสี่ยง หากผลตอบแทนยังคงถูกควบคุมและดอลลาร์ยังคงอ่อนตัว ทองคำอาจยังคงดึงดูดผู้ซื้อ
อย่างไรก็ตาม หลังจากหลายเซสชันขาขึ้นที่แข็งแกร่ง การแก้ไขที่ลึกกว่ายังคงเป็นไปได้ก่อนการเคลื่อนไหวต่อเนื่องครั้งถัดไป นั่นคือเหตุผลที่ปฏิกิริยารอบการสนับสนุนมีความสำคัญมากกว่าการไล่ราคากลาง
มุมมองทางเทคนิค – SMC + ฟีโบนัชชี
จากมุมมองของ SMC ทองคำยังคงรักษาโครงสร้างขาขึ้น แต่ราคากำลังสร้างรูปแบบการบีบตัวระยะสั้น
เส้นแนวโน้มขาลงกำลังกดจากด้านบน ในขณะที่ผู้ซื้อยังคงปกป้องโครงสร้างการสนับสนุนที่ต่ำกว่า ซึ่งหมายความว่าการทะลุครั้งถัดไปจะมีความสำคัญ
การสนับสนุนแรกที่ต้องจับตาดูคือประมาณ 4,604 พื้นที่นี้ทำหน้าที่เป็นโซนปฏิกิริยาฟีโบนัชชีครั้งก่อนและยังคงเป็นสถานที่แรกที่ผู้ซื้ออาจพยายามปกป้องราคา
หากทองคำสูญเสีย 4,604 โซนฟีโบนัชชีคำสั่งซื้อที่ลึกกว่ารอบ 4,573 จะกลายเป็นการสนับสนุนที่สำคัญถัดไป นี่เป็นพื้นที่ที่ดีกว่าสำหรับปฏิกิริยาขาขึ้นที่แข็งแกร่งขึ้นหากราคากวาดลึกลงไปก่อนที่จะเคลื่อนตัวสูงขึ้น
ในด้านบวก ทองคำจำเป็นต้องทะลุเส้นแนวโน้มขาลงระยะสั้นและยึดพื้นที่ 4,640 – 4,660 เพื่อยืนยันความแข็งแกร่งอีกครั้ง หากผู้ซื้อประสบความสำเร็จ เป้าหมายถัดไปคือประมาณ 4,697
โซนราคาที่สำคัญ
ราคาปัจจุบัน: 4,635
แนวต้านระยะสั้น: 4,640 – 4,660
การยืนยันการทะลุ: เหนือ 4,660
โซนฟีโบนัชชีแนวต้าน: 4,604
โซนฟีโบนัชชีคำสั่งซื้อ: 4,573
เป้าหมายด้านบวก: 4,697
โครงสร้างขาขึ้นที่ถูกต้อง: เหนือ 4,573
การทำให้มุมมองขาขึ้นระยะสั้นเป็นโมฆะ: ต่ำกว่า 4,573
สถานการณ์การซื้อขาย
สถานการณ์การซื้อ – ปฏิกิริยาการสนับสนุน
โซนซื้อ: 4,573 – 4,604
การเข้า: การปฏิเสธขาขึ้น การกวาดสภาพคล่อง CHoCH ระยะเวลาที่ต่ำกว่า หรือปฏิกิริยาที่แข็งแกร่งจากโซนซื้อฟีโบนัชชี
SL: ต่ำกว่า 4,573
TP1: 4,640 – 4,660
TP2: 4,697
สถานการณ์การซื้อทะลุ
เงื่อนไข: การทะลุที่สะอาดและถือเหนือ 4,660
การเข้า: การทดสอบซ้ำและการยืนยันขาขึ้น
เป้าหมาย: 4,697
สถานการณ์การขาย – เฉพาะปฏิกิริยาระยะสั้น
การขายไม่ใช่มุมมองหลักในขณะที่ทองคำถือเหนือ 4,573
โซนขาย: 4,640 – 4,660
การเข้า: การปฏิเสธขาลง การทะลุที่ล้มเหลว หรือ CHoCH ขาลงระยะเวลาที่ต่ำกว่า
TP1: 4,604
TP2: 4,573
การทำให้เป็นโมฆะ: หากราคาทะลุและถือเหนือ 4,660 แนวคิดปฏิกิริยาการขายจะอ่อนแอลง
มุมมองของฉัน
ทองคำยังคงเป็นขาขึ้นโดยรวม แต่กราฟระยะสั้นแสดงความลังเล
ตลาดกำลังบีบตัว และนั่นมักหมายความว่าผู้ค้าควรรอการยืนยันแทนที่จะบังคับให้เข้า สำหรับฉัน แผนที่ชัดเจนกว่าคือการดู 4,604 ก่อน จากนั้น 4,573 หากราคาถอยกลับลึกลงไป
หากผู้ซื้อปกป้องโซนเหล่านี้ ทองคำอาจทะลุเส้นแนวโน้มขาลงและเคลื่อนไปสู่ 4,697
หาก 4,573 ล้มเหลว โครงสร้างขาขึ้นจะอ่อนแอลงและทองคำอาจต้องการการแก้ไขที่ลึกกว่าก่อนที่จะฟื้นตัว
ทองคำยังไม่อ่อนแอ แต่ปฏิกิริยาการสนับสนุนครั้งถัดไปจะตัดสินว่าคลื่นขาขึ้นพร้อมที่จะดำเนินต่อไปหรือไม่
คุณคิดว่าทองคำจะปกป้อง 4,604 และทะลุสูงขึ้น หรือจะกวาดลึกลงไปที่ 4,573 ก่อนหรือไม่? ลดลง 
BRIAN XAUUSD – ทองคำยังคงมีมูลค่า ผู้ซื้อยังคงปกป้องแนวโน้ม BRIAN XAUUSD – ทองคำยังคงมีมูลค่า ผู้ซื้อยังคงปกป้องแนวโน้ม
ทองคำยังคงเคลื่อนไหวภายในโครงสร้างการฟื้นตัวแบบขาขึ้น แต่ตลาดกำลังซื้อขายในพื้นที่การตัดสินใจที่สำคัญมาก
หลังจากการเพิ่มขึ้นอย่างแข็งแกร่งจากฐานมูลค่าที่ต่ำกว่า ราคาก็ไม่ได้เคลื่อนไหวอย่างรุนแรงในทิศทางเดียวอีกต่อไป แต่ทองคำกำลังรวมตัวอยู่เหนือโซนซื้อ VAL ประมาณ 4,622 ในขณะที่ยังคงอยู่เหนือโซนซื้อที่ลึกกว่า POC ประมาณ 4,583
สิ่งนี้บอกฉันอย่างหนึ่ง: ผู้ซื้อยังคงอยู่ แต่การดำเนินการต่อไปต้องการการยืนยัน
โครงสร้างทางเทคนิค
ในกราฟ 45 นาที ทองคำยังคงอยู่เหนือโซนซื้อ VAL 4,622 นี่คือการสนับสนุนมูลค่าที่ใกล้ที่สุดและเป็นพื้นที่แรกที่ผู้ซื้อพยายามปกป้องตลาด
การเคลื่อนไหวของราคาล่าสุดแสดงให้เห็นถึงการดึงกลับที่แก้ไขเข้าสู่มูลค่า ไม่ใช่การกลับตัวแบบขาลงเต็มรูปแบบ ตราบใดที่ราคายังคงอยู่เหนือ 4,622 โครงสร้างขาขึ้นยังคงใช้ได้และทองคำสามารถพยายามดันขึ้นอีกครั้ง
เส้นแนวโน้มแบบจุดยังแสดงให้เห็นว่าทองคำยังคงพยายามสร้างการต่อเนื่องภายในโครงสร้างที่เพิ่มขึ้น หากราคาตอบสนองจาก 4,622 และทะลุแนวต้านระยะสั้นใกล้ 4,675 ขาขึ้นถัดไปสามารถดำเนินต่อไปยังพื้นที่เส้นแนวโน้มด้านบนประมาณ 4,700+
อย่างไรก็ตาม หาก 4,622 ล้มเหลว ตลาดอาจหมุนลึกเข้าไปในโซนซื้อ POC ประมาณ 4,583 ก่อนที่ผู้ซื้อจะกลับมา
โซนสำคัญ
พื้นที่ราคาปัจจุบัน: 4,630 - 4,640
ทองคำกำลังทรงตัวหลังจากการดึงกลับสั้น ๆ
โซนซื้อ VAL: 4,622
การสนับสนุนระยะสั้นหลักและโซนปฏิกิริยาของผู้ซื้อในปัจจุบัน
โซนซื้อ POC: 4,583
การสนับสนุนมูลค่าที่ลึกกว่าหากโซนซื้อแรกไม่สำเร็จ
แนวต้าน: 4,675
ระดับการทะลุขึ้นด้านแรก
เป้าหมายเส้นแนวโน้มด้านบน: 4,700 - 4,710
เป้าหมายขาขึ้นถัดไปหากผู้ซื้อฟื้นโมเมนตัมที่แข็งแกร่ง
สถานการณ์การซื้อขาย
ปฏิกิริยาการซื้อจากโซนซื้อ VAL 4,622
การเข้า:
มองหาตำแหน่งซื้อเฉพาะเมื่อราคายังคงอยู่รอบ ๆ 4,620 - 4,625 และแสดงการปฏิเสธขาขึ้นที่ชัดเจน
หยุดการขาดทุน:
ต่ำกว่าโซนซื้อ VAL หรือต่ำกว่าการกวาดต่ำในท้องถิ่น
ทำกำไร:
TP1: 4,675
TP2: 4,700 - 4,710
TP3: ติดตามสูงขึ้นเฉพาะเมื่อทองคำยอมรับเหนือโซนแนวต้าน
การตั้งค่านี้เป็นไปตามโครงสร้างโปรไฟล์ปริมาณขาขึ้นในปัจจุบัน แต่ปฏิกิริยาต้องชัดเจน ฉันไม่ต้องการไล่ตามทองคำในช่วงกลางของช่วง
สถานการณ์ทางเลือก
หากทองคำทะลุต่ำกว่า 4,622 และไม่สามารถเรียกคืนโซนนี้ได้ การสนับสนุนที่สำคัญถัดไปคือโซนซื้อ POC ประมาณ 4,583
ปฏิกิริยาจาก 4,583 จะยังคงรักษาโครงสร้างขาขึ้นที่กว้างขึ้น แต่จะแสดงให้เห็นว่าทองคำต้องการการรีเซ็ตมูลค่าที่ลึกกว่าก่อนที่จะดำเนินการต่อ
มุมมองสุดท้าย
ทองคำยังคงเป็นขาขึ้นในขณะที่ราคายังคงอยู่เหนือ 4,622
ตลาดได้สร้างการฟื้นตัวที่แข็งแกร่งแล้ว และผู้ซื้อยังคงปกป้องมูลค่าที่สูงขึ้น แต่ราคากำลังอยู่ในช่วงการรวมตัว ดังนั้นการยืนยันจึงมีความสำคัญมากกว่าอารมณ์
หาก 4,622 ยังคงอยู่ ทองคำสามารถดันกลับไปที่ 4,675 และอาจถึง 4,700+
หาก 4,622 แตก ฉันจะรอปฏิกิริยาที่ชัดเจนขึ้นรอบ ๆ 4,583
สำหรับตอนนี้ แผนง่าย ๆ :
ซื้อมูลค่า ไม่ใช่ยอด
เคารพแนวโน้ม แต่รอการยืนยัน
ให้ 4,622 ตัดสินการเคลื่อนไหวครั้งต่อไป
ทองคำจะปกป้องโซน VAL นี้และดำเนินการต่อไปสูงขึ้นหรือผู้ซื้อจะรอลึกลงไปที่ 4,583 เพิ่มขึ้น 
XAUUSD: 4,674 การปฏิเสธเปิด 4,563 XAUUSD: 4,674 การปฏิเสธเปิด 4,563
บริบทของตลาด
ทองคำกำลังซื้อขายอยู่รอบ ๆ 4,626 หลังจากสูญเสียแรงผลักดันใกล้กับพื้นที่สูงที่อ่อนแอ โครงสร้างที่กว้างขึ้นยังคงเป็นขาขึ้นหลังจากการขยายตัวที่แข็งแกร่งจากความต้องการที่ต่ำกว่า แต่การเคลื่อนไหวของราคาระยะสั้นเริ่มแสดงความเหนื่อยล้าใกล้ด้านบน
ผู้ซื้อผลักดันอย่างดุดันเข้าสู่ราคาพรีเมียม แต่ราคากำลังล้มเหลวในการยึดคืนพื้นที่ต้านทาน 4,650 - 4,674 นั่นทำให้โซนนี้มีความสำคัญสำหรับการเคลื่อนไหวครั้งต่อไป
จุดสำคัญ: ทองคำยังคงอยู่ในตลาดขาขึ้น แต่ต่ำกว่า 4,674 การแก้ไขไปยัง 4,563 ยังคงเป็นไปได้
โครงสร้างทางเทคนิค
ทองคำเพิ่งสร้างขาขึ้นที่แข็งแกร่ง แต่ราคากำลังรวมตัวอยู่ต่ำกว่าจุดสูงที่อ่อนแอ พื้นที่ 4,674 - 4,690 เป็นโซนขายสเกลปิ้งและยังเป็นพื้นที่สภาพคล่องสูงที่อ่อนแอ
หากราคากลับเข้าสู่ 4,674 - 4,690 และปฏิเสธอีกครั้ง ผู้ขายอาจควบคุมระยะสั้นและผลักดันราคาไปยังเป้าหมายสภาพคล่องด้านล่างที่ 4,563
ช่วงราคาปัจจุบันรอบ ๆ 4,641 - 4,650 มีความสำคัญ หากทองคำไม่สามารถยึดคืนพื้นที่นี้ได้อย่างแข็งแกร่ง ผู้ซื้อยังคงอ่อนแอในระยะสั้น
เป้าหมายด้านล่างหลักแรกคือ 4,563 ระดับนี้ถูกทำเครื่องหมายเป็นสภาพคล่องด้านล่างและสามารถดึงดูดราคาได้หากการปฏิเสธด้านบนยังคงดำเนินต่อไป
ต่ำกว่านั้น พื้นที่ 4,450 - 4,495 เป็นโซนปฏิกิริยากับดักผู้ซื้อครั้งแรก นี่อาจกลายเป็นพื้นที่ปฏิกิริยาที่แข็งแกร่งหากทองคำแก้ไขลึกลงไป
ฐานการโหลดซ้ำของสถาบันที่ใหญ่กว่ายังคงอยู่รอบ ๆ 4,325 - 4,355 แต่สิ่งนี้จะเกี่ยวข้องก็ต่อเมื่อการแก้ไขขยายตัวอย่างหนัก
ระดับสำคัญ
ราคาปัจจุบัน: 4,626
ช่วงการตัดสินใจปัจจุบัน: 4,641 - 4,650
ความต้านทานใกล้เคียง: 4,650 - 4,660
ขายสเกลปิ้ง / จุดสูงที่อ่อนแอ: 4,674 - 4,690
เป้าหมายสภาพคล่องด้านล่าง: 4,563
ปฏิกิริยากับดักผู้ซื้อครั้งแรก: 4,450 - 4,495
ฐานการโหลดซ้ำของสถาบัน: 4,325 - 4,355
การยืนยันขาขึ้น: เหนือ 4,690
การต่อเนื่องขาลง: ต่ำกว่า 4,610
แผนการซื้อขาย
สถานการณ์การขาย
จุดเข้า: 4,650 - 4,674 หลังจากการยืนยันขาลง
SL: เหนือ 4,690
TP: 4,610 / 4,563 / 4,495
เงื่อนไข: ราคากลับเข้าสู่ความต้านทานแต่ล้มเหลวในการยึดคืน 4,674 การปฏิเสธที่ชัดเจนจากพื้นที่นี้ยืนยันว่าผู้ขายยังคงปกป้องจุดสูงที่อ่อนแอ
โซนขายสเกลปิ้ง
จุดเข้า: 4,674 - 4,690
SL: เหนือ 4,715
TP: 4,650 / 4,610 / 4,563
เงื่อนไข: ราคากวาดจุดสูงที่อ่อนแอและถูกปฏิเสธ สิ่งนี้จะบ่งบอกถึงการดึงสภาพคล่องเหนือจุดสูงสุดก่อนการเคลื่อนไหวแก้ไขที่ต่ำกว่า
การขายแบบแตก
จุดเข้า: ต่ำกว่า 4,610 หลังจากการแตกและทดสอบใหม่
SL: เหนือ 4,650
TP: 4,563 / 4,495 / 4,450
เงื่อนไข: ราคาทะลุโครงสร้างระยะสั้น ทดสอบใหม่ และดำเนินต่อด้วยแรงขาลง สิ่งนี้ยืนยันว่าการดึงกลับกำลังขยายตัว
ปฏิกิริยาการซื้อ
จุดเข้า: 4,563 หลังจากการยืนยันขาขึ้น
SL: ต่ำกว่า 4,530
TP: 4,610 / 4,650 / 4,674
เงื่อนไข: ราคาถึงเป้าหมายสภาพคล่องด้านล่างและก่อให้เกิดปฏิกิริยาขาขึ้นที่แข็งแกร่ง นี่เป็นเพียงการซื้อปฏิกิริยา ไม่ใช่การต่อเนื่องขาขึ้นเต็มรูปแบบ เว้นแต่ราคาจะยึดคืน 4,674 ในภายหลัง
การซื้อกลับเข้าลึก
จุดเข้า: 4,450 - 4,495
SL: ต่ำกว่า 4,325
TP: 4,563 / 4,610 / 4,650
เงื่อนไข: หากทองคำแก้ไขลึกลงไป นี่จะกลายเป็นพื้นที่หลักถัดไปสำหรับผู้ซื้อในการป้องกัน การปฏิเสธที่แข็งแกร่งที่นี่จะบ่งบอกถึงแนวโน้มขาขึ้นที่ใหญ่กว่ายังคงมีชีวิตอยู่
การซื้อแบบทะลุ
จุดเข้า: เหนือ 4,690 หลังจากการทะลุและทดสอบใหม่
SL: ต่ำกว่า 4,650
TP: 4,715 / 4,750 / 4,800
เงื่อนไข: ผู้ซื้อต้องทะลุจุดสูงที่อ่อนแอด้วยความแข็งแกร่ง ถือการทดสอบใหม่ และดำเนินการสร้างจุดต่ำที่สูงขึ้น หากไม่มีการยืนยันนี้ การซื้อใกล้จุดสูงสุดยังคงมีความเสี่ยง
อคติโดยรวม
ทองคำยังคงเป็นขาขึ้นในโครงสร้างที่ใหญ่กว่า แต่กราฟระยะสั้นแสดงความเสี่ยงการปฏิเสธต่ำกว่า 4,674 - 4,690
ตราบใดที่ทองคำซื้อขายต่ำกว่าโซนสูงที่อ่อนแอนี้ การดึงกลับไปยัง 4,563 ยังคงมีผล หาก 4,563 มีปฏิกิริยาอย่างแข็งแกร่ง ผู้ซื้ออาจกลับเข้ามา หาก 4,563 ล้มเหลว พื้นที่ปฏิกิริยาหลักถัดไปคือ 4,450 - 4,495
วิธีที่ดีที่สุด: อย่าไล่ตามการซื้อภายใต้จุดสูงที่อ่อนแอ รอการปฏิเสธที่ชัดเจนจาก 4,650 - 4,690 หรือปฏิกิริยายืนยันจาก 4,563
ทองคำจะยึดคืน 4,690 และดำเนินการชุมนุมต่อไป หรือการปฏิเสธจุดสูงที่อ่อนแอนี้จะดึงราคากลับไปที่ 4,563 ก่อนหรือไม่? เพิ่มขึ้น 
XAUUSD 4660 หมดแรง — 4525 เรียกหา? XAUUSD 4660 หมดแรง — 4525 เรียกหา?
การหยุดชะงักที่ต่ำกว่า 4,660 เป็นการเตือน
ทองคำได้ผลักดันขาขึ้นที่สะอาดแล้ว ช่องทางขาลงแตก ราคาได้ระเบิดผ่านโซนโหลดสมาร์ทมันนี่ จากนั้นปีนขึ้นไปในขาขึ้นนั้นเหมือนผู้ขายไม่มีการควบคุม
การเคลื่อนไหวที่ดี
แต่ตอนนี้? จุดที่แตกต่าง
ราคานั่งอยู่รอบ ๆ 4,642 ใต้โซนหมดแรงของผู้ซื้อรอบ ๆ 4,660 - 4,690 นั่นไม่ใช่โซนซื้อที่ถูกอีกต่อไป นั่นคือที่ที่ผู้ซื้อสายมักจะเริ่มถูกทดสอบ
FVG รอบ ๆ 4,655 - 4,670 เป็นพื้นที่กับดักสำหรับฉัน หากทองคำผลักเข้าไปและไม่สามารถถือได้ นั่นอาจเป็นเหยื่อล่าสุดก่อนที่ผู้ขายจะลากราคาลง
อคติหลักคือการดึงกลับขาลงในขณะที่ทองคำอยู่ต่ำกว่า 4,690
ฐานทริกเกอร์ของผู้ขายรอบ ๆ 4,595 - 4,610 เป็นพื้นสำคัญ หากแตก การเคลื่อนไหวสามารถเปิดได้อย่างรวดเร็วไปยัง 4,525 เป้าหมายสภาพคล่องขาลงนั้นนั่งสะอาดเกินไปที่จะเพิกเฉย
ฉันไม่ได้บอกว่าขาขึ้นเต็มรูปแบบตายแล้ว ยังไม่ใช่ โครงสร้างที่ใหญ่กว่ายังคงมาจากการขยายตัวที่แข็งแกร่ง แต่ระยะสั้น? ผู้ซื้อดูเหนื่อยที่นี่
สถานการณ์การซื้อขาย:
ไอเดียขายเฉพาะเมื่อทองคำปฏิเสธ 4,655 - 4,690 หรือแตกต่ำกว่า 4,610 ด้วยแรงกดดันที่สะอาด
โซนเข้า: 4,655 - 4,690 หลังจากการปฏิเสธ
ทางเลือกเข้า: ต่ำกว่า 4,610 หลังจากยืนยันการแตก
หยุดขาดทุน: เหนือ 4,705
TP1: 4,610
TP2: 4,575
TP3: 4,525
ไม่มีการปฏิเสธ ไม่มีการขาย ไม่มีการแตก ไม่มีการไล่ล่า
หากทองคำปิดแข็งแกร่งเหนือ 4,705 ไอเดียการดึงกลับนี้จะถูกปรุง จากนั้นผู้ซื้อสามารถผลักดันต่อไปเพื่อทำจุดสูงสุดใหม่
ตอนนี้ ฉันอ่านว่านี่คือการหมดแรงของผู้ซื้อก่อน สภาพคล่อง 4,525 ต่อไป
คุณคิดว่าทองคำกับดักผู้ซื้อที่ 4,660 ก่อนการล้างหรือไม่? ลดลง 
BRIAN XAUUSD – ทองคำยังคงรักษาแนวโน้มขาขึ้น แต่ 4,676 คือการทดสอBRIAN XAUUSD – ทองคำยังคงรักษาแนวโน้มขาขึ้น แต่ 4,676 คือการทดสอบถัดไป
ทองคำยังคงซื้อขายอยู่ภายในโครงสร้างขาขึ้นที่แข็งแกร่งหลังจากการทะลุและการขยายมูลค่าล่าสุด
แผนภูมิแสดงให้เห็นว่าผู้ซื้อยังไม่ถอยห่าง ทุกการดึงกลับเข้าสู่การสนับสนุนโปรไฟล์ปริมาณได้รับการป้องกัน และราคายังคงอยู่เหนือเส้นแนวโน้มที่เพิ่มขึ้น ซึ่งหมายความว่าโครงสร้างระยะสั้นยังคงเป็นขาขึ้น แต่ทองคำกำลังเข้าใกล้พื้นที่มูลค่าด้านบนที่สำคัญซึ่งผู้ขายอาจตอบสนอง
คำถามสำคัญคือ:
ทองคำกำลังเตรียมพร้อมสำหรับการทะลุอีกครั้งหรือ 4,676 จะกลายเป็นโซนปฏิเสธถัดไป?
โครงสร้างทางเทคนิค
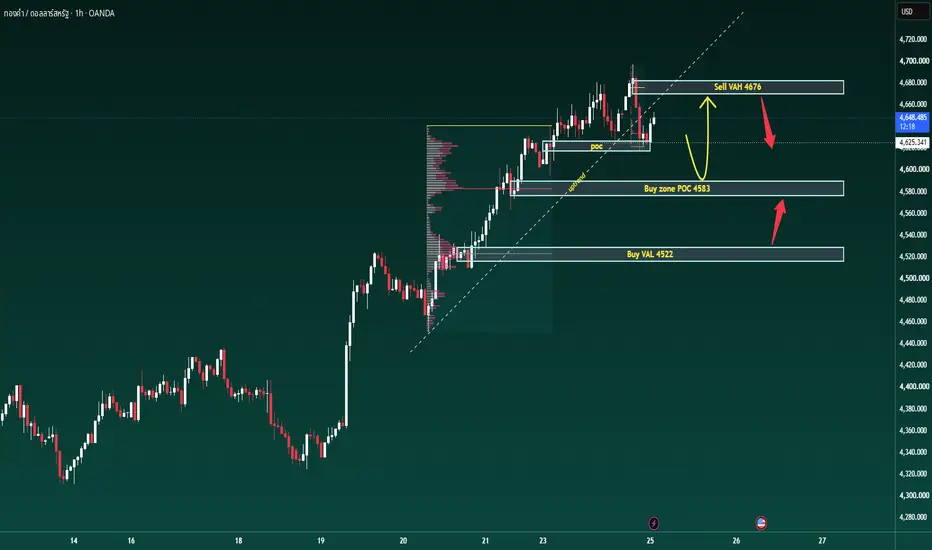
ในแผนภูมิ H1 ทองคำถืออยู่ใกล้ 4,650 หลังจากตอบสนองเหนือพื้นที่ POC ท้องถิ่นรอบ 4,625
โครงสร้างปัจจุบันยังคงเป็นขาขึ้นเพราะราคายังคงอยู่เหนือเส้นแนวโน้มขาขึ้นและเหนือโซนซื้อหลัก POC รอบ 4,583
โซนซื้อ POC 4,583 เป็นการสนับสนุนที่สำคัญที่สุดใต้ราคา หากทองคำดึงกลับเข้าสู่พื้นที่นี้และผู้ซื้อป้องกันได้ ตลาดสามารถสร้างการผลักดันอีกครั้งไปยังโซนขาย VAH รอบ 4,676
ต่ำกว่านั้น โซนซื้อ VAL รอบ 4,522 เป็นการสนับสนุนที่ลึกกว่าหากตลาดต้องการการแก้ไขที่แข็งแกร่งขึ้นก่อนที่จะดำเนินการต่อ
โซนสำคัญ
พื้นที่ราคาปัจจุบัน: 4,645 - 4,655
ทองคำถือมูลค่าสูงหลังจากการผลักดันล่าสุด
POC ท้องถิ่น: 4,625
ระดับปฏิกิริยาระยะสั้น การถือเหนือสิ่งนี้ทำให้ผู้ซื้อยังคงมีความเคลื่อนไหว
โซนซื้อ POC: 4,583
โซนปฏิกิริยาซื้อหลักและการสนับสนุนที่สำคัญสำหรับโครงสร้างขาขึ้น
ซื้อ VAL: 4,522
การสนับสนุนมูลค่าลึกกว่าหากทองคำแก้ไขยากขึ้น
ขาย VAH: 4,676
การต้านทานหลักและเป้าหมายด้านบนถัดไป
สถานการณ์การซื้อขาย
ปฏิกิริยาซื้อจากโซนซื้อ POC 4,583
การเข้า:
มองหาตำแหน่งซื้อเฉพาะเมื่อราคาดึงกลับเข้าสู่ 4,575 - 4,585 และแสดงการปฏิเสธขาขึ้นที่ชัดเจน
หยุดขาดทุน:
ต่ำกว่าโซนซื้อ POC หรือต่ำกว่าการดึงกลับท้องถิ่นต่ำ
ทำกำไร:
TP1: 4,625
TP2: 4,676
TP3: ติดตามสูงขึ้นเฉพาะเมื่อทองคำทะลุและยอมรับเหนือโซนขาย VAH
การตั้งค่านี้ตามโครงสร้างขาขึ้นปัจจุบัน แต่หลีกเลี่ยงการไล่ราคาตรงเข้าสู่การต้านทาน
สถานการณ์ทางเลือก
หากทองคำไม่สามารถถือ 4,583 ได้ ตลาดอาจหมุนลึกลงไปยังโซนซื้อ VAL รอบ 4,522
นั่นไม่ได้ทำลายแนวโน้มขาขึ้นที่ใหญ่กว่าในทันที แต่จะแสดงให้เห็นว่าทองคำต้องเติมค่าต่ำก่อนที่ผู้ซื้อจะสามารถดำเนินการต่อได้
มุมมองสุดท้าย
ทองคำยังคงเป็นขาขึ้นในขณะที่ราคาถือเหนือ 4,583
เส้นแนวโน้มยังคงได้รับการเคารพ ผู้ซื้อกำลังป้องกันค่า และการทดสอบหลักถัดไปคือ 4,676 แต่เนื่องจากราคาใกล้กับการต้านทานอยู่แล้ว การไล่ตามด้านบนไม่ใช่แผนที่สะอาดที่สุด
สำหรับตอนนี้ ฉันชอบรอการดึงกลับเข้าสู่ค่าและดูว่าผู้ซื้อป้องกัน POC อีกครั้งหรือไม่
หาก 4,583 ถือได้ ทองคำสามารถดำเนินต่อไปยัง 4,676
หาก 4,676 ปฏิเสธอย่างแรง การทำกำไรระยะสั้นอาจปรากฏขึ้น
หาก 4,522 ถูกทดสอบและป้องกันได้ นั่นอาจกลายเป็นโซนโหลดใหม่ที่ลึกกว่า
แนวโน้มเป็นขาขึ้น
แผนภูมิขยายออกไป
การเข้าอย่างสะอาดถัดไปขึ้นอยู่กับการดึงกลับ
คุณจะซื้อการทดสอบ 4,583 หรือรอให้ทองคำทะลุ 4,676 ก่อน? เพิ่มขึ้น 
XAUUSD — สัญญาณขายหลังการปฏิเสธราคาพรีเมียม FVG
บริบทตลาด
ราคาทองคำซื้อขายอยู่ที่ประมาณ 4,632 ดอลลาร์ หลังจากถูกปฏิเสธจากปฏิกิริยาพรีเมียมล่าสุดที่ใกล้ 4,680 ดอลลาร์ โครงสร้าง H1 ที่กว้างขึ้นยังคงเป็นขาขึ้นหลังจาก BOS ติดต่อกัน แต่ราคาขณะนี้กำลังปรับตัวลงจากพื้นที่พรีเมียมที่ขยายออกไป ทำให้แนวคิดการขายในปัจจุบันเป็นการตั้งค่าการปรับฐานมากกว่าการกลับตัวเป็นขาลงอย่างเต็มรูปแบบ
ปัจจัยมหภาคยังคงสนับสนุนราคาทองคำผ่านผลตอบแทนพันธบัตรกระทรวงการคลังที่อ่อนตัวลง การซื้อคืนพันธบัตรกระทรวงการคลังสหรัฐฯ เมื่อเร็วๆ นี้ และความไม่แน่นอนทางภูมิรัฐศาสตร์เกี่ยวกับอิหร่าน ราคาทองคำยังแตะระดับสูงสุดในรอบสามเดือนเนื่องจากดอลลาร์ยังคงอ่อนค่า อย่างไรก็ตาม ข้อมูล PCE ของสหรัฐฯ และสุนทรพจน์ของประธานเฟด เควิน วอร์ช ที่แจ็กสันโฮล เป็นตัวกระตุ้นสำคัญต่อไปและอาจสร้างความผันผวนอย่างรุนแรงรอบโครงสร้างพรีเมียมในปัจจุบัน
มุมมองของ SMC
ลำดับของ MSS และ BOS ที่เป็นขาขึ้นยืนยันว่าผู้ซื้อยังคงควบคุมกระแสคำสั่งซื้อ H1 ขนาดใหญ่ อย่างไรก็ตาม ราคาได้ปรับตัวขึ้นอย่างรวดเร็วจากระดับพรีเมียม และสร้างแนวรับแนวต้านสองแนวเหนือราคาตลาดปัจจุบัน ซึ่งสร้างโซนบรรเทาผลกระทบที่อาจเกิดขึ้นจากการขายปรับฐาน
แนวรับแนวต้านด้านบนที่ระดับ $4,662–$4,678 เป็นพื้นที่ตัดสินใจหลัก การขายที่ระดับราคาปัจจุบันหมายถึงการไล่ตามการเคลื่อนไหวครั้งแรก ดังนั้นรูปแบบการซื้อขายที่เหมาะสมกว่าคือการปรับตัวลงมาที่ระดับความไม่สมดุลนี้ ตามด้วยการยืนยันขาลงที่ชัดเจน
สถานการณ์การซื้อขายหลัก
เงื่อนไข:
ราคาทองคำปรับตัวลงมาที่แนวรับแนวต้านด้านบนที่ระดับ $4,662–$4,678 และสร้างการปฏิเสธขาลงที่ชัดเจน จำเป็นต้องมีสัญญาณ MSS หรือ CHOCH ขาลงในกรอบเวลาที่ต่ำกว่าก่อนเข้าซื้อ
จุดเข้า (Entry): $4,662–$4,678 หลังจากมีสัญญาณยืนยันฝั่งขาลง (Bearish confirmation)
จุดตัดขาดทุน (SL): เหนือระดับ $4,690 และจุดสูงสุดที่มีการปฏิเสธราคา (Rejection high)
จุดทำกำไร 1 (TP1): $4,595–$4,610
จุดทำกำไร 2 (TP2): $4,565–$4,580
โซนสำคัญที่ควรจับตามอง
ราคาปัจจุบัน: $4,632.015
โซนขายหลัก (Main sell zone): $4,662–$4,678
FVG ด้านล่าง (Lower FVG): $4,648–$4,660
จุด Mitigation แรก (First Mitigation POI): $4,595–$4,610
จุด Mitigation ลึก (Deep Mitigation): $4,565–$4,580
เงื่อนไขยกเลิกแผน (Invalidation): ราคายืนเหนือระดับ $4,690 ได้ (Acceptance above $4,690)
สัญญาณยืนยัน (Confirmation): การปฏิเสธราคาฝั่งขาลง (Bearish rejection) ร่วมกับ MSS หรือ CHOCH
มุมมอง Prime Gold
มุมมองฝั่งขาย (Sell bias) ยังคงเป็นเพียงการปรับฐาน (Corrective) ในขณะที่โครงสร้างราคาภาพรวมในไทม์เฟรม H1 ยังคงเป็นขาขึ้น แผนที่แนะนำคือการรอให้ราคาขึ้นไปทดสอบและเกิด Mitigation ที่โซน Upper FVG แทนที่จะไล่ราคาตามการปรับตัวลงในขณะนี้
หากฝั่งขายสามารถรักษาโซน $4,662–$4,678 ไว้ได้ ราคาทองคำอาจย่อตัวลงมายังจุด Mitigation แรก และมีโอกาสลงไปถึงโซน Mitigation ลึกได้ แต่หากราคาสามารถยืนเหนือระดับ $4,690 ได้ จะทำให้แผนการขายระยะสั้นนี้เป็นโมฆะ และแนวโน้มขาขึ้นจะกลับมามีอิทธิพลหลักอีกครั้ง
หากไม่มีสัญญาณยืนยัน ก็จะไม่ทำการเทรด ลดลง 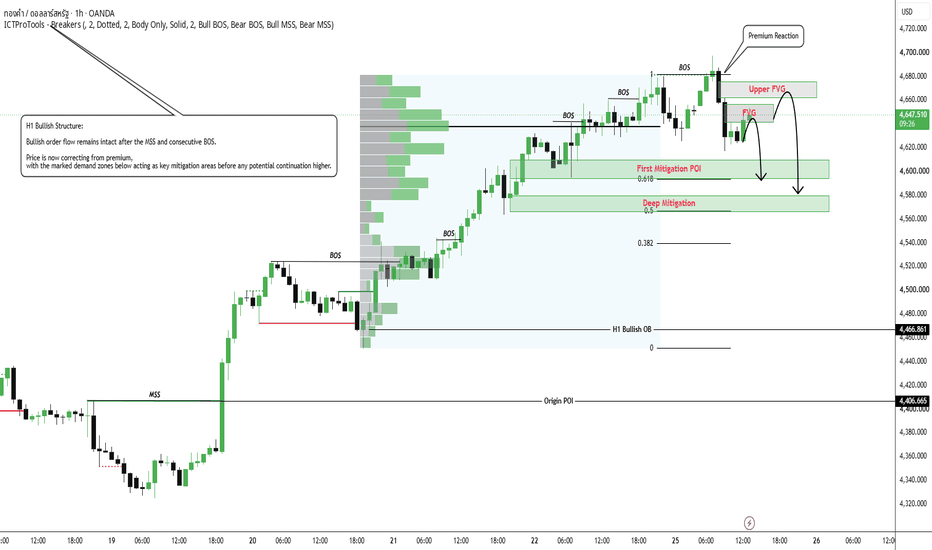
Gold Liquidity: จะเปิดสถานะ Short ที่ 4,660 หรือ Buy ที่ 4570 ดี
ภาพรวมตลาด
• ปัจจัยขับเคลื่อนหลัก (Macro Driver): ราคาทองคำ Spot เคลื่อนไหวอยู่ใกล้ระดับ $4,651 ในวันอังคารที่ 25 สิงหาคม 2026 หลังจากย่อตัวลงจากจุดสูงสุดใหม่ที่บริเวณ $4,696 โดยเม็ดเงินจากนักลงทุนสถาบันกำลังลดสถานะฝั่งซื้อ (Long exposure) เพื่อปรับสมดุลพอร์ตการลงทุน ก่อนการประชุมเศรษฐกิจ Jackson Hole (27–29 ส.ค.) ซึ่งมีความสำคัญสูงและประธานเฟด Kevin Warsh มีกำหนดจะกล่าวสุนทรพจน์ครั้งสำคัญเกี่ยวกับนโยบายการเงิน
• ภาวะตลาด: กลุ่ม Smart Money กำลังสร้างสถานการณ์ในช่วงการกระจายตัวเพื่อปรับฐานราคา (Corrective Distribution Phase) การที่ไม่สามารถรักษาระดับราคาเหนือจุด Weak High ที่ 4,696.928 ได้ ส่งผลให้เกิดแรงเทขายอย่างรุนแรงและรวดเร็ว (Aggressive Sell-side Displacement) จนหลุดเส้นแนวโน้มขาขึ้น (Ascending Support Trendline) ที่ประคองราคามาหลายวัน
บริบททางเทคนิค
• โครงสร้างราคา: รูปแบบการกระจายตัวเพื่อปรับฐานในทิศทางขาลง (Corrective Bearish Distribution) ในกรอบเวลา 1 ชั่วโมง (1H) ราคาได้กวาดสภาพคล่องฝั่งซื้อ (Buy-side Liquidity) เหนือระดับ 4,690 และสร้างจุด Weak High ไว้ที่ 4,696.928 ก่อนที่จะถูกแรงเทขายกดดันอย่างรุนแรงจนหลุดเส้นแนวโน้มขาขึ้น (Ascending Support Trendline)
• สภาพคล่องและความไม่สมดุล (Liquidity & Imbalance): ขณะนี้ราคากำลังดีดตัวขึ้นเพื่อปรับฐาน (Relief Bounce) ไปยังโซน 4,650–4,660 เพื่อทดสอบและปรับสมดุลบริเวณจุดที่หลุดเส้นแนวโน้ม (Mitigation) ทั้งนี้ อัลกอริทึมของตลาดกำลังดึงดูดราคาให้มุ่งหน้าไปยังโซน Discount Demand / FVG Pool ที่ยังไม่มีการทดสอบ (Unmitigated) ซึ่งอยู่ในกรอบราคา 4,560 – 4,580 (กล่องสีฟ้า)
โซนสำคัญ (Key Zones)
• Weak High / Liquidity Sweep Zone: 4,696.928 (Grey Supply Block)
• ราคาตลาดปัจจุบัน: 4,651.08
• จุดทดสอบแนวรับเดิมที่หลุดไป (Breakdown Retest Pivot): 4,655.00 – 4,665.00
• เป้าหมายหลัก / โซน Demand ราคาต่ำ (Discount Demand Box): 4,560.00 – 4,580.00
• แนวรับ Demand สำรอง (Secondary Demand Floor): 4,520.00 – 4,540.00
• แนวรับโครงสร้างหลักระดับใหญ่ (Strong Low): 4,324.24
แผนการเทรด (เงื่อนไข IF–THEN)
• หากราคาดีดตัวขึ้นมาปรับฐาน (corrective bounce) เข้าสู่โซนทดสอบแนวโน้ม (trendline retest) ที่ระดับ 4,655 – 4,665 และเกิดสัญญาณราคาปรับตัวลงแรง (bearish displacement) ใน Timeframe ย่อย (M5/M15) -> ให้พิจารณาเปิดสถานะ Short โดยมีเป้าหมายที่ 4,620 และขยายเป้าหมายไปยังโซน Demand หลักที่ 4,560 – 4,580
• หากราคาหักล้างสัญญาณการหลุดแนวรับเดิม (breakdown) ด้วยการกลับขึ้นไปยืนและปิดแท่งเทียน H1 เหนือระดับ 4,697 -> มุมมองเรื่องการย่อตัวปรับฐานจะถูกยกเลิก และเปิดโอกาสให้ราคาปรับตัวขึ้นต่อสู่ระดับ 4,720+
มุมมอง MMFLOW
• มุมมองตลาด (Bias): มองลงเพื่อทดสอบแนวรับ (Corrective Bearish Retest) การเข้าซื้อที่จุดสูงสุดหลังจากมีการกวาดสภาพคล่อง (liquidity sweep) มีความเสี่ยงขาลงสูง สถิติชี้ว่าการเปิดสถานะ Short เมื่อราคาดีดตัวขึ้นมาในระยะสั้น (relief bounce) เข้าสู่โซน Demand ราคาต่ำ (deep discount) จะมีความได้เปรียบมากกว่า
คุณกำลังวางแผน Short ที่จุดทดสอบแนวโน้ม (trendline retest) เพื่อเป้าหมายที่ 4,570 หรือกำลังรอซื้อเมื่อราคาย่อตัวลงมาที่โซน Demand ด้านล่าง? ลดลง 
XAUUSD: สัญญาณกลับตัวเป็นขาลงที่แนวต้าน 4,675
ราคาทองคำ (XAU/USD) ในกราฟไทม์เฟรม 30 นาที กำลังเคลื่อนตัวเข้าใกล้โซนแนวต้านหรือโซน Supply สำคัญที่ระดับ 4,670–4,680 หลังจากที่มีแรงซื้อผลักดันราคาขึ้นมาอย่างแข็งแกร่ง
🔴 รูปแบบขาลง (Bearish setup):
ราคาได้ปรับตัวขึ้นมาในโซน Supply ที่กำหนดไว้ และดูเหมือนกำลังสร้างรูปแบบ Liquidity Sweep (การกวาดสภาพคล่อง) หรือเกิด SMT Divergence บริเวณจุดสูงสุด หากฝั่งซื้อไม่สามารถทะลุและยืนเหนือโซนนี้ได้ ก็มีความเป็นไปได้สูงที่ราคาจะกลับตัวเป็นขาลง
ระดับราคาสำคัญ:
🔴 แนวต้าน / Supply: 4,670–4,680
🛑 จุดยกเลิกสถานะ (Invalidation): เหนือระดับ 4,698
🎯 เป้าหมายที่ 1: 4,640
🎯 เป้าหมายที่ 2: 4,600
🎯 เป้าหมายที่ 3: 4,565
ระดับ 4,640 ถือเป็นแนวรับสำคัญด่านแรก หากราคาหลุดต่ำกว่าระดับนี้ อาจเร่งให้ราคาเคลื่อนตัวลงไปหาโซนสภาพคล่องฝั่งขาย (sell-side liquidity) บริเวณ 4,595–4,600
สำหรับสถานการณ์ขาลง สัญญาณยืนยันที่ชัดเจนคือการที่ราคาถูกปฏิเสธ (rejection) จากโซน 4,670–4,680 ตามด้วยการหลุดจากโครงสร้างราคาขาขึ้นในระยะสั้น
มุมมอง: 📉 มองเป็นขาลงหากราคาอยู่ต่ำกว่า 4,680
จุดยกเลิกมุมมองขาขึ้น: ราคาสามารถยืนเหนือระดับ 4,698 ได้อย่างมั่นคง
ข้อมูลนี้เป็นการวิเคราะห์ทางเทคนิคเพื่อการศึกษาเท่านั้น ไม่ใช่คำแนะนำทางการเงิน ลดลง