ETHUSDT - Consolidation Before Distribution BINANCE:ETHUSDT is attempting to hold above the 1,850 support level in the medium term, which was previously broken resistance. The reaction to support is weakening, while the broader market remains in a bearish trend
Bitcoin remains stagnant and range-bound. Globally, the market remains in a bearish trend, with no fundamental support in sight.
A decline in the market leader could trigger further downside in Ethereum. The altcoin is consolidating within a symmetrical triangle. The market is building a pre-breakdown base near the lower boundary of the current range, suggesting that a downside breakout may be approaching
Resistance levels: 1,989, 1,927
Support levels: 1,866, 1,854, 1,820
The weak reaction to support indicates that selling pressure may be intensifying. I do not rule out a local liquidity sweep (short squeeze) before the downtrend resumes.
A close below the 1,866–1,854 zone could accelerate the further decline
Best regards,
R. Linda  Short
Short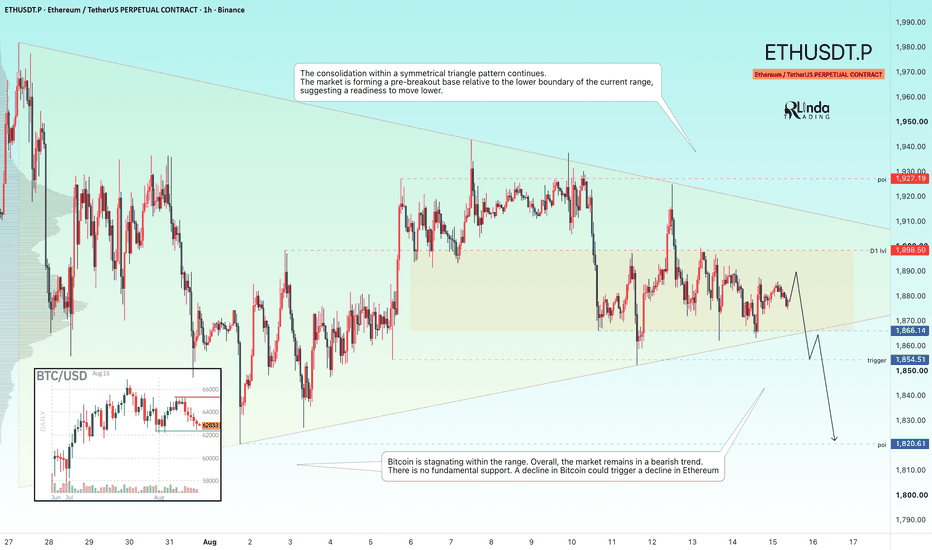
GOLD - The Hunt for Liquidity Ahead of a Rally ICMARKETS:XAUUSD is testing the 4,313 support level as part of a correction. Against the backdrop of a stagnant Dollar Index, the market still has room for further upside
The Dollar Index remains stagnant, but an unstable fundamental and geopolitical backdrop is putting pressure on the dollar and providing support for gold.
Price is correcting after the recent rally, but the fundamental backdrop — including easing rate expectations and geopolitical risks — remains favorable. Buyers are expected to step in on dips.
The key event will be the University of Michigan’s consumer sentiment and inflation expectations data, due later on Friday.
Drivers:
Downside: conflict escalation, rising yields, stronger dollar.
Upside: dip-buying, weaker dollar, easing geopolitical risks
Resistance levels: 4,356, 4,435
Support levels: 4,313, 4,300
Gold maintains its local bullish trend. Within the counter-trend correction, the market is retesting the key liquidity zone at 4,313–4,300 and is bouncing off support.
A close above 4,356 could strengthen the bullish momentum
Best regards,
R. Linda  Long
Long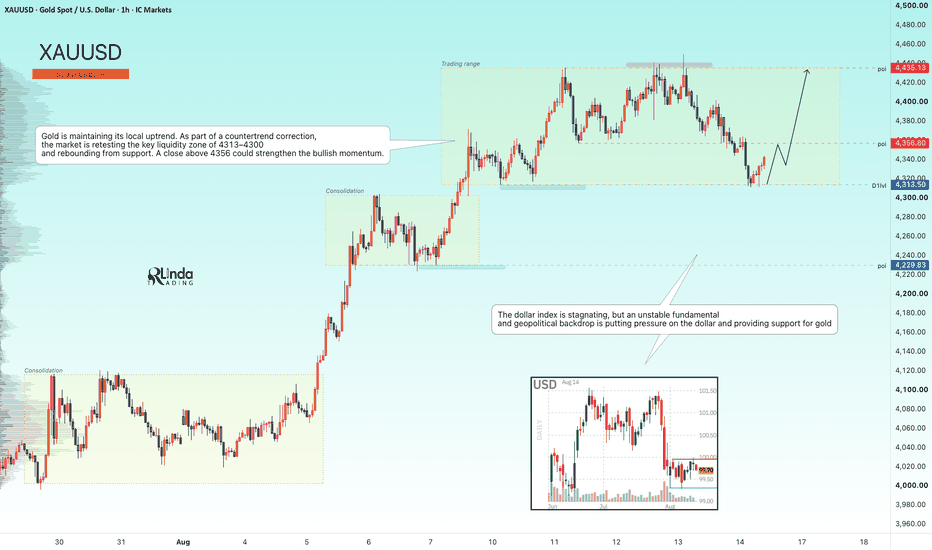
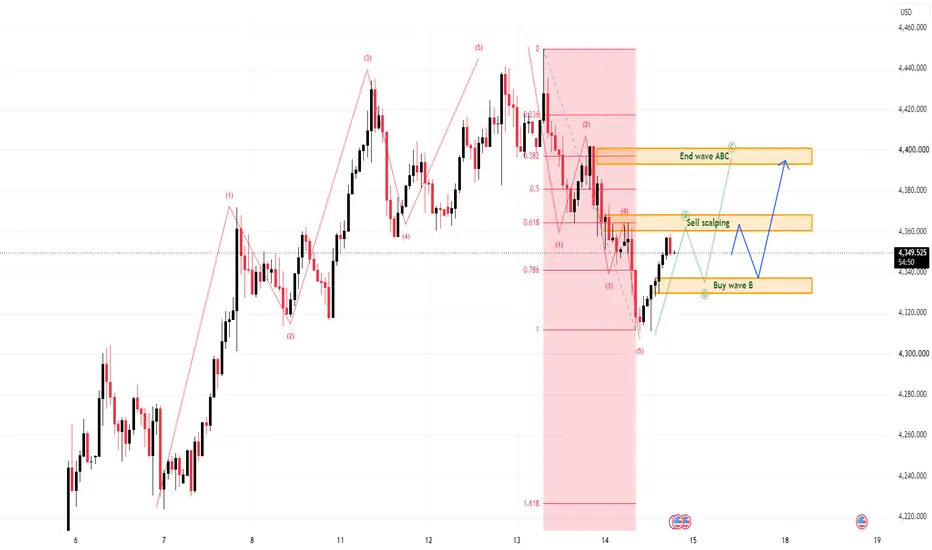
XAUUSD: ABC Recovery Builds Above 4,330
Gold is showing a corrective recovery after the previous bearish wave completed near the lower area. From Kelly’s view, the current chart suggests that XAUUSD may be forming an ABC rebound structure, with buyers trying to defend the 4,330–4,340 zone before pushing price higher.
The key idea is simple: gold is recovering, but this still looks like an ABC correction, not a full bullish reversal yet.
⟡ Market structure
The chart shows gold completed a sharp bearish 5-wave decline from the upper area, then reacted strongly from around 4,310. After that, price started to build a recovery structure and is now trading around 4,350.
The nearest important support is the Buy wave B zone around 4,330–4,340. If gold pulls back into this area and buyers continue to defend it, the market may form wave B and prepare for wave C higher.
The next resistance is around 4,360–4,370, marked as the sell scalping area. If price breaks above this zone with strength, the recovery may continue towards 4,395–4,405, where the chart marks the possible End wave ABC area.
➤ Key levels
◌ 4,330–4,340: Buy wave B zone and key support
◌ 4,350: current price reaction area
◌ 4,360–4,370: sell scalping / short-term resistance
◌ 4,395–4,405: End wave ABC target zone
◌ 4,310: recent wave 5 low and structure protection
◌ Below 4,310: area where the recovery setup weakens
⌁ Elliott Wave view
From an Elliott Wave perspective, gold appears to have completed a bearish 5-wave sequence before starting the current recovery.
Wave A is forming from the 4,310 low into the current reaction area.
Wave B may pull back into the 4,330–4,340 buy zone.
If wave B holds, wave C may continue higher towards 4,360–4,370 first, then 4,395–4,405.
This is why Kelly is watching the current recovery as an ABC correction. The move can still rise, but buyers need to protect the wave B support before the next bullish leg becomes cleaner.
▸ Trading scenario
Preferred scenario: wait for gold to pull back into the Buy wave B zone and show bullish confirmation.
Entry zone: 4,330–4,340 if bullish confirmation appears
Stop loss: below the confirmed wave B low or below 4,310
Take profit 1: 4,360–4,370
Take profit 2: 4,395–4,405
Take profit 3: higher only if price breaks the ABC target with strong momentum
Alternative scenario: if gold breaks below 4,310 with strong bearish pressure, the ABC recovery setup weakens. In that case, price may return to a deeper bearish continuation before building a new support base.
⌁ Kelly’s view
For Kelly, gold is currently in a recovery phase after a bearish wave. The short-term structure supports an ABC rebound, but the clean setup is still to wait for price to confirm support around 4,330–4,340.
Gold may continue its corrective rise.
If Buy wave B holds, wave C may target the 4,395–4,405 area.
Share your view below.
Long 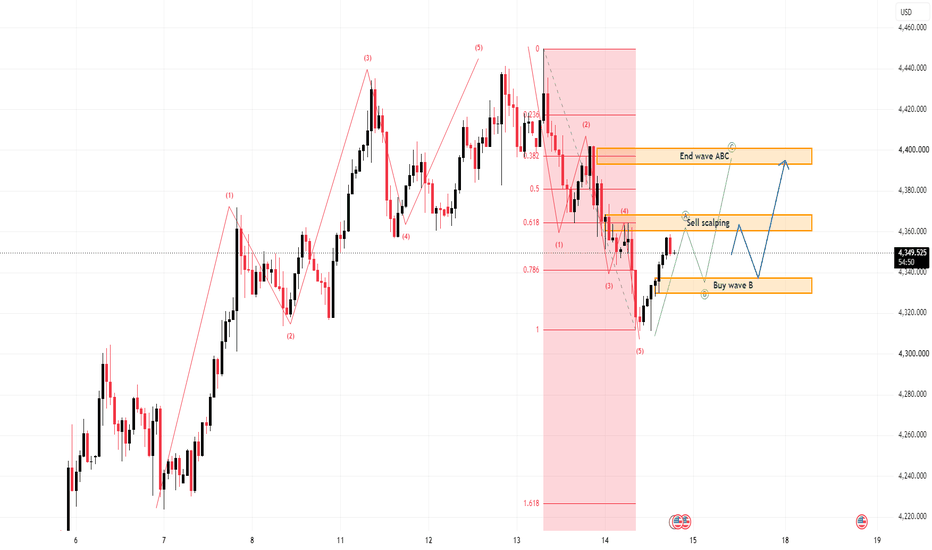
BITCOIN - A false breakout before a declineBINANCE:BTCUSDT.P closed within the 62,000–66,000 range. Liquidity zones have formed around the consolidation boundaries, but buyer weakness could potentially trigger a decline toward the areas of interest
There is no fundamental support in the market, while the geopolitical backdrop is exerting excessive pressure.
Technically, Bitcoin remains stagnant and trapped inside a sideways range that is developing within the broader global bearish trend. Simply put, the market is consolidating.
The reaction to support is weakening. However, before the decline continues, market makers may trigger a short squeeze toward the 65K resistance level. The area of interest is the liquidity zone around 62,300
Resistance levels: 64,500, 65,400
Support levels: 62,300, 61,900
A false breakout of the nearest resistance zone could shift the balance of power in favor of sellers and trigger a breakout from the triangle, potentially followed by downward distribution toward 62,000
Best regards,
R. Linda  Short
Short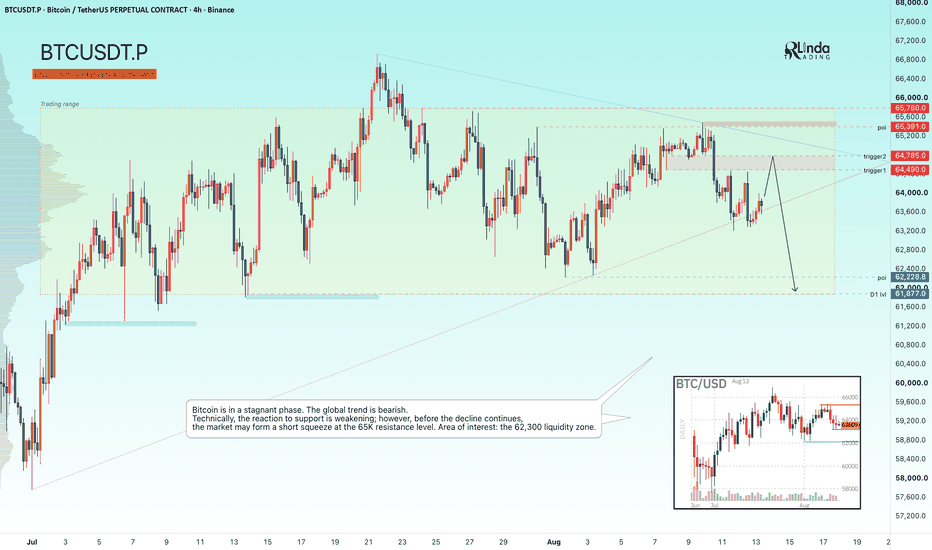
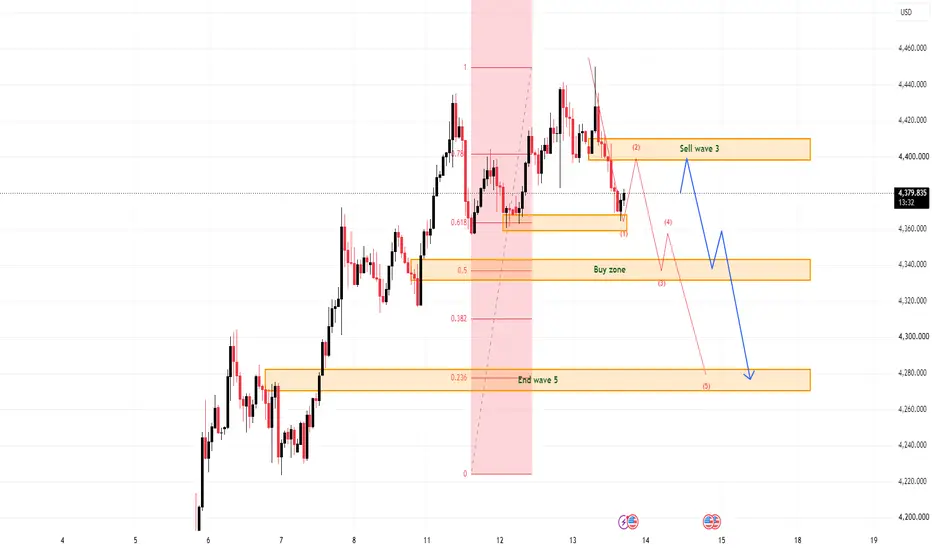
XAUUSD: Bearish Elliott Setup Below 4,410
Gold is showing signs of short-term weakness after failing to extend cleanly above the upper reaction area. From Kelly’s view, the current chart suggests that XAUUSD may be forming a bearish Elliott structure, with price now preparing for a possible continuation lower if the Sell wave 3 zone continues to hold.
The key idea is simple: gold may still rebound slightly, but the structure favours downside continuation while price remains below resistance.
⟡ Market structure
The chart shows gold reacted strongly from the previous bullish move, but buyers are now losing momentum near the 4,380–4,400 area. Price is currently trading around 4,380, directly under the marked Sell wave 3 zone.
This area is important because it may act as the next bearish reaction point. If gold retests 4,395–4,410 and sellers defend that zone, the market may continue lower towards the 4,330–4,345 buy zone first.
If bearish pressure expands, the next deeper target is around 4,270–4,285, where the chart marks the possible End wave 5 area.
➤ Key levels
◌ 4,395–4,410: Sell wave 3 zone and main resistance
◌ 4,380: current price reaction area
◌ 4,360–4,365: short-term support / first bearish checkpoint
◌ 4,330–4,345: buy zone and wave 3 target area
◌ 4,270–4,285: End wave 5 target zone
◌ Above 4,420: area where the bearish setup starts to weaken
⌁ Elliott Wave view
From an Elliott Wave perspective, gold may be starting a new bearish 5-wave sequence after the recent bullish recovery slowed down.
Wave 1 may be forming from the current rejection area.
Wave 2 may create a small rebound back into the 4,395–4,410 sell zone.
Wave 3 could then push price lower towards the 4,330–4,345 buy zone.
Wave 4 may create a short corrective rebound from that support.
Wave 5 may continue towards 4,270–4,285 if sellers keep control.
This is why Kelly is not treating the current rebound as a strong bullish continuation yet. The market is still below a key resistance zone, and the Elliott structure is leaning bearish.
▸ Trading scenario
Preferred scenario: wait for gold to retest the Sell wave 3 zone and show bearish confirmation.
Sell zone: 4,395–4,410 if rejection appears
Stop loss: above the confirmed rejection high or above 4,420
Take profit 1: 4,360
Take profit 2: 4,330–4,345
Take profit 3: 4,270–4,285
Alternative scenario: if gold breaks above 4,420 and holds strongly, the bearish Elliott setup weakens. In that case, price may continue a larger bullish recovery before a new sell structure becomes clear.
⌁ Kelly’s view
For Kelly, gold is now in a bearish reaction structure. The current price is below the main sell zone, and the next clean setup is to wait for rejection before following the downside wave.
Gold may still bounce first.
But if 4,395–4,410 holds as resistance, the next Elliott move may continue lower towards 4,330 and 4,280.
Share your view below.
Short 
The Bulls Remain in Control After the News.XAUUSD Technical Analysis – H4
Price is maintaining a strong bullish structure after breaking out of the consolidation zone and moving above key Fibonacci levels. The market is currently approaching a major supply zone, so a potential retest/correction is highly likely.
Key Resistance & Support Levels
🔵 Major Resistance: 4,500–4,515 → Strong supply zone, also aligned with Fibonacci 2.618 at approximately 4,512.
🔵 Near-term Resistance: 4,360–4,380 → Key zone to hold if price enters a correction.
🟢 Key Support: 4,295–4,320 → Breakout zone + Fibonacci 1.618 around 4,317, making this an important demand area.
* H4 Trend: Bullish, as long as price remains above 4,295–4,320.
Bullish Scenario
If price retests 4,360–4,380 and holds this zone, followed by a breakout above the recent high, the next targets will be 4,450, followed by 4,500–4,515.
Correction Scenario
If price loses 4,360, it could move back toward 4,295–4,320. This is a key support zone for evaluating whether the bullish trend can continue.
Bearish Risk Scenario
A clear H4 candle close below 4,295 would weaken the short-term bullish structure and increase the risk of a deeper correction.
⸻
TRADING PLAN
🟢 BUY GOLD
* Entry: 4,361–4,363
* Stop Loss: 4,351
* Take Profit: 200 / 500 / 1000 pips
🔴 SELL GOLD
* Entry: 4,512–4,514
* Stop Loss: 4,524
* Take Profit: 200 / 500 / 1000 pips Long 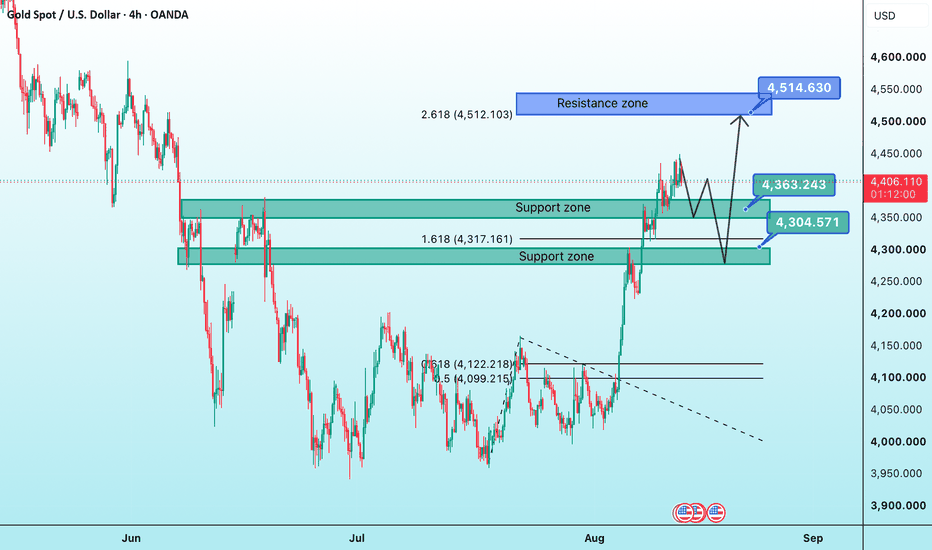
 Long
Long
Part 2: The Breakout That Was Never Meant to ContinueHow Some Breakouts Exist Mainly to Trap Traders
A breakout looks exciting because it gives traders the feeling that something important has changed.
Price was stuck below resistance, and suddenly it moves above it.
Many traders see this and immediately think, “The resistance is broken. Price is going higher.”
But not every breakout is real.
Sometimes price breaks the level, attracts buyers, and then quickly reverses.
This is known as a false breakout.
1. What is a false breakout?
A false breakout happens when price moves above an important resistance level but cannot stay there.
For example:
A stock has been struggling around **$500** for several days.
Every time it reaches $500, sellers appear and push it lower.
Then one day, price suddenly moves to $510.
Traders see the move and start buying.
But instead of continuing higher, price falls back below $500.
The breakout has failed.
2. Why do traders get trapped?
Because the first move looks convincing.
When price crosses resistance, traders often believe that the market has finally changed.
They may buy because:
- Resistance has been broken.
- The chart looks bullish.
- They expect a bigger move.
- They do not want to miss the opportunity.
The problem starts when price cannot hold above the breakout level.
Now these traders are sitting in a position that is moving against them.
3. The breakout attracts buyers
This is what makes a false breakout dangerous.
The market may move just far enough above resistance to make traders believe the breakout is real.
For example, resistance is at **$500**.
Price moves to $505, then $510.
A trader sees this and enters at $510.
But instead of moving toward $520 or $530, price starts falling.
Suddenly, the trader who entered at $510 is trapped.
4. The old resistance becomes important again
One of the clearest signs of a failed breakout is when price comes back below the old resistance.
If $500 was resistance and price breaks above it, traders expect $500 to become support.
But if price falls back below $500, that is a warning.
It tells us that buyers were not strong enough to hold the breakout.
The market tried to move higher but failed.
5. Stop-losses can make the fall faster
Many breakout traders place their stop-loss just below the old resistance.
Suppose the breakout happens at $500.
A trader buys at $505 and places a stop-loss around $495.
If price falls back below $500, more traders may start exiting.
Once their stop-losses are triggered, additional selling can enter the market.
This can make the reversal much faster.
6. A failed breakout can move strongly in the opposite direction
This is one of the most interesting parts.
A normal rejection is one thing.
But when many traders have bought the breakout and then suddenly realize they are wrong, they may all try to exit around the same time.
That can create strong selling pressure.
So a failed breakout can sometimes produce a sharper fall than the original rejection.
7. Do not assume every breakout is a trap
This is equally important.
Not every breakout is designed to trap traders.
Many breakouts are genuine.
The point is not to become afraid of breakouts.
The point is to understand that **crossing a resistance level is not enough**.
You need to see whether price can actually hold above it.
8. What does a healthy breakout look like?
A stronger breakout usually shows acceptance above the old resistance.
For example:
Price breaks $500.
It moves to $505.
Then $510.
It pulls back slightly but remains above $500.
Buyers step in again.
Price starts moving higher.
This tells us that the market is accepting prices above the old resistance.
9. What does a weak breakout look like?
A weak breakout often has different behaviour.
Price breaks $500.
It moves to $505 or $510.
Then buyers stop pushing.
Price starts falling.
It comes back to $500.
Then it breaks below $500.
This is a warning that the breakout may have failed.
10. Watch the reaction, not just the breakout
This is one of the most important lessons.
Do not focus only on the moment price crosses resistance.
Watch what happens afterward.
Ask:
Can buyers keep price above the level?
If yes, the breakout becomes more convincing.
If no, the breakout becomes suspicious.
The reaction after the breakout often tells you more than the breakout itself.
11. Volume can give extra information
Volume can also help.
A breakout with strong volume can show that many traders are participating.
A breakout with very low volume may deserve more caution.
But volume alone does not prove that a breakout is real.
Even high-volume breakouts can fail.
Always look at the price behaviour along with volume.
12. Fear of missing out creates many bad entries
One reason traders get trapped is FOMO.
They see price breaking resistance and think:
“If I don't buy now, I will miss the move.”
So they enter immediately.
But the market does not care whether you entered or not.
Sometimes waiting for confirmation gives you a much better picture.
If the breakout is genuine, price can continue higher.
If it is false, waiting may keep you out of the trap.
13. The simple way to think about it
When price breaks resistance, do not immediately ask:
“Should I buy?”
First ask:
“Can price stay above this level?”
That one question can change the way you look at breakouts.
A breakout that holds can become a real move.
A breakout that quickly fails can become a trap.
14. The key takeaway
A breakout is not confirmed simply because price moves above resistance.
You need to see acceptance.
Watch whether price stays above the level.
Watch whether buyers continue to show strength.
Watch whether the old resistance turns into support.
And most importantly, watch what happens if price falls back below the level.
The first move gets your attention.
The reaction tells you whether the breakout was real.
By @BrightRally_Research Education 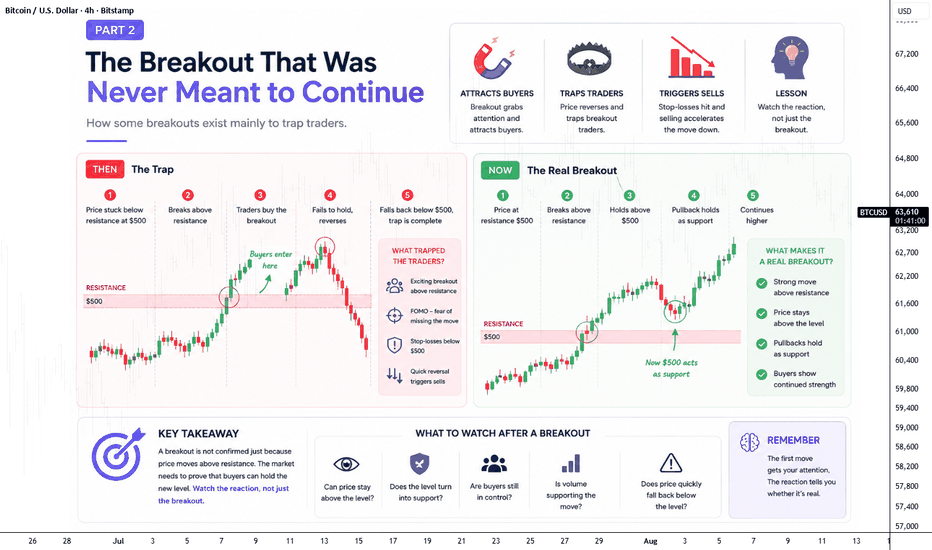
GOLD - The news could trigger a long squeezeICMARKETS:XAUUSD is consolidating within the 4355–4435 range, while the U.S. dollar remains largely stagnant ahead of the upcoming CPI data. Until the release, the market may remain trapped inside the current range while preparing for a potential liquidity manipulation
The U.S. Dollar Index is also consolidating as traders wait for the CPI report. Gold has stalled ahead of this key inflation data, and the initial reaction to CPI could be short-lived as geopolitical risks remain elevated.
A weaker-than-expected CPI could open the door to new highs, while hotter inflation data could trigger a corrective move. The market is waiting for a clear catalyst.
Bullish drivers: Weaker CPI, A weaker U.S. dollar, Lower expectations for further rate hikes, Geopolitical de-escalation
Bearish drivers: Hotter-than-expected CPI, Hawkish Fed rhetoric, A stronger U.S. dollar, Geopolitical escalation
Gold remains in a bullish phase, but news-driven volatility could create a liquidity sweep / long squeeze before the next directional move
Resistance levels: 4435, 4481
Support levels: 4356, 4313, 4302
Gold remains in a bullish phase. However, news-driven volatility could create a liquidity sweep / long squeeze before the next continuation move.
The key zones to watch are 4350 and 4313. A false breakdown of either level, followed by consolidation back above it, could become the technical catalyst for another bullish impulse.
Best regards,
R. Linda Long 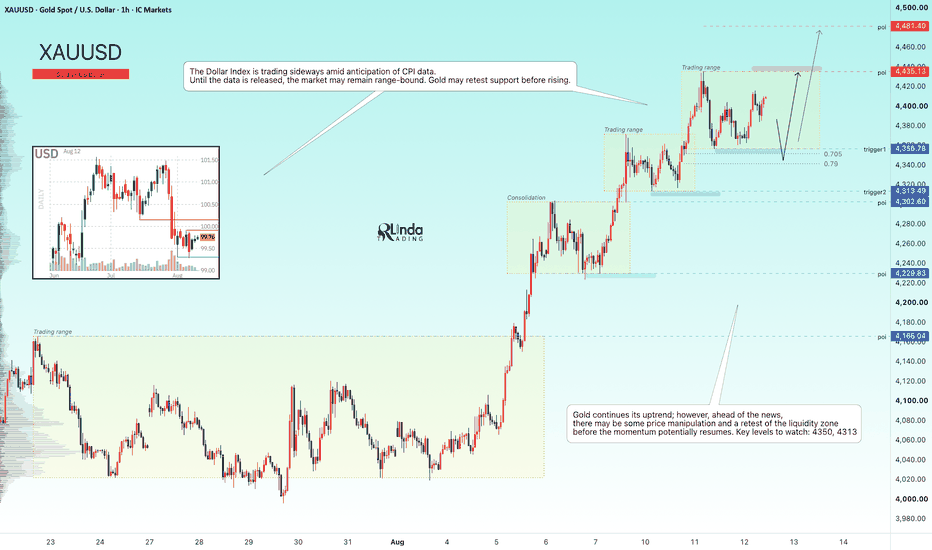
XAUUSD 1H — Market Structure & Liquidity AnalysisAnalysis:
Gold is currently maintaining a bullish market structure, with a clear BOS followed by strong upside displacement. Price has also respected the ascending trendline, keeping the short-term structure constructive.
The chart highlights two important 1H FVG + OB zones:
Upper zone: around 4,350–4,380 — immediate area to monitor for a potential retracement and reaction.
Lower zone: around 4,260–4,285 — deeper structural support if the first zone fails.
Above price, the 4H order-block/supply area around 4,430–4,480 represents a major higher-timeframe reaction zone.
Possible Scenario 🔎
If price retraces into the upper 1H FVG + OB, a bullish reaction could support another move toward the higher-timeframe resistance area.
A deeper retracement into the lower 1H FVG + OB would still keep the broader bullish structure intact, provided the key structure continues to hold.
However, rejection from the 4H OB followed by a clear bearish market-structure shift could indicate a larger corrective move.
Key takeaway:
The market remains structurally bullish, but price is approaching a significant higher-timeframe supply area. Rather than chasing the current move, observing how price reacts around the marked FVG/OB zones may provide better confirmation.
⚠️ Educational purpose only. This is a technical market-structure study, not financial advice. No trade entry or guaranteed outcome is being suggested. Always manage risk independently. Long 
Expecting a Pullback in Gold Prices.XAUUSD Technical Analysis – H1
Price is currently under corrective pressure after being strongly rejected from the 4,400–4,410 resistance zone. The ascending trendline is still holding, but the short-term market structure is showing signs of weakening.
Key Resistance & Support Levels
🔵 Major Resistance: 4,400–4,410 → Strong supply zone. A confirmed breakout with an H1 candle close above this area is required for the bullish trend to continue.
🔵 Intermediate Resistance: 4,375–4,380.
🟡 Key Pivot: 4,344–4,345 → A break below this zone could trigger a rapid increase in selling pressure.
🟢 Major Support: 4,310–4,320 → Demand zone + ascending trendline, making this a key area to monitor for a potential price reaction.
Trading Scenarios
📈 Bullish Scenario: If price holds the 4,310–4,320 support zone and reclaims 4,345, a recovery toward 4,375, followed by 4,400–4,410, becomes possible. A decisive breakout above 4,410 would open the way for further upside.
📉 Bearish Scenario: If an H1 candle closes below 4,310, the short-term bullish structure would be invalidated, increasing the probability of a deeper correction.
⸻
TRADING PLAN
🟢 BUY GOLD
* Entry: 4,318–4,320
* Stop Loss: 4,310
* Take Profit: 200 / 500 / 1000 pips
🔴 SELL GOLD
* Entry: 4,408–4,410
* Stop Loss: 4,420
* Take Profit: 200 / 500 / 1000 pips
Risk Management
* Risk no more than 1–2% of your account equity per trade.
* Wait for confirmation before entering a position.
* Consider moving the Stop Loss to breakeven once the trade reaches a reasonable profit level. Short 
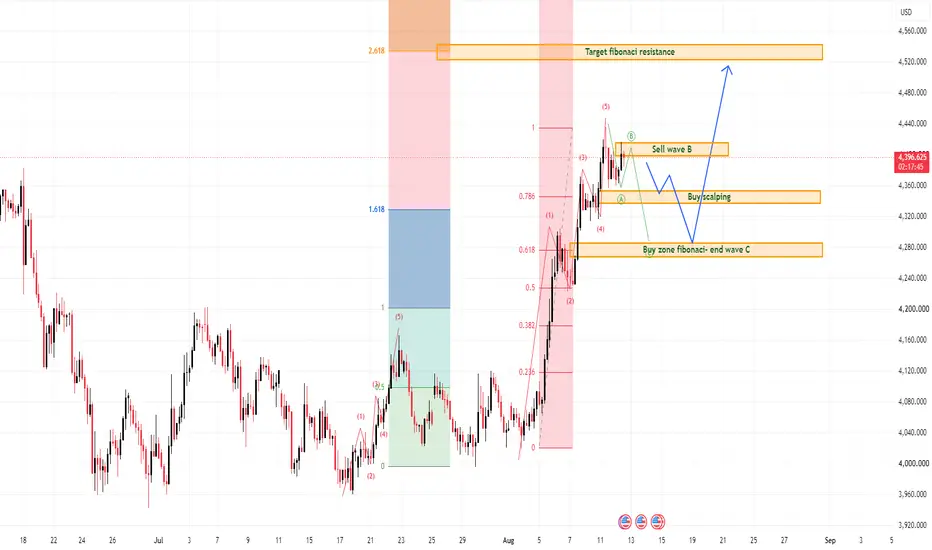
XAUUSD: Bullish Trend Still Holds Above 4,280
Gold is still holding a strong bullish structure after the sharp recovery from the lower accumulation base. From Kelly’s view, the current chart suggests that XAUUSD may be moving through a short-term ABC correction before continuing higher towards the Fibonacci resistance target.
The key idea is simple: gold remains bullish overall, but price may need a healthy pullback before the next upside wave becomes cleaner.
⟡ Market structure
The chart shows gold made a strong impulsive move from the lower area and reached the 4,390–4,430 region. After that, price started to slow down near the Sell wave B zone, which is normal after a strong rally.
Current price is trading around 4,394. This area is close to short-term resistance, so Kelly would not chase buys directly here. A controlled correction into support would create a better setup.
The first reaction zone is around 4,340–4,360, marked as the Buy scalping area. If the correction becomes deeper, the stronger support is around 4,270–4,290, where the chart marks the Fibonacci buy zone and possible end of wave C.
➤ Key levels
◌ 4,390–4,410: Sell wave B / current resistance reaction area
◌ 4,340–4,360: Buy scalping zone
◌ 4,270–4,290: Fibonacci buy zone / possible end wave C
◌ 4,520–4,540: Fibonacci 2.618 target resistance
◌ Below 4,270: area where the bullish setup starts to weaken
◌ Above 4,410: stronger bullish continuation confirmation
⌁ Elliott Wave view
From an Elliott Wave perspective, gold appears to have completed a strong bullish impulse and may now be forming a corrective ABC structure.
Wave A may be the first pullback from the recent high.
Wave B is reacting near the 4,390–4,410 resistance area.
Wave C may still pull price lower towards 4,340–4,360 or deeper into 4,270–4,290.
If wave C ends inside the Fibonacci buy zone and buyers defend it, gold may continue into the next bullish wave towards the 4,520–4,540 Fibonacci resistance target.
▸ Trading scenario
Preferred scenario: wait for gold to correct into support and show bullish confirmation.
Entry zone 1: 4,340–4,360 if bullish reaction appears
Entry zone 2: 4,270–4,290 if deeper ABC correction happens
Stop loss: below the confirmed wave C low or below 4,250
Take profit 1: 4,410
Take profit 2: 4,450
Take profit 3: 4,520–4,540
Alternative scenario: if gold breaks below 4,270 with strong bearish pressure, the bullish ABC setup weakens. In that case, price may need more time to rebuild support before the next upward continuation.
⌁ Kelly’s view
For Kelly, the main trend is still bullish, but the market is now near a resistance zone after a strong rally. The better plan is patience.
If gold corrects into 4,340–4,360 or 4,270–4,290 and buyers defend the zone, the next bullish wave may continue towards the Fibonacci 2.618 target.
Gold remains in a bullish structure.
A clean ABC pullback may prepare the next move higher.
Share your view below.
Long 
BTCUSD 1H Market Outlook | Key Order Block RejectionBitcoin is currently trading near a significant 1H Order Block and resistance zone, where price is testing an area that previously attracted selling pressure. The overall structure remains bullish in the short term, but the current location suggests that a reaction from this supply area is possible.
The highlighted scenario illustrates a potential rejection from the Order Block, followed by a move toward lower liquidity and support levels. This outlook remains conditional and requires confirmation through price action. If buyers establish a strong close above the resistance zone, the bearish scenario may be invalidated and price could continue higher.
Key Levels
Resistance / Order Block: 64,900 – 65,450
Current Price Area: Around 64,550
Support Zones: 63,990 → 63,260 → 62,290
Trading Plan
Wait for confirmation before entering any trade.
Watch for market structure shifts, rejection candles, or liquidity sweeps around the highlighted Order Block.
Avoid entering in the middle of consolidation.
Always use a predefined stop-loss and proper risk management.
High-impact economic events and crypto-related news may increase volatility.
Disclaimer: This analysis is for educational purposes only and reflects a possible market scenario based on price action. It is not financial advice or a guarantee of future market performance. Short 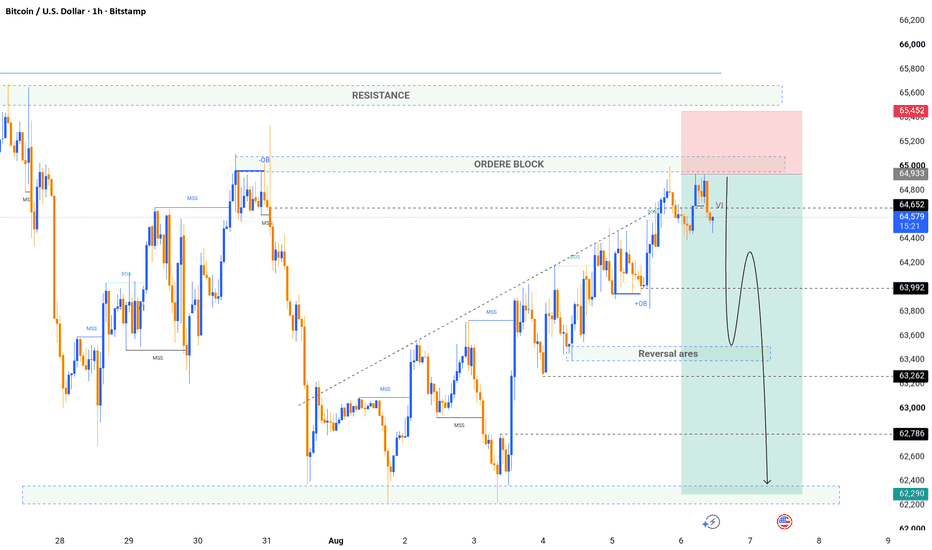
 Short
Short
 Long
Long
BTCUSD | Bullish Continuation After Trendline Break
Price has broken above the descending trendline after forming a bullish Change of Character (CHoCH), signaling a shift in short-term momentum. The recent rally has reclaimed key structure, and price is now consolidating beneath a nearby resistance/liquidity zone.
The highlighted resistance remains the primary decision area. A successful breakout and acceptance above this level could expose the next liquidity target near the previous Weak High. However, if price fails to hold the recent breakout structure, a pullback into the highlighted demand zone may occur before buyers attempt another move higher.
Key Levels
Support: Previous breakout structure and highlighted demand zone around 64,000.
Resistance: 64,900–65,000 supply/liquidity zone.
Bullish Scenario: A confirmed close above resistance could continue the move toward the weak high around 66,700.
Bearish Scenario: Rejection from resistance may lead to a retracement into support before the next directional move.
Invalidation: A confirmed close below the highlighted demand zone would weaken the current bullish outlook.
Technical Confluences
Descending trendline breakout
Bullish CHoCH and BOS
Smart Money Concepts (SMC)
Liquidity and weak high target
Price action confirmation
This analysis is based on market structure, liquidity, and Smart Money Concepts. It outlines possible scenarios rather than predicting a guaranteed outcome. Always wait for confirmation before entering a trade.
Disclaimer: This analysis is for educational purposes only and should not be considered financial or investment advice. Always conduct your own analysis and use appropriate risk management. Long 
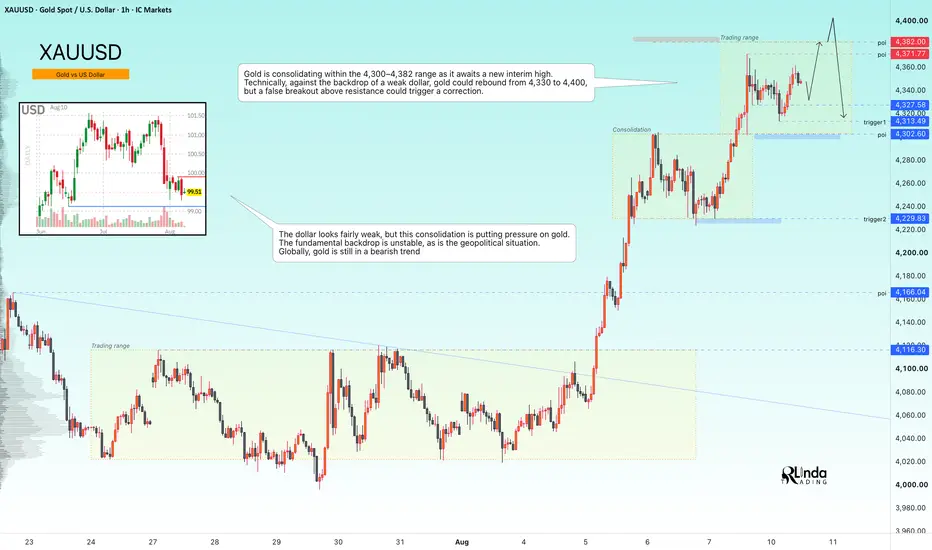
GOLD - Retest of 4400. Waiting for a false breakout ICMARKETS:XAUUSD is showing local bullish momentum, but price is approaching a major resistance zone at 4382–4400. At the same time, the U.S. dollar remains weak, although its current consolidation continues to create pressure across the markets
The fundamental backdrop remains unstable. Geopolitical risks continue to support the dollar, while expectations for further Fed rate hikes have weakened. Against this mixed backdrop, gold remains within a broader bearish trend.
Gold is consolidating inside the 4300–4382 range while preparing for a potential retest of the recent high. Technically, continued dollar weakness could allow gold to rebound from 4330 toward 4400. However, profit-taking around 4380–4400, followed by a false breakout, could trigger a reversal.
Bullish drivers: Weaker-than-expected inflation data, Continued U.S. dollar weakness, Lower rate expectations
Bearish drivers: U.S. dollar strengthening, Rising oil prices and inflation expectations, Profit-taking ahead of the CPI report
Resistance levels: 4371, 4382, 4400
Support levels: 4327, 4313, 4302
A short squeeze through the resistance zone followed by a bearish reversal pattern could trigger a pullback or even reverse the current local bullish momentum.
However, an unexpected fundamental catalyst or a sustained close above 4400 could invalidate the bearish setup and open the way toward 4450–4475.
Best regards,
R. Linda Short 
Gold Analysis: Smart Money Accumulation After Liquidity HuntGold is currently showing signs of a potential bullish recovery after a prolonged bearish move. Price formed a strong liquidity sweep near the weak low area, followed by a Change of Character (CHoCH), indicating a possible shift from bearish momentum toward bullish structure.
Demand Zone & Bullish Scenario
Price is holding above the marked demand zone around 4,040–4,083. As long as this zone remains protected, buyers have the opportunity to regain control. A confirmed Break of Structure (BOS) above nearby resistance levels will strengthen the bullish continuation setup.
Upside Targets
If price continues to respect the demand zone and breaks resistance with confirmation:
Target 1: 4,430 area (first liquidity objective)
Target 2: 4,651 area (major resistance/liquidity level)
Target 3: 4,850–4,900 area (strong high liquidity zone)
Invalidation Scenario
A strong breakdown below the 4,040 support level will invalidate the bullish setup. A move below this area may trigger another liquidity hunt toward lower levels before any potential reversal.
SMC Perspective
The current structure suggests:
Liquidity sweep completed near the lows
CHoCH confirmed on the lower structure
Price reacting from demand zone
Next confirmation required: BOS above resistance
The key level to watch is the 4,040 demand area. Holding this zone keeps the bullish scenario valid; losing it shifts the bias back toward bearish continuation. Long 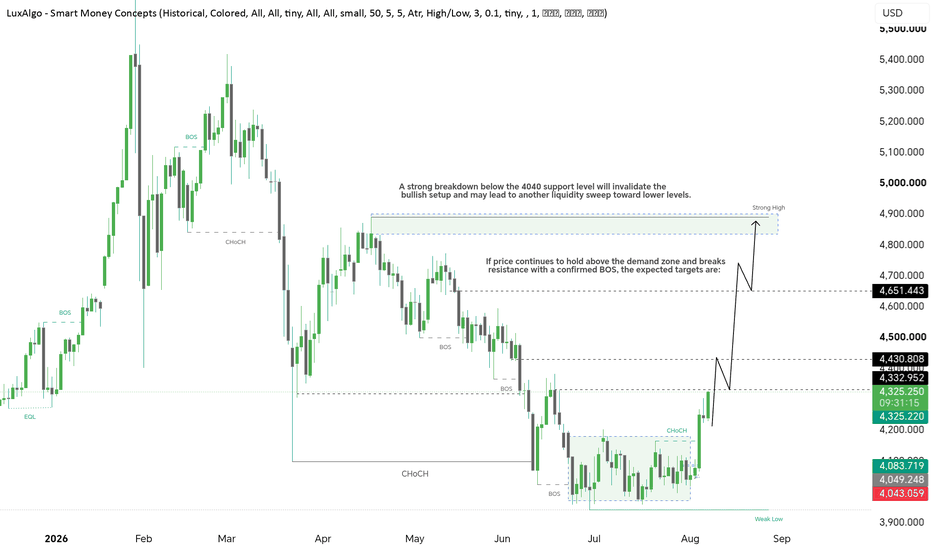
 Long
Long
XAUUSD: Bullish Wave 5 Targets HigherGold is showing a clear bullish recovery after breaking away from the lower accumulation base. From Kelly’s view, the current structure suggests that XAUUSD is no longer only moving sideways; buyers are trying to build a larger Elliott Wave continuation towards the upper Fibonacci target.
The key idea is simple: gold remains bullish, but after a strong push, the better setup is to wait for a controlled pullback before following the next upside wave.
⟡ Market structure
The chart shows gold previously traded under a strong downtrend structure, but the latest recovery has changed the short-term rhythm. Price has pushed above the lower base and is now reacting around 4,341, close to the first important resistance area.
This area is important because price may pause here after a strong impulse move. A pullback from this zone would not automatically break the bullish view. Instead, it may form wave 4 before the market prepares for another upward move.
The main buy zone to watch is 4,180–4,198. If gold corrects into this area and buyers defend it, the next bullish leg may continue towards the higher Fibonacci target zone around 4,520–4,560, where the chart marks the possible end of wave 5.
➤ Key levels
◌ 4,180–4,198: main buy zone and possible wave 4 support
◌ 4,341: current price reaction area
◌ 4,380–4,400: near resistance and breakout checkpoint
◌ 4,520–4,560: target end wave 5 / Fibonacci extension zone
◌ Below 4,180: area where the bullish setup starts to weaken
◌ Below 4,100: deeper invalidation area for the current wave count
⌁ Elliott Wave view
From an Elliott Wave perspective, gold appears to be forming a bullish 5-wave structure after the previous bearish cycle slowed down near the lower base.
Wave 1 created the first strong recovery move.
Wave 2 corrected but held above the structure base.
Wave 3 is now pushing price into the 4,340 resistance region.
Wave 4 may form as a healthy correction back into 4,180–4,198.
If this buy zone holds, wave 5 may continue towards the 4,520–4,560 Fibonacci target area.
This is why Kelly would not chase gold directly after the strong rise. The structure is bullish, but the cleaner entry usually comes after the market retests support and confirms buyers are still active.
▸ Trading scenario
Preferred scenario: wait for gold to correct into the buy zone and show bullish confirmation.
Entry zone: 4,180–4,198 if bullish confirmation appears
Stop loss: below the confirmed wave 4 low or below 4,150
Take profit 1: 4,341–4,380
Take profit 2: 4,400
Take profit 3: 4,520–4,560
Alternative scenario: if gold breaks below 4,180 with strong bearish pressure, the bullish wave 5 setup becomes weaker. In that case, price may need to rebuild a deeper support base before the next bullish continuation becomes reliable.
⌁ Kelly’s view
For Kelly, the main structure is still bullish. Gold has already shown strong buying pressure, and the current move looks like part of a larger Elliott Wave recovery.
The cleanest plan is to wait for the pullback. If 4,180–4,198 holds, gold may continue the next bullish wave towards the upper Fibonacci target.
Gold is in a bullish continuation phase.
If the buy zone holds, wave 5 may extend higher.
Share your view below.
Long 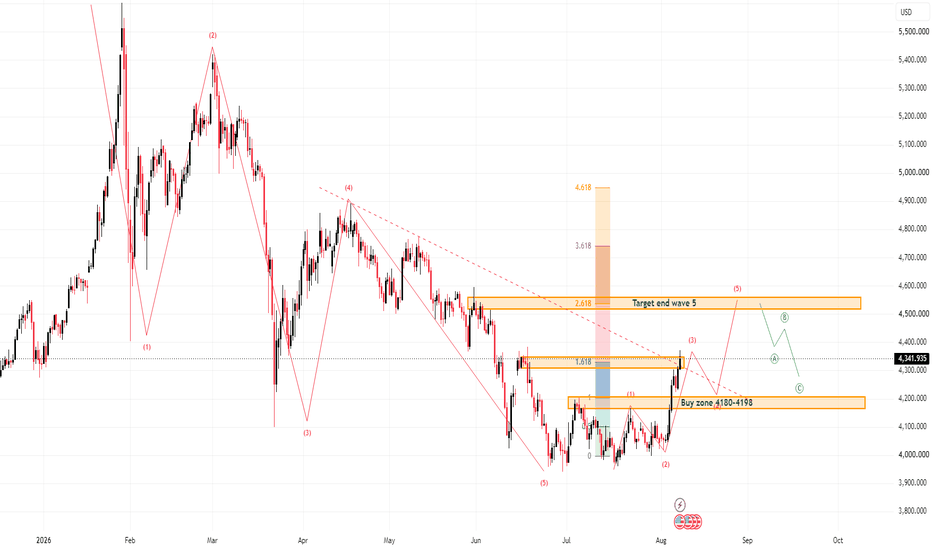
XAUUSD: Bullish Continuation Above 4,285
Gold is still showing strong bullish momentum after breaking away from the previous consolidation structure. From Kelly’s view, the market is now building a clearer Elliott Wave recovery, and the current setup suggests that price may continue higher if the pullback holds above the 4,285–4,300 buy zone.
The key idea is simple: gold is bullish, but the better plan is to wait for a healthy correction before following the next upside wave.
⟡ Market structure
The chart shows gold has made a strong recovery from the lower base and is now trading around 4,315. The latest impulse pushed price into a higher structure, confirming that buyers are still active.
The nearest support is the 4,285–4,300 buy zone. This area is important because it may become the base for the next bullish continuation. If price pulls back into this zone and buyers defend it, gold may continue towards the 4,327 and 4,380 resistance levels.
The next major resistance sits around 4,409–4,421. If gold breaks above this zone with strong momentum, the larger Elliott Wave target near 4,640–4,670 may become the next area to watch.
➤ Key levels
◌ 4,285–4,300: main buy zone and wave support
◌ 4,315: current price reaction area
◌ 4,327: first resistance checkpoint
◌ 4,380: key resistance zone
◌ 4,409–4,421: major sell zone / breakout decision area
◌ 4,640–4,670: possible Elliott wave 5 completion zone
◌ Below 4,240: area where the bullish setup starts to weaken
⌁ Elliott Wave view
From an Elliott Wave perspective, gold appears to be developing a bullish continuation sequence after a strong recovery phase.
Wave 1 created the first push from the lower structure.
Wave 2 corrected but held above the base.
Wave 3 may now be developing towards the 4,380–4,421 resistance area.
Wave 4 may later create a short pullback around resistance.
If momentum remains strong, wave 5 may extend towards the upper Fibonacci target near 4,640–4,670.
This is why Kelly is not looking to sell too early. The structure still favours the buyers unless price loses the key support zone.
▸ Trading scenario
Preferred scenario: wait for gold to pull back into the buy zone and show bullish confirmation.
Entry zone: 4,285–4,300 if bullish confirmation appears
Stop loss: below the confirmed pullback low or below 4,240
Take profit 1: 4,327
Take profit 2: 4,380
Take profit 3: 4,409–4,421
Take profit 4: 4,640–4,670 if wave 5 extends strongly
Alternative scenario: if gold breaks below 4,240 with strong bearish pressure, the bullish Elliott setup weakens. In that case, price may need to build a new support base before the next continuation becomes reliable.
⌁ Kelly’s view
For Kelly, gold remains in a bullish continuation structure. The market has already shown strong buying pressure, but after such a sharp move, a pullback into support would make the next buy setup cleaner.
The main zone to watch is 4,285–4,300. If buyers protect this area, gold may continue higher towards 4,380 first, then the larger resistance near 4,409–4,421.
Gold is still showing bullish strength.
If the buy zone holds, the next Elliott wave may continue higher.
Share your view below.
Long 
GOLD - Local bullish sentiment. NFP coming upFollowing a strong rally, ICMARKETS:XAUUSD has entered a consolidation phase, signaling the potential for further upside if buyers can successfully defend the 4300 level.
The U.S. Dollar Index has broken its bullish structure, although the broader fundamental backdrop remains mixed. Geopolitical uncertainty persists, while the Federal Reserve continues to maintain a hawkish stance.
After the recent advance, gold is consolidating and building a liquidity pool around the 4242–4229 zone, which market makers may test before another move higher. There is also a possibility that this could become gold's strongest weekly performance since January.
The next major catalyst will be the U.S. Non-Farm Payrolls (NFP) report. A weaker-than-expected labor market reading could fuel another rally, while stronger data may restore downside pressure. Market participants will also continue to monitor developments in the Middle East and U.S.–Iran negotiations.
Bullish drivers: Weaker-than-expected NFP, A weaker U.S. dollar, Lower interest rate expectations, Progress in geopolitical negotiations
Bearish drivers: Strong NFP data, Hawkish Federal Reserve rhetoric, A stronger U.S. dollar, Escalation of geopolitical tensions
Resistance levels: 4300, 4330, 4370
Support levels: 4242, 4229, 4200
From a technical perspective (setting aside the unpredictability of news events), gold still has room to extend its rally.
Two primary scenarios:
A long squeeze into the 4242–4229 support zone could restore bullish momentum.
A breakout and sustained close above 4300 could also become the technical catalyst for another leg higher.
Best regards,
R. Linda Long