 Long
LongWolfe Wave
Long
WTI Crude Oil – Bullish Wolfe Wave Reversal SetupThe chart shows a potential bullish Wolfe Wave formation, with point (5) developing near the 100.5–101.0 support zone. A sustained hold around this area could trigger a reversal, with the first important confirmation coming from a break above the descending Wolfe Wave resistance line. The marked level around 101.94 is an important short-term trend-reversal zone; trading above this level could strengthen the bullish scenario toward 104–106. The setup remains invalid if price breaks decisively below the point (5) support zone and fails to recover. Overall, this is a potential reversal setup where confirmation above the marked resistance is important before the projected upside move.
Idea Rating: 8.5/10
Disclaimer: This is a technical-analysis idea for educational purposes only and is not financial or investment advice. The projected direction and targets are possible scenarios, not guaranteed outcomes. Please do your own analysis and use appropriate risk management before making any trading decision.
 Long
Long
WTI Crude Oil – Triple Top / Bearish Wolfe Wave Setup - Updated.
The updated chart shows a potential triple-top formation near the 105.0–105.5 zone, with price testing the same resistance area for the third time.
The setup is valid only while price remains around the current resistance levels; a decisive move to a new higher high would invalidate the triple-top structure and the bearish Wolfe Wave scenario. If price gets rejected from this zone, the immediate focus would be on the rising support line around 101–102, followed by the Wolfe Wave projected target near 98–99.
The confluence of the triple top and Wolfe Wave structure makes the current level an important decision zone. Confirmation of weakness through a break of the rising support would strengthen the bearish case.
Idea Rating: 8.5/10
Disclaimer: This is a technical-analysis idea for educational purposes only and is not financial or investment advice. The pattern and projected targets are possible scenarios, not guaranteed outcomes. A new higher high would invalidate this setup. Please do your own analysis and use appropriate risk management before making any trading decision.
Short
WOLF | The time to go long has come- Timeframe: Weekly
- Trade type: Buy stop order
- Price: 27.65
- Take Profit: Open
- Stop Loss: 23.37 (-15.50 %)
Idea: Long on a breakout above last week's high - bullish momentum continuation.
Entry: Buy stop above last week’s high.
Stop-loss: Below the low of the same candle.
If the weekly candle closes below this level, the trade is invalidated.
Take Profit: Trailing stop following the lows of new weekly candles.
 Long
Long
WTI Crude Oil – 30-Minute Wolfe Wave SetupThe chart shows a developing bearish Wolfe Wave, with price approaching point (5) around the 103.5–104.0 zone. If point (5) holds as a rejection area, the pattern suggests a potential decline toward the projected Wolfe Wave target around 98.0–98.5. The setup would gain strength if price breaks below the immediate 101.0 support with follow-through, confirming bearish momentum. A sustained move above point (5) would weaken the pattern and could invalidate the projected downside move. Overall, the setup has a good structural alignment, but confirmation from price action is important before considering the target.
Idea Rating: 8.5/10
Disclaimer: This is a technical-analysis idea for educational purposes only and is not financial or investment advice. The projected path and target are possible scenarios, not guaranteed outcomes. Please do your own analysis and use appropriate risk management before making any trading decision.
Short
TradingView Idea – WTI Crude Oil - 1 hourWTI appears to have completed a **5-wave impulsive advance**, with Wave (5) topping near **$95.5**, followed by a rejection. The current decline from Wave (5) suggests that a corrective phase may now be developing, with the rising lower trendline around **$92–92.5** acting as the first important support. A decisive break below this trendline would strengthen the bearish setup and could open the way toward **$90**, followed by the **$87–86** zone near the projected Wolfe Wave line. The structure also suggests that the previous Wave (5) high could represent an important intermediate-term top unless price quickly reclaims **$95.5–96**. For the bearish scenario to remain valid, price should continue forming lower highs after the Wave (5) rejection. A sustained move back above the Wave (5) high would invalidate the immediate bearish interpretation and indicate that the bullish trend may still be extending.
Idea Rating: 8.5/10 ⭐ — The wave structure, rejection from Wave (5), and trendline confluence provide a reasonably strong setup, although confirmation from a clean support breakdown is still important.
**Disclaimer:** This analysis is for educational purposes only and is not financial advice. Trading and investing involve substantial risk. Please conduct your own analysis and risk assessment or consult a qualified financial professional before making any trading or investment decisions.
Short
15 mins Crude Oil – Bearish Wolfe Wave SetupThe chart shows a potential **bearish Wolfe Wave**, with **Point 5 forming around $93.2–$93.5**, close to the upper Wolfe Wave boundary. The price action at Point 5 suggests a possible exhaustion/rejection zone after the preceding upward move. If the reversal confirms, the projected path indicates a decline toward the **$86.5–$87.0 area**, where the extended Wolfe Wave line provides a potential target zone. The rising lower trendline around **$91–$92** is an important intermediate support; a decisive break below it would strengthen the bearish scenario. Conversely, a sustained move above **$93.5–$94.0** would weaken or invalidate the setup.
**Idea Rating: 8.5/10** — Clear five-wave structure, strong Point-5 resistance and a well-defined projected target.
**Disclaimer:** This is a technical-analysis-based scenario for educational and informational purposes only and **not investment advice or a recommendation to buy or sell**. Wolfe Wave patterns are probabilistic, and the projected target is not guaranteed. Please wait for price confirmation and use appropriate risk management before taking any trading decision.
Short
15 mins. Gold – Bullish Wolfe Wave SetupGold appears to be developing a bullish Wolfe Wave, with Point 5 forming around 4,380–4,400** near the lower Wolfe Wave support line. The current structure suggests a potential reversal from this Point-5 area, with the projected path targeting the 4,520–4,550 zone, where multiple trendlines provide confluence. The key confirmation would be a sustained move above the nearby 4,420–4,440 resistance area, which would strengthen the bullish reversal scenario. A decisive break below the Point-5/support region would weaken or invalidate the setup and could open the door to further downside. Overall, the pattern has a **clear structure with a well-defined invalidation area and attractive upside potential**.
Idea Rating: 8.5/10
Disclaimer: This is a technical-analysis-based scenario for educational and informational purposes only and **not investment advice or a recommendation to buy or sell**. Wolfe Wave patterns are probabilistic, and the projected target may not be achieved. Please wait for appropriate price confirmation and use proper risk management before taking any trading decision.
 Long
Long
Crude Oil – Bearish Wolfe Wave Setup - 2 hour timeThe chart shows a developing **bearish Wolfe Wave**, with price appearing to complete **Point 5 around $94–95**, near the upper Wolfe structure resistance. From this area, the projected path indicates a potential reversal toward the **Wolfe Wave target near $79–80**, which also aligns with the broader descending reference line. The recent rejection from Point 5 and the move back toward the rising lower trendline are important signals; a decisive break of this support could accelerate the downside. However, price sustaining above the Point-5 high would weaken the setup and could invalidate the bearish projection. Overall, the pattern has a **clear structure and attractive projected risk/reward**, but confirmation of the reversal remains important.
Idea Rating: 8.5/10
Disclaimer:This is a technical-analysis-based scenario for educational purposes only and not investment advice or a recommendation to buy or sell**. Wolfe Wave patterns are probabilistic and the projected target is not guaranteed. Please wait for price confirmation and apply appropriate risk management before taking any trading decision.
Short
Crude Oil – Bearish Wolfe Wave Setup - 2 hours time frameThe chart appears to be forming a **bearish Wolfe Wave**, with price completing/approaching **Point 5 near the 8,700–8,900 zone**, which is also close to the upper trendline resistance. The marked **false breakout** above the upper structure adds confluence to the bearish reversal thesis if price fails to sustain above this area. From Point 5, the projected path suggests a corrective decline through **Points 1–4**, followed by a potential **Point 5 / Wolfe Wave target around 6,800–7,000**. The descending Wolfe Wave line provides an additional reference for the projected target and could act as a magnet if selling momentum accelerates. A sustained move above the Point-5 region would invalidate or significantly weaken this bearish setup, so confirmation through price action is important. Overall, the chart offers a **well-defined bearish risk/reward structure**, but the projected target is ambitious and should not be treated as a certainty.
Idea Rating: 8.5/10 — Good pattern structure, clear Point-5 resistance and defined invalidation, with strong confluence from the Wolfe Wave target line.
Disclaimer: This analysis is based solely on the chart structure and is provided for educational and informational purposes only**. It is **not investment advice or a recommendation to buy or sell**. Wolfe Wave projections are probabilistic, not guaranteed; please wait for confirmation and use appropriate risk management before taking any trading position.
Short
## Crude Oil – Wolfe Wave Pattern Formation**My rating: 7.5/10 — reasonably strong bearish Wolfe Wave setup, but confirmation is still pending.**
### Pattern structure
* **Point 1:** ~83.0
* **Point 2:** ~80.0
* **Point 3:** ~84.0
* **Point 4:** ~81.0
* **Point 5:** ~84.6–84.9 — currently appears to be forming/just completed
structure broadly satisfies a **bearish Wolfe Wave**, with the key **1–4 trendline acting as the resistance/convergence line**.
### Expected path
If Point 5 is confirmed, the bearish sequence could be:
**84.0–84.5 → 80.5 → corrective bounce near 81.5 → final decline toward 79.0–79.5**
The dotted **1–4 line / Wolfe target line** around **79–79.5** is the important potential destination.
### Important confirmation
I would consider the pattern **activated only if crude decisively rejects the 84.5–85.0 area and breaks the immediate short-term support around 83.5/83.3**.
* **Above 85.0–85.2:** Wolfe setup becomes weak/possibly invalid.
* **Below 83.3:** bearish probability increases significantly.
* **Below 82.5:** pattern has stronger confirmation toward the lower Wolfe target.
**Overall:** The geometry is good and Point 5 is in the correct zone, but since Point 5 needs clear rejection, I rate it **7.5/10 rather than 9/10**. The key is **84.5–85.0 resistance**.
Disclaimer: This is a technical analysis of the attached chart for educational purposes only and is not financial advice. Wolfe-wave/trendline/divergence setups can fail, and the stated levels should be treated as technical reference points rather than guaranteed targets. Always use independent confirmation and appropriate risk management.
Short
Can Wolfspeed Power the Next Tech Revolution?Fiscal Fourth Quarter Earnings Forecast
Wolfspeed approaches its fiscal fourth quarter earnings call under intense market scrutiny. Wall Street projects a net loss of $2.45 per share on $150 million in revenue. This outcome follows a third-quarter loss of $3.26 per share on $150.2 million in revenue. Investors closely track cash burn metrics and gross margin performance across core business units. Wide bandgap semiconductor adoption accelerates rapidly across major global industries.
Silicon Carbide Innovation and Intellectual Property Lawsuits
Wolfspeed launched its fifth-generation silicon carbide MOSFET platform to boost system efficiency. The platform delivers up to 27% efficiency gains over competing 1200V market solutions. Engineers optimized specific on-resistance across a compact 5x5 mm die footprint. The 1200V chip delivers 3.4 mΩ-cm² specific on-resistance at 175°C. The 750V chip node achieves 2.0 mΩ-cm² under identical operating conditions. Continuous junction limits reach 200°C to elevate overall power system durability. These performance gains allow engineers to design smaller electric vehicle inverters.
To protect its core R&D investments, Wolfspeed filed a high-stakes patent infringement lawsuit against Navitas Semiconductor. The lawsuit targets Navitas in the U.S. District Court for the District of Delaware. Wolfspeed asserts five foundational patents protecting silicon carbide and gallium nitride architectures. Asserted claims cover U.S. Patent 8,169,005 and U.S. Patent 10,998,418. The lawsuit also asserts U.S. Patent 10,886,396, U.S. Patent 10,749,443, and U.S. Patent 11,888,392. Legal action targets Navitas GaNFast, GaNSlim, GaNSafe, and GeneSiC product lines. Chief Executive Officer Robert Feurle stated that defending R&D investments remains a vital priority. Intellectual property protection secures Wolfspeed’s technological lead against unauthorized cloning.
* Gen 5 1200V MOSFET: Delivers 3.4 mΩ-cm² specific on-resistance at 175°C with 27% higher efficiency. Reduces EV inverter size and battery costs.
* Gen 5 750V MOSFET: Achieves 2.0 mΩ-cm² specific on-resistance at 175°C. Enables solid-state circuit breakers and fast EV chargers.
* U.S. Patent 8,169,005: Covers foundational wide-bandgap compound semiconductor structures. Restricts unauthorized market sales.
* U.S. Patent 10,998,418: Covers substrate integration and field-effect transistor designs. Protects proprietary power device architecture.
* U.S. Patent 11,888,392: Protects high-voltage power switching and module packaging. Preserves pricing power across module markets.
Geopolitics and Domestic Supply Chain Sovereignty
The U.S. Department of Energy classifies silicon carbide as a critical strategic material. Concentrated foreign manufacturing exposes Western supply chains to severe geopolitical disruptions. Federal authorities actively support domestic semiconductor production. The U.S. Department of Commerce signed a non-binding agreement for $750 million in CHIPS Act funding. This award supports the John Palmour Center in Siler City, North Carolina. Funding also accelerates expansion at the Marcy facility in upstate New York. Domestic wafer fabrication strengthens national security and secures Western supply chains.
Macroeconomic Dynamics and Financial Capital Structures
High interest rates increase capital expenses for capital-intensive semiconductor foundries. Constructing 200mm wafer fabrication plants requires several billions in upfront investment. Wolfspeed structured a capital plan to navigate macroeconomic volatility. An investment group led by Apollo Global Management provided $750 million in private debt financing. Wolfspeed also expects $1 billion in Section 48D tax credit cash refunds. Combined capital sources provide access to $2.5 billion in total liquidity. This cash liquidity buffers operations during cyclical economic slowdowns.
* Federal CHIPS Grant: Direct $750 million funding accelerates domestic 200mm crystal growth and wafering.
* Apollo Private Financing: Senior debt facility of $750 million provides operational liquidity for equipment scaling.
* Section 48D Tax Credits: Estimated $1.0 billion cash refunds offset qualified domestic capital expenditure expenses.
* Mohawk Valley Fab: Marcy, New York facility operates as the premier 200mm power device plant.
* John Palmour Center: Siler City, North Carolina facility expands 200mm silicon carbide materials output tenfold.
Industry Trends and AI Infrastructure Partnerships
Hyperscale artificial intelligence infrastructure demands unprecedented electrical power capacity. Data center power architectures are shifting toward 800 VDC direct power distribution. Wolfspeed partnered with LITEON Technology to deploy silicon carbide devices in 800 VDC sidecars. This deployment upgrades compute rack power supply units for hyperscale cloud operators. Lower thermal dissipation reduces cooling costs and total cost of ownership. Wolfspeed also collaborates with GE Aerospace on high-voltage defense components. These strategic partnerships expand commercial revenues beyond automotive traction markets.
Business Model Innovation and Sustainable Science
Wolfspeed operates a pure-play, vertically integrated wide bandgap manufacturing model. The company leads an industry transition from 150mm wafers to automated 200mm platforms. Wide bandgap physics enables higher electric breakdown fields and superior thermal conductivity. The automated Mohawk Valley Fab produces high-volume 200mm power devices with high yield. Siler City crystal growth supplies materials directly to the Marcy fab for processing. Corporate strategy targets operational sustainability across all facilities. The company aims to reduce operational emissions by 50% by 2030.
Executive Leadership and Strategic Governance
Corporate management strengthens operational execution and financial communications. Chief Executive Officer Robert Feurle guides commercial scaling across automotive and AI markets. Chief Financial Officer Gregor van Issum oversees financial discipline and capital allocation. Management appointed Daniel Whalen as Vice President of Investor Relations. Whalen brings 25 years of capital markets expertise from Qorvo and equity research. Executive Andy W. Mattes joined the Board of Directors to enhance governance. Disciplined leadership protects investor capital and maximizes manufacturing output.
Cybersecurity Hardware Integrity and Pharmaceutical Applications
Stable physical power hardware reinforces digital cybersecurity infrastructure across critical data centers. Uninterrupted power delivery protects cloud server clusters during intense cyber defense operations. Consistent 800 VDC systems prevent server downtime and voltage fluctuations. In healthcare, wide bandgap semiconductors drive specialized medical equipment. High-precision power switching enhances image resolution in magnetic resonance imaging systems. Stable power modules also drive automated synthesis units inside biopharmaceutical factories. Wide bandgap reliability elevates performance across vital technological sectors.
Strategic Synthesis and Long-Term Value Creation
Wolfspeed balances short-term factory construction costs against long-term industry dominance. Capital expenditures on 200mm manufacturing facilities compress earnings performance today. However, technical leadership and federal CHIPS funding build durable competitive moats. Patent infringement litigation protects core research investments and pricing power. Scaling automated 200mm fabrication plants will reduce unit production costs over time. Surging AI data center energy demand offers clear multi-year commercial growth. Wolfspeed remains well positioned to power next-generation global technology markets.
Long
BLong

es1! retests 5kes1! appears poised for a larger move down, based on the smaller timeframe count .
this leads me to believe that es1! has entered a larger fourth wave. historically, these waves take an average of 2 months to play out and typically result in a 12% decrease from the high before completing.
wave 4's often retrace back into the territory of the prior degree's wave 4, and i expect this one to follow suit.
pay attention to the green trendline i've drawn on the chart,,, it serves as a solid guide for where i anticipate es1! to find a bottom. dipping below the trendline is acceptable, provided we don't see any weekly candle closes beneath it. even if a weekly candle does close below, a strong recovery the following week, such as a gap-up scenario , could invalidate the breakdown.
there’s not much else to add here, as the chart is fairly straightforward. keep an eye on the trendline and monitor weekly closes for confirmation.
💸


NIFTY 50 – Medium-Term Technical Analysis (1D Chart)## Key Levels
* **Resistance:** 24,650–24,800
* **Bullish Invalidation:** Daily close above 24,800–24,900
* **Immediate Support:** 24,100
* **Major Support:** 23,500
* **Medium-Term Target:** 22,800–22,000 (if the bearish scenario confirms)
---
## Overall Rating
| Indicator | Rating |
| ---------------------------- | :--------: |
| Wolfe Wave Structure | ⭐⭐⭐⭐☆ |
| Trendline Analysis | ⭐⭐⭐⭐⭐ |
| Swing Analysis | ⭐⭐⭐⭐☆ |
| Elliott Wave Projection | ⭐⭐⭐⭐☆ |
| Overall Technical Confidence | **8.8/10** |
### Conclusion
The chart shows Nifty approaching a **high-confluence resistance zone** where a bearish Wolfe Wave may complete. A rejection from **24,700–24,800** followed by a break of nearby swing support would strengthen the case for a medium-term corrective phase toward **23,500** and potentially **22,800–22,000**. However, if Nifty achieves a convincing breakout and sustains above **24,800**, this bearish setup would lose validity and the market could transition into a renewed bullish trend.
> **Disclaimer:** This analysis is based solely on technical chart patterns, including Wolfe Wave, Elliott Wave concepts, trendlines, and price action. It is provided for educational purposes only and should not be considered financial or investment advice. Markets can invalidate technical patterns at any time. Always use appropriate risk management and independent confirmation before making trading or investment decisions.
 Short
Short
# GOLD (XAU/USD) – 15-Minute Technical Analysis# GOLD (XAU/USD) – 15-Minute Technical Analysis
1. Gold is trading at a **critical inflection point**, where the price has completed a five-wave bullish advance (magenta structure) and is now testing the upper boundary of the rising trendline.
2. The rally has stalled near **4085–4090**, which acts as a strong resistance zone. This area coincides with the upper trendline and the completion of the impulsive bullish leg.
3. Price is now showing signs of rejection from this resistance, suggesting that buyers are losing momentum and a corrective phase may be starting.
4. The green ascending trendline is the most important support on the chart. As long as Gold remains above this trendline, the broader bullish structure remains intact.
5. A decisive **break below the ascending trendline** would confirm the beginning of a fresh bearish impulsive sequence. Your projected red Elliott Wave path (1-2-3-4-5) illustrates this potential downside scenario.
6. The first downside objective is the recent swing low near **4035–4040**. Failure to hold this support would expose **4000**, followed by **3970**, which aligns with the descending long-term trendline.
7. The larger blue descending trendline continues to act as a long-term dynamic resistance. Unless Gold breaks above this broader trendline, medium-term rallies should still be treated as corrective rather than the start of a sustained uptrend.
8. For the bearish scenario to remain valid, Gold should continue making **lower highs below 4085–4090**. Any sustained move above this resistance would invalidate the immediate bearish count.
9. From a risk-to-reward perspective, traders should wait for **confirmation of a trendline breakdown** before expecting the projected impulsive decline. Entering before confirmation increases the probability of a false breakdown.
10. **Overall Outlook:** The chart currently favors a **short-term bearish correction**. A confirmed break below the rising trendline would likely accelerate selling toward **4035 → 4000 → 3970**, while only a breakout above **4085–4090** would invalidate this bearish outlook and restore bullish momentum.
---
## Key Technical Levels
* **Immediate Resistance:** 4085–4090
* **Bullish Invalidation:** Sustained close above 4090
* **Trendline Support:** Rising green trendline
* **Immediate Support:** 4035–4040
* **Downside Targets:** 4000 → 3970
* **Overall Bias:** Short-term Bearish, Medium-term Neutral until the larger descending trendline is broken.
---
## Pattern Confidence Rating
| Parameter | Rating |
| ----------------------- | :---------------: |
| Swing Structure | ⭐⭐⭐⭐⭐ (5/5) |
| Trendline Accuracy | ⭐⭐⭐⭐☆ (4.5/5) |
| Elliott Wave Projection | ⭐⭐⭐⭐☆ (4/5) |
| Risk-to-Reward | ⭐⭐⭐⭐⭐ (5/5) |
| Overall Reliability | **⭐⭐⭐⭐☆ (4.4/5)** |
### Disclaimer
> **Disclaimer:** This analysis is based on technical chart patterns, Elliott Wave projections, trendline analysis, and price action. It is intended **solely for educational and informational purposes** and **should not be considered financial or investment advice**. Financial markets are inherently volatile, and no technical analysis can guarantee future price movements. Always conduct your own research, use proper risk management, and consult a qualified financial advisor before making any trading or investment decisions.
Short
# GOLD (XAU/USD) – 30-Minute Technical Analysis# GOLD (XAU/USD) – 30-Minute Technical Analysis
1. Gold appears to be completing a **Bullish Wolfe Wave** pattern, with Points **1-2-3-4-5** clearly marked on the chart. Point **5** is projected near the lower converging trendline, which is the ideal reversal area in a Wolfe Wave setup.
2. The current decline toward **Point 5 (around 4020–4030)** represents a crucial support zone. If buyers defend this level, it could become the launching point for the next impulsive rally.
3. The green descending trendline acts as the primary dynamic resistance. A breakout above this trendline would be the first confirmation that the bearish correction has ended.
4. After the reversal from Point 5, the expected move is a five-swing bullish sequence (yellow projection), targeting the previous swing highs before advancing toward the **Wolfe Wave target line (EPA)** shown by the blue dashed line.
5. The first upside objective lies near **4065–4075**, followed by **4100–4110**, where the previous swing highs are likely to attract selling pressure.
6. If Gold successfully breaks above **4110**, the Wolfe Wave pattern would gain further confirmation, opening the door for a move toward the **4135–4140** target zone indicated by the Wolfe Wave line.
7. The projected Wave (4) retracement should ideally remain above the previous higher low. Holding this structure would maintain the bullish sequence of higher highs and higher lows.
8. The bullish scenario will weaken if Gold breaks decisively below **Point 5 (around 4020)**. Such a breakdown would invalidate the Wolfe Wave and suggest that the broader downtrend is still in control.
9. From a swing trading perspective, the current setup offers an attractive risk-to-reward ratio because the invalidation level is relatively close while the projected Wolfe Wave target is substantially higher.
10. **Overall Outlook:** The chart favors a **bullish reversal**, but confirmation is still required. A strong reaction from Point 5 followed by a breakout above the descending trendline would significantly increase the probability of Gold reaching the **4135–4140** Wolfe Wave target.
---
## Key Technical Levels
* **Critical Support (Point 5):** 4020–4030
* **Trendline Breakout:** Around 4060–4070
* **Major Resistance:** 4100–4110
* **Wolfe Wave Target (EPA):** 4135–4140
* **Overall Bias:** Bullish above Point 5; bearish if 4020 is decisively broken.
---
## Pattern Quality Rating
| Parameter | Rating |
| -------------------- | :---------------: |
| Wolfe Wave Structure | ⭐⭐⭐⭐⭐ (5/5) |
| Symmetry | ⭐⭐⭐⭐☆ (4/5) |
| Risk-to-Reward | ⭐⭐⭐⭐⭐ (5/5) |
| Confirmation Status | ⭐⭐⭐☆☆ (3/5) |
| Overall Reliability | **⭐⭐⭐⭐☆ (4.3/5)** |
**Why 4.3/5 instead of 5/5?**
* The geometric structure is strong, and the Wolfe Wave is well defined.
* However, **Point 5 has not yet been confirmed by a bullish reversal candle and trendline breakout**. Until that confirmation occurs, the setup remains a high-probability expectation rather than a confirmed bullish reversal.
---
### Disclaimer
> **Disclaimer:** This analysis is based on technical chart patterns, Wolfe Wave principles, trendline analysis, and price action. It is intended **solely for educational and informational purposes** and **should not be considered financial or investment advice**. Financial markets are inherently volatile, and no technical analysis can guarantee future price movements. Always conduct your own research and use appropriate risk management before making any trading or investment decisions.
Long
Accenture (ACN): Falling-Angel in the selloff ...[Accenture (ACN): Falling-Angel in the selloff — Navarro200 signals a bottom formation ...
NYSE:ACN
www.tradingview.com
Hello ❤TradingView Community😍
Accenture plc (NYSE: ACN) - On the weekly-chart.
This idea highlights the major, multi-year correction following the all-time high of $417.37 (Dec 2021) and focuses on the resulting Navarro200 harmonic pattern. The chart shows a clean, symmetrical M-pattern (X-A-B-C-D) with a distinct potential reversal zone near the current low.
A further price decline toward the key psychological level of $100 or a dip just below it must be factored in.
Potential PRZ/bottom range: $118–$135 (D-zone; marked on the chart as $118.15, current price range around $135)
Interpretation of the Navarro200
Pattern concept: Following a strong rally (X→A), a three-phase correction complex is being completed (A→B→C→D). The completion at D often results from the convergence of multiple Fibonacci projections/retracements. This exact overlap is present here—a classic sign of a potential trend reversal or, at the very least, an extended rebound phase.
Significance of 242.80 USD: This level acts as the pattern’s “central axis/neckline” and as a prominent retracement pivot. A sustained rise above this level would significantly strengthen the bullish scenario and open up room toward the higher retracement targets.
Possible bottom-forming-phase + key volume-levels (volume-profile) - monthly-chart
Following a correction of approximately 72%, the price has fallen into the PRZ and is showing initial signs of stabilization. For a valid bottom to form, I expect:
A sideways/accumulation phase spanning several monthly candles between approximately 118 and 155 USD.
A higher low above the D-zone (ideally >$125–130) as confirmation that sellers are running out of steam.
A monthly close above a nearby trigger zone—typically $155/$165—as the first structural signal.
A breakout above 242.80 USD would be the second, stronger confirmation that the market is shifting from “bottom” to “trend reversal” mode.
Potential Wolfe-Wave
From Elliott Wave's perspective
Scenarios
Bullish: Stabilization above 125–130 USD, breakout >155/165 USD, followed by a rally toward 200 and 232–243 USD. A breakout and hold above 242.80 USD opens the path to 268/302 USD.
Bearish/Invalidation: A monthly close below 118 USD negates the bottom hypothesis. In this case, psychological round numbers (100 USD) and lower historical zones come into focus.
Risk Management (for Swing/Position Traders)
Aggressive: Open a partial position in the D-zone (125–140 USD) with a tight stop-loss below 118 USD; add to the position upon confirmation (monthly close >155/165 USD).
Conservative: Wait to trade until the monthly close is above 165 USD or until 200 USD is regained; a second surge above 242.80 USD would confirm the trend.
Adjust position size to the monthly time frame; be mindful of event risks (earnings, macro, USD strength).
Conclusion
Accenture is showing a large Navarro200 pattern with clean convergence at the D-Zone around 118–135 USD. Such setups often mark the end of cyclical corrections. An extended bottoming phase is likely; clear bullish signals will only emerge with successive higher lows and monthly closes above 155/165 USD—and will be structurally confirmed above 242.80 USD. Until then, patience and disciplined risk management remain key.
As always, this is not investment advice. I am not personally invested.
I look forward to hearing your opinions and seeing your charts😍 — how are you trading this potential bottoming pattern in ACN ?
Have a good start to the week & successful trading decisions 💪
M_a_d_d_e_n ✌
NOTE: The above information represents my idea and is not an investment/trading recommendation! Without any guarantee & exclusion of liability!


XRP Backs CLARITY Act: 'A Vote Against It Is Anti-ConsumerThe CLARITY Act is entering its final stage in the Senate. Ripple is making a strong case for why lawmakers should pass it. With President Donald Trump set to meet senators at the White House on Thursday to discuss the bill, the crypto industry is hoping to get it across the finish line. They hope to succeed before Congress begins its August 7 recess.
For Ripple, the bill isn’t just another piece of legislation. Instead, it’s about finally bringing clear rules to the U.S. crypto market.
Ripple: “Don’t Repeat the Same Mistakes”
Ripple’s Chief Legal Officer Stuart Alderoty warned that rejecting the CLARITY Act would only keep the current regulatory confusion alive.
“A vote against the CLARITY Act is a vote to leave the same unregulated conditions in place to be exploited by bad actors,” he said. “We’ve seen this movie. Let’s not watch the sequel.”
After spending four years fighting the SEC over XRP, Ripple says the industry needs clear laws. Rather than regulation through enforcement, they want clarity.
Consumer Protection Is the Main Focus
Ripple’s Head of U.S. Public Policy, Lauren Belive, says voting against the bill is “anti-consumer.” She argues that the same regulatory gaps that allowed the FTX collapse still exist today, leaving investors without clear protections.
According to Belive, the CLARITY Act would fix this by clearly dividing oversight between the SEC and CFTC. It would also set clear compliance standards. In addition, it would give consumers confidence about who regulates digital assets.
“Good actors will always do the right thing, but consumers deserve a level playing field,” she said, adding that opposing the bill simply preserves the status quo that failed investors.
Also Read : Why the CLARITY Act Still Hasn’t Passed?
Coinbase Wants Rules Locked Into Law
Coinbase also threw its support behind the bill. Speaking recently, the exchange’s Chief Policy Officer said regulators have already started adopting sensible crypto policies. However, Congress now needs to make them permanent.
“The policy changes have already occurred. We simply want the law to catch up,” he said, adding that the company is “very confident” the legislation will eventually pass.
One Last Hurdle
The biggest obstacle remains the ethics provisions. Democrats want tighter restrictions on public officials’ crypto business interests before offering the votes needed to reach the 60-vote threshold.
Still, there are signs of progress. Senator Thom Tillis said negotiators are “close” to a deal. Meanwhile, Senator Cynthia Lummis hinted that a revised draft could arrive soon. With Trump now directly involved in the discussions, the next few days could decide whether the CLARITY Act finally becomes the regulatory framework the U.S. crypto industry has been waiting for.
 Short
Short
ETHEREUM [$ETH] ELLIOTT WAVE CRYPTO ANALYSIS WEEKLY TFEthereum: A High-Confluence Setup at a Multi-Year Decision Point
Ethereum has reached what I believe is one of the most important technical inflection points of this cycle.
My primary Elliott Wave count suggests that the market is completing a complex multi-year corrective structure rather than beginning a new secular bear market. The current decline is approaching a major confluence zone where long-term channel support, the 0.5-0.618 Fibonacci retracement, and structural price support converge.
Adding further weight to this scenario is the presence of a bullish Wolfe Wave. While Elliott Wave remains the foundation of this analysis, the Wolfe Wave provides an independent geometric framework that points toward a similar reversal area. When different methodologies arrive at the same conclusion, I tend to pay attention.
The key question now is whether the decline from the August 2025 high is corrective or impulsive.
My preferred interpretation is that it is impulsive, favouring one final capitulation into the highlighted support zone around the $700 region before the larger bullish sequence begins. This remains the primary count unless price action proves otherwise.
An alternative scenario still exists. Ethereum could continue developing a large triangle, eventually producing a third test of the $4,900 resistance area before completing the correction. While this remains technically valid, I currently assign it a lower probability, as the decline appears to possess impulsive characteristics rather than the overlapping structure typically associated with triangles.
Should the preferred count unfold, the completion of wave (b) would open the door to a powerful wave (c) advance.
As always with Elliott Wave, the final upside target cannot be defined with precision this early. A normal fifth wave could terminate near the 0.236 Fibonacci extension around $12,500, while an extended fifth wave—something far from unusual in cryptocurrencies—could continue toward the 0.618 extension, currently projected near $57,000. The long-term ascending channel provides the dynamic framework for these objectives, meaning the ultimate target will evolve as the trend develops.
For now, the focus is not on the final destination but on whether Ethereum can complete this correction within the highlighted support region. If that happens, the risk-to-reward profile could become exceptionally attractive for long-term investors.
As always, Elliott Wave analysis is a probabilistic framework rather than a prediction. This is my preferred count, supported by Fibonacci confluence, long-term channel geometry, and a bullish Wolfe Wave. If future price action invalidates this scenario, the alternative count will take precedence.
Not financial advice. Like and follow for more Elliott Wave and macro crypto analysis.
 Long
Long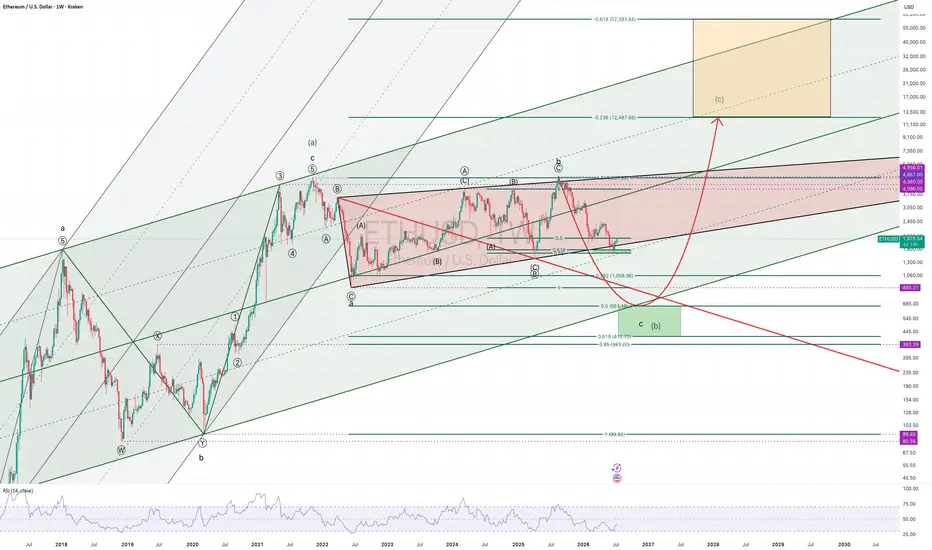
ALGO: A Wolfe-Wave Perspective#ALGO
#Algorand has been in a bearish downtrend since 2021. However, it appears that it has been forming a historical bullish Wolfe Wave, with a long-term target at the supply zone around $1.67.
Passing $0.14 provides a strong confirmation of a major trend reversal.
 Long
Long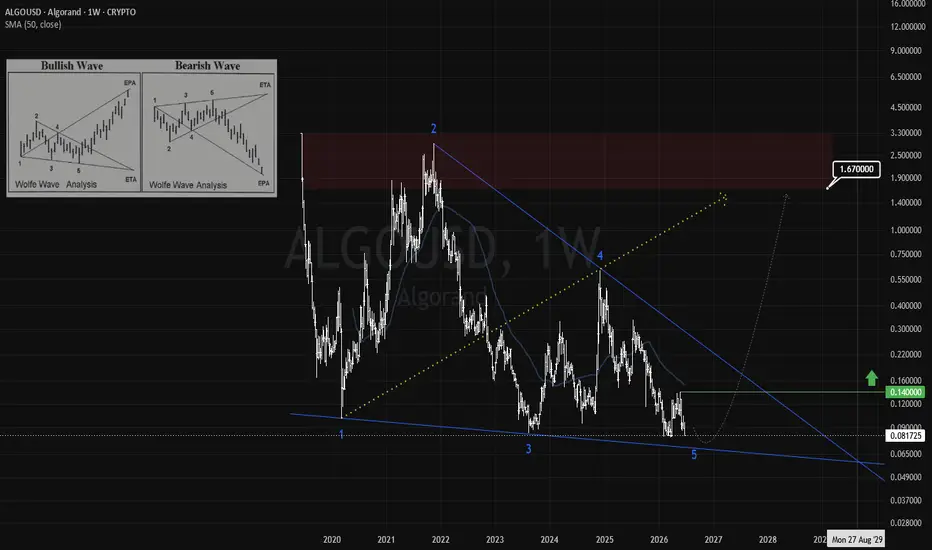
WOLF – Was at $80. Held the 50 SMA. SMH at Highs. WOLF – SMH At Highs. SOXL At Highs. This One Was $80. Now Testing $53. Catch-Up Play.
─────────────────────────────────
The semiconductor index is hitting highs and WOLF is one of the few names in the group that hasn't had its full run back. Stock was at $80 not long ago. Pulled back hard, held the 50 SMA, and is triggering a breakout at $53 right now. I'm in at $53 average with a stop at today's low.
This is a riskier name. When it moves it moves fast. That's exactly the point.
─────────────────────────────────
WHY WOLF IS IN THE RIGHT PLACE RIGHT NOW
─────────────────────────────────
Wolfspeed signed an MOU with GE Aerospace to supply 10 kilovolt silicon carbide MOSFET die and co-develop high-voltage SiC power module formats for industrial, AI, aerospace, and defense markets. That's not an EV play anymore. That's aerospace, defense, and AI data center power all in one partnership with one of the most credible industrial names in the world.
They just launched fifth-generation silicon carbide MOSFETs with up to 27% efficiency gains over competing 1,200 volt solutions on their 200 mm SiC platform. And separately, new 3.3 kilovolt SiC power module families are targeting AI data centers, grid-scale renewables, and solid-state transformers — and Wolfspeed is now building a dedicated data center solutions team and opening a Silicon Valley office to work directly with hyperscalers.
The AI data center power theme just showed up in this name. Same story driving ENPH, SEDG, and SMR — AI needs power and SiC is a core enabler of efficient power delivery at scale.
Short interest sits at 33.4% of the float with 2.9 days to cover. One positive catalyst — GE deal progress, an earnings beat, a hyperscaler design win announcement — and this name squeezes hard. That's the extra fuel behind momentum moves in WOLF.
THE CATCH-UP ANGLE
─────────────────────────────────
SMH hitting highs. SOXL hitting highs. The semiconductor group is as hot as it's been all year. WOLF was at $80 while all of this was happening and then got hit with a dilution filing that knocked it back into the $40s. That overhang created the pullback. The 50 SMA held. Now it's breaking back out at $53.
The broader recovery narrative — having climbed from a 52-week low of $0.39 — continues to attract momentum-oriented traders who view dips as buying opportunities. The dilution fear created the setup. The GE Aerospace deal and Gen5 platform are the fuel for the next leg.
─────────────────────────────────
TRADE PLAN
─────────────────────────────────
Entry: $53 average on the breakout
Stop: Low of day
Pattern: Breakout from 50 SMA test and grind
Upcoming catalyst: Q3 earnings call, July 1 product portfolio release
Short squeeze fuel: 33.4% of float short
─────────────────────────────────
THE RISK — AND IT'S SIGNIFICANT
─────────────────────────────────
Wolfspeed is burning cash hard. Gross margin is negative at -31%. Net loss is $1.6 billion on trailing revenue of $757 million. This company went through a delisting and restructuring process less than a year ago. It is now trading as Wolfspeed Inc. New. The fundamentals are shaky — this is pure momentum and story. The chart and the sector give you the setup. Respect the stop at today's low and do not oversize this one.
Long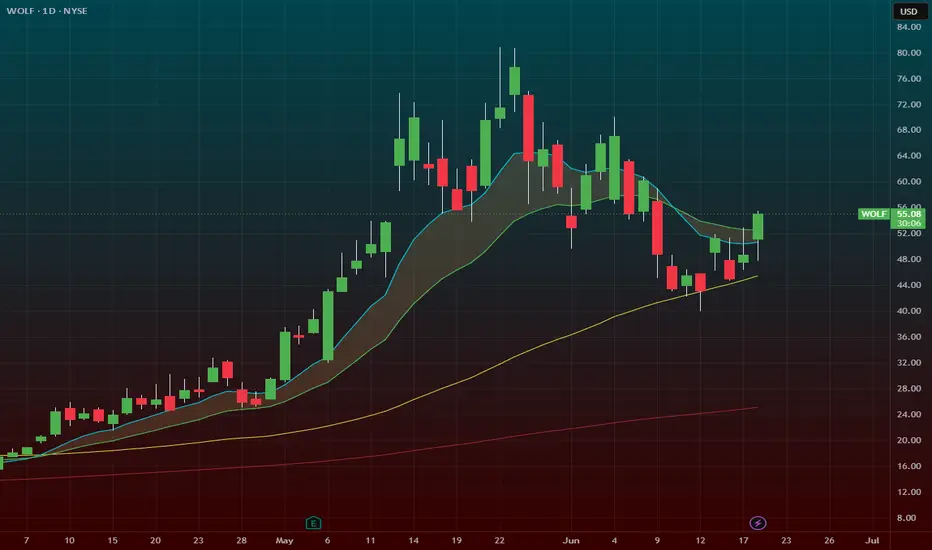
BTC Price Dive $35K Worst Case as Analyst Maps Levels for ETHBitcoin is at a pivotal moment. Analyst Gareth Soloway has identified $63,500 as the single most important level in the near term. Bitcoin rallied from its double bottom to $67,200 before pulling back to current levels. That pullback is normal and healthy. But the level being tested right now is exactly where the original breakout occurred, making it a critical support zone that bulls must defend.
If $63,500 holds, the next technical target is $70,000. If it breaks, the double bottom support weakens with each subsequent test and eventually gives way entirely.
The Macro Concern
Zooming out, Soloway identified a head and shoulders pattern on Bitcoin’s longer-term chart that produces a worst-case measured move target of approximately $35,000.
“I hope it doesn’t happen because I am going to be a buyer of Bitcoin once we get down to $50,000 and below,” Soloway said, adding that his accumulation plan runs from $50,000 down to $45,000, $40,000, and potentially $35,000 if the pattern fully plays out.
Ethereum, XRP, and Solana
Ethereum is holding a long-term ascending trend line that dates back to the 2022 lows, with the important level to watch around $1,690 to $1,700. This is the third test of that trend line.
XRP still needs to break and hold above $1.21 to confirm a breakout. It has pierced that level before and failed. A sustained move above it would be significant and until then XRP remains in a holding pattern waiting for a catalyst.
Solana is holding well above its own breakout level and Soloway remains long, expecting a move higher unless the breakout level breaks down.
Cardano, ZEC and XMR
Cardano is struggling to find footing, bouncing but then falling back into the same range. The critical level to hold is $0.165. A sustained hold there keeps the structure intact but momentum is weak.
For ZEC the key level is $460, which also represents a former resistance level that had flipped to support. Holding that zone keeps the recent move intact.
XMR is the most volatile of the group. Soloway identified $293 as the trend line that must hold to prevent a larger pattern from developing to the downside. The upside level worth watching is $428. A confirmed breakout above that level would produce what Soloway described as an explosive move higher.

