Fibonacci Swing Flip [MarkitTick]
More exclusive indicators from MarkitTick
Subscribe to MarkitTick for $43.75/month to get exclusive indicators by this author. You pay right on TradingView and can use them on your charts straight away.
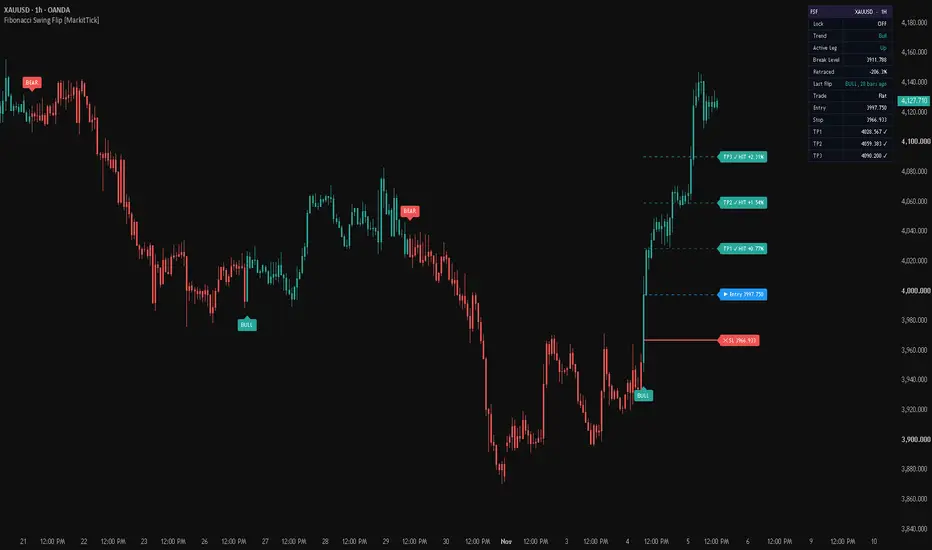
Explore MarkitTick💡 This indicator tracks the swing structure of price and flips the trend state when a closing price retraces beyond a chosen Fibonacci fraction of the active swing leg. It marks every flip with a BULL or BEAR label, colors the candles by the current trend, and can attach a volatility-scaled trade map with an entry, a stop and three targets.
✨ Originality and Utility
Most trend tools react to a smoothed price line or to a fixed percentage move. This script reads structure instead. It builds a clean alternating chain of swing highs and swing lows, treats the most recent leg in the trend direction as the reference, and asks one question on every closed bar: has price given back more of that leg than the selected retracement ratio allows?
The answer is a single, explainable rule. A rising leg is considered intact until a close falls below its break level, and a falling leg is considered intact until a close rises above its break level. Nothing else decides the flip.
What sets it apart from a plain swing or zigzag tool:
● Mashup justification
The script combines three ideas, and each one has a distinct job so that none is redundant:
The three parts never compute the same thing. Structure supplies the reference, the ratio supplies the invalidation rule, and the ATR supplies the distance. Removing any one of them would leave a gap that the other two cannot fill.
🔬 Methodology and Concepts
• Swing points
A swing high is a bar whose high is the highest of the Left Bars bars before it and the Right Bars bars after it. A swing low is the mirror image using lows. Both are found with the standard pivot calculation, using 10 bars on each side by default.
If a single bar qualifies as both a swing high and a swing low, that bar is ignored so the chain stays clean.
• Building the alternating chain
The script keeps the latest accepted swing and the one before it. The rules are:
The leg is the move between the two latest accepted swings. It points up when the latest swing is a high and down when the latest swing is a low.
• The first trend
No flip can occur before two swings exist. The first accepted leg sets the starting trend silently. The dashboard labels this state with the prefix Initial until the first real flip happens, and no BULL or BEAR marker is drawn for it.
• The break level
For an upward leg with high H and low L, the break level is H minus the ratio times (H minus L). For a downward leg it is L plus the ratio times (H minus L). With the default 38.2% ratio, a rising leg is broken once a close falls below the point where 38.2% of the leg has been given back.
• The flip rule
On each closed bar the close and the break level are both rounded to the symbol's minimum tick. If the active leg is up and the rounded close is below the rounded level, the trend flips to bear. If the active leg is down and the rounded close is above the rounded level, the trend flips to bull. A close that lands exactly on the level is not a break.
• Which leg is active
The active leg is always a leg in the direction of the current trend. While a counter-trend leg forms, the previous trend-direction leg stays active, and its break level is the line the counter-move has to cross. When a new leg appears in the trend direction, or the current one is extended, the active leg and its level are refreshed.
After a flip the indicator checks whether the latest leg already points in the new direction. If it does, that leg becomes active immediately. If it does not, the active leg is shown as None until a new leg in the new direction is accepted.
• Trade levels
When Enable Trade Levels is on, every flip opens a trade at the closing price of the flip bar:
Targets are reached when price touches them. The stop is reached when a bar closes beyond it. The trade ends at the stop or at TP3. By default 33% is closed at TP1, 33% at TP2 and the remainder at TP3.
• Standard charts only
Heikin Ashi, Renko, Kagi, Point and Figure, Range and Line Break charts display synthetic prices. On those chart types the script draws a red notice asking the trader to switch to regular candles, and it produces no flips.
🎨 Visual Guide
● Dashboard
The dashboard sits in the corner chosen in Dashboard Position. The header shows the short name FSF, the symbol and the timeframe. The rows are:
📖 How to Use
● Reading the trend
● Using the Retraced reading
● Choosing the ratio
● Using the swing settings
● Using the trade map
● Alerts
Eight alert conditions are available: BULL Signal, BEAR Signal, Close Long Signal, Close Short Signal, TP1 Hit, TP2 Hit, TP3 Hit and SL Hit. The script also sends a text payload through the alert function that contains the action word, the ticker, the timeframe, the direction, the entry price and, when trade levels are on, the stop and the three targets. Partial close payloads add the size to be closed. The action words are editable in the settings.
⚙️ Inputs and Settings
● Core Settings
● Trade Tools
● Visuals
● Dashboard
● Alerts
● Colors
Every color can be changed: Bull, Bear, Leg Line, Break Level, Swing Point, Label Text, Stop, Entry, TP1, TP2, TP3, Dashboard Header, Dashboard Background, Dashboard Text and Dashboard Warning.
● Notes on trade levels
The trade map is a planning tool. The stop is not moved after a target is reached, and results depend on costs, slippage and execution. Past results do not guarantee future performance.
🔍 Deconstruction of the Underlying Scientific and Academic Framework
• Swing points as local extrema
A swing high or low is a local extremum over a symmetric window. It is the point in a price series that is greater, or smaller, than every neighbor within a fixed number of bars on both sides. This is the same idea as the n-bar fractal used by many chart-pattern methods. The window length controls the scale of the structure that is detected.
• Trend as a sequence of swings
Classical trend analysis, associated with Dow Theory, describes an uptrend as a series of higher highs and higher lows, and a downtrend as lower highs and lower lows. A trend is considered intact while that sequence holds. This script formalizes the idea by tracking the chain of swings and declaring a change when a pullback becomes deeper than a defined fraction of the last leg.
• Fibonacci ratios
The ratios 23.6%, 38.2%, 61.8% and 78.6% come from the Fibonacci sequence. Dividing a term by the next term approaches about 0.618, dividing by the term two places ahead gives about 0.382, dividing by the term three places ahead gives about 0.236, and the square root of 0.618 gives about 0.786. The 50% option is not a Fibonacci ratio. It is offered because it is one of the most common retracement levels and is often tied to Dow Theory.
The ratios serve here as widely used reference points for how deep a pullback can go. The use of these levels in markets rests on convention and practitioner experience. This description makes no claim that they are statistically proven to predict reversals.
• Volatility scaling with the Average True Range
The Average True Range, introduced by J. Welles Wilder, smooths the true range of each bar with Wilder's moving average. The true range is the largest of the bar's high minus low, the distance from the previous close to the high, and the distance from the previous close to the low. Setting the stop distance as a multiple of the ATR makes the risk distance wider in volatile conditions and narrower in quiet ones.
• Reward to risk multiples
Targets placed at 1, 2 and 3 times the stop distance express the potential reward in units of risk, often called R multiples. A higher multiple needs a smaller win rate to break even in theory, but it is also reached less often. The right balance depends on the instrument, the timeframe and the costs involved.
• Limits of the method
Swing-based trend rules work best when markets trend and legs are clearly defined. In choppy ranges the leg is repeatedly broken in both directions, so flips can follow each other closely. No fixed ratio or window suits every market, and results should be examined on the instrument and timeframe in question before relying on them.
⚠️ Disclaimer
All provided scripts and indicators are strictly for educational exploration and must not be interpreted as financial advice or a recommendation to execute trades. We expressly disclaim all liability for any financial losses or damages that may result, directly or indirectly, from the reliance on or application of these tools. Market participation carries inherent risk where past performance never guarantees future returns, leaving all investment decisions and due diligence solely at your own discretion.
✨ Originality and Utility
Most trend tools react to a smoothed price line or to a fixed percentage move. This script reads structure instead. It builds a clean alternating chain of swing highs and swing lows, treats the most recent leg in the trend direction as the reference, and asks one question on every closed bar: has price given back more of that leg than the selected retracement ratio allows?
The answer is a single, explainable rule. A rising leg is considered intact until a close falls below its break level, and a falling leg is considered intact until a close rises above its break level. Nothing else decides the flip.
What sets it apart from a plain swing or zigzag tool:
- The break level is anchored to the leg itself. It moves only when the leg is extended or replaced, so it is not an average that drifts with every bar.
- Swing acceptance is filtered. A second swing of the same type is accepted only when it is more extreme than the one it follows, which keeps the chain alternating and prevents minor pivots from rewriting the leg.
- The break ratio is selectable from five levels, so the trader chooses how much retracement counts as a failed leg.
- The trade map is optional and separate from the trend logic. Turning it off leaves only BULL and BEAR flips.
- A dashboard reports the state of the leg, the retracement already used and the state of the open trade, so the reasoning is visible on the chart.
● Mashup justification
The script combines three ideas, and each one has a distinct job so that none is redundant:
- Swing structure defines what the reference leg is.
- A Fibonacci retracement fraction defines when that leg is considered broken.
- The Average True Range defines how far the stop and targets sit from the entry, so risk scales with current volatility.
The three parts never compute the same thing. Structure supplies the reference, the ratio supplies the invalidation rule, and the ATR supplies the distance. Removing any one of them would leave a gap that the other two cannot fill.
🔬 Methodology and Concepts
• Swing points
A swing high is a bar whose high is the highest of the Left Bars bars before it and the Right Bars bars after it. A swing low is the mirror image using lows. Both are found with the standard pivot calculation, using 10 bars on each side by default.
If a single bar qualifies as both a swing high and a swing low, that bar is ignored so the chain stays clean.
• Building the alternating chain
The script keeps the latest accepted swing and the one before it. The rules are:
- A swing high that follows a swing low is accepted, and the two form a new leg.
- A swing low that follows a swing high is accepted in the same way.
- A swing high that follows another swing high is accepted only if it is strictly higher. It then replaces the earlier one and the leg grows.
- A swing low that follows another swing low is accepted only if it is strictly lower. It then replaces the earlier one.
- A same-type swing that is equal or less extreme is discarded.
The leg is the move between the two latest accepted swings. It points up when the latest swing is a high and down when the latest swing is a low.
• The first trend
No flip can occur before two swings exist. The first accepted leg sets the starting trend silently. The dashboard labels this state with the prefix Initial until the first real flip happens, and no BULL or BEAR marker is drawn for it.
• The break level
For an upward leg with high H and low L, the break level is H minus the ratio times (H minus L). For a downward leg it is L plus the ratio times (H minus L). With the default 38.2% ratio, a rising leg is broken once a close falls below the point where 38.2% of the leg has been given back.
• The flip rule
On each closed bar the close and the break level are both rounded to the symbol's minimum tick. If the active leg is up and the rounded close is below the rounded level, the trend flips to bear. If the active leg is down and the rounded close is above the rounded level, the trend flips to bull. A close that lands exactly on the level is not a break.
• Which leg is active
The active leg is always a leg in the direction of the current trend. While a counter-trend leg forms, the previous trend-direction leg stays active, and its break level is the line the counter-move has to cross. When a new leg appears in the trend direction, or the current one is extended, the active leg and its level are refreshed.
After a flip the indicator checks whether the latest leg already points in the new direction. If it does, that leg becomes active immediately. If it does not, the active leg is shown as None until a new leg in the new direction is accepted.
• Trade levels
When Enable Trade Levels is on, every flip opens a trade at the closing price of the flip bar:
- The stop distance is Stop ATR Multiple times the ATR of length Stop ATR Length.
- The stop sits that distance against the trade direction.
- TP1, TP2 and TP3 sit at 1, 2 and 3 times the stop distance in the trade direction.
- A trade is not opened if the ATR is undefined, if the distance is no larger than one tick, or if any level would be at or below zero. The dashboard then shows No Trade.
Targets are reached when price touches them. The stop is reached when a bar closes beyond it. The trade ends at the stop or at TP3. By default 33% is closed at TP1, 33% at TP2 and the remainder at TP3.
• Standard charts only
Heikin Ashi, Renko, Kagi, Point and Figure, Range and Line Break charts display synthetic prices. On those chart types the script draws a red notice asking the trader to switch to regular candles, and it produces no flips.
🎨 Visual Guide
- Candle coloring: when Color Candles is on, each candle takes the trend color. Teal means the trend is bull and red means it is bear. Candles remain uncolored until the first trend is set. The chart's own candles stay underneath.
- BULL label: a teal label drawn below the bar on which the trend flipped to bull.
- BEAR label: a red label drawn above the bar on which the trend flipped to bear.
- Swing points: small grey circles placed above swing highs and below swing lows. They are hidden by default and appear when Show Swing Points is on. When a more extreme same-type swing replaces an earlier one, the old circle is removed.
- Leg line: a thin solid grey line joining the two swings of the active leg. It appears when Show Leg and Break Level is on.
- Break level: an orange dashed horizontal line at the break level of the active leg, with an orange label at its right end showing the selected ratio. The line is extended to the current bar while the leg is active.
- Stop: a thicker solid red line with a red label that reads SL followed by the price.
- Entry: a blue dashed line with a blue label that reads Entry followed by the price.
- TP1, TP2 and TP3: three teal dashed lines with labels that read TP followed by the price. The teal becomes more opaque from TP1 to TP3.
- Hit markers: when a target or the stop is reached, its label changes to show HIT and the percentage move from the entry. Long trades show gains as positive, short trades show gains as positive in their own direction.
- Level extension: the trade lines run ten bars beyond the latest bar while the trade is open, and stop ten bars after the bar on which the trade closed.
- Only the most recent trade is drawn. A new flip removes the previous trade's lines and labels.
● Dashboard
The dashboard sits in the corner chosen in Dashboard Position. The header shows the short name FSF, the symbol and the timeframe. The rows are:
- Lock: ACTIVE in red when Lock Signal is on, otherwise OFF.
- Trend: None, Initial-Bull, Initial-Bear, Bull or Bear, colored teal or red.
- Active Leg: Up, Down or None.
- Break Level: the price of the active break level, or a dash when there is no active leg.
- Retraced: the share of the active leg that the current close has already given back, as a percentage. A reading near the selected ratio means price is close to the break level.
- Last Flip: the direction of the last flip and how many bars ago it happened.
- Trade: Long, Short, Flat or No Trade, shown only when trade levels are enabled.
- Entry, Stop, TP1, TP2, TP3: the prices of the open or most recent trade, with a check mark added to each level that has been reached.
- Partial Sizes: a warning row with a yellow fill that appears when TP1 Close % and TP2 Close % together exceed 100% and have been scaled.
📖 How to Use
● Reading the trend
- A teal candle run with the dashboard reading Bull means the last flip was upward and no close has yet broken the active leg.
- A red candle run with the dashboard reading Bear means the opposite.
- A BULL or BEAR label marks the bar where the previous leg was broken, so it shows where the structure changed, not where a turn is forecast.
● Using the Retraced reading
- A low value means the active leg is barely challenged.
- A value approaching the selected ratio means price is testing the break level.
- The leg is broken only when a bar closes beyond the level. Touching or wicking through it is not a break.
● Choosing the ratio
- 23.6% flips earliest and tolerates the shallowest pullback.
- 38.2% is the default balance.
- 50% is the midpoint of the leg. It is not a Fibonacci ratio, but it is one of the most used retracement levels.
- 61.8% and 78.6% allow deep pullbacks before the trend is declared broken, which means fewer flips and a larger give-back before each one.
● Using the swing settings
- Smaller Left Bars and Right Bars find more and smaller swings, so legs are shorter and flips are more frequent.
- Larger values find fewer and more significant swings.
- Equal values on both sides are a sensible starting point. Test other values on the instrument and timeframe being traded.
● Using the trade map
- The map is a reference for sizing and planning around a flip. It is not a recommendation to enter.
- Because the targets are fixed multiples of the stop distance, the reward to risk ratio at TP1, TP2 and TP3 is 1, 2 and 3 to 1 in price terms, before costs and slippage.
- Always check the stop distance against the instrument's typical movement and apply position sizing that fits personal risk limits.
● Alerts
Eight alert conditions are available: BULL Signal, BEAR Signal, Close Long Signal, Close Short Signal, TP1 Hit, TP2 Hit, TP3 Hit and SL Hit. The script also sends a text payload through the alert function that contains the action word, the ticker, the timeframe, the direction, the entry price and, when trade levels are on, the stop and the three targets. Partial close payloads add the size to be closed. The action words are editable in the settings.
⚙️ Inputs and Settings
● Core Settings
- Left Bars (default 10): how many bars before a swing must be lower than a swing high, or higher than a swing low.
- Right Bars (default 10): how many bars after a swing must satisfy the same condition.
- Break Level (default 38.2%): the fraction of the active leg that a close must go beyond to flip the trend. Options are 23.6%, 38.2%, 50%, 61.8% and 78.6%.
● Trade Tools
- Enable Trade Levels (default on): when off, BULL and BEAR are the only outputs and no stop or target is drawn, shown or sent.
- Lock Signal (default off): freezes the current signal and blocks new ones.
- Stop ATR Length (default 14): the ATR length used for the stop distance.
- Stop ATR Multiple (default 1.5): the stop distance in ATR units. The three targets are set at 1, 2 and 3 times this distance.
● Visuals
- Show Leg and Break Level (default off): draws the active leg and its break level.
- Show Swing Points (default off): marks every accepted swing.
- Show Signal Markers (default on): draws the BULL and BEAR labels. Alerts and the trend state do not depend on it.
- Show Trade Levels (default on): draws entry, stop and targets. It has an effect only when trade levels are enabled.
- Color Candles (default on): colors candles by trend.
- Max Flips Displayed (default 50): removes the oldest drawings once the count is exceeded. It changes nothing that the indicator tracks, alerts on or counts. The platform allows at most 500 labels and 500 lines.
● Dashboard
- Show Dashboard (default on): shows or hides the table.
- Dashboard Position (default Top Right): Top Right, Top Left, Bottom Right or Bottom Left.
● Alerts
- Long Action, Short Action, Close Long Action, Close Short Action, Partial Close Long Action and Partial Close Short Action: the action words placed in the payload for each event.
- TP1 Close % and TP2 Close % (default 33 each): the share of the position closed at TP1 and TP2. The remainder closes at TP3. If the two total more than 100%, both are scaled in proportion to 100% and the dashboard says so.
● Colors
Every color can be changed: Bull, Bear, Leg Line, Break Level, Swing Point, Label Text, Stop, Entry, TP1, TP2, TP3, Dashboard Header, Dashboard Background, Dashboard Text and Dashboard Warning.
● Notes on trade levels
The trade map is a planning tool. The stop is not moved after a target is reached, and results depend on costs, slippage and execution. Past results do not guarantee future performance.
🔍 Deconstruction of the Underlying Scientific and Academic Framework
• Swing points as local extrema
A swing high or low is a local extremum over a symmetric window. It is the point in a price series that is greater, or smaller, than every neighbor within a fixed number of bars on both sides. This is the same idea as the n-bar fractal used by many chart-pattern methods. The window length controls the scale of the structure that is detected.
• Trend as a sequence of swings
Classical trend analysis, associated with Dow Theory, describes an uptrend as a series of higher highs and higher lows, and a downtrend as lower highs and lower lows. A trend is considered intact while that sequence holds. This script formalizes the idea by tracking the chain of swings and declaring a change when a pullback becomes deeper than a defined fraction of the last leg.
• Fibonacci ratios
The ratios 23.6%, 38.2%, 61.8% and 78.6% come from the Fibonacci sequence. Dividing a term by the next term approaches about 0.618, dividing by the term two places ahead gives about 0.382, dividing by the term three places ahead gives about 0.236, and the square root of 0.618 gives about 0.786. The 50% option is not a Fibonacci ratio. It is offered because it is one of the most common retracement levels and is often tied to Dow Theory.
The ratios serve here as widely used reference points for how deep a pullback can go. The use of these levels in markets rests on convention and practitioner experience. This description makes no claim that they are statistically proven to predict reversals.
• Volatility scaling with the Average True Range
The Average True Range, introduced by J. Welles Wilder, smooths the true range of each bar with Wilder's moving average. The true range is the largest of the bar's high minus low, the distance from the previous close to the high, and the distance from the previous close to the low. Setting the stop distance as a multiple of the ATR makes the risk distance wider in volatile conditions and narrower in quiet ones.
• Reward to risk multiples
Targets placed at 1, 2 and 3 times the stop distance express the potential reward in units of risk, often called R multiples. A higher multiple needs a smaller win rate to break even in theory, but it is also reached less often. The right balance depends on the instrument, the timeframe and the costs involved.
• Limits of the method
Swing-based trend rules work best when markets trend and legs are clearly defined. In choppy ranges the leg is repeatedly broken in both directions, so flips can follow each other closely. No fixed ratio or window suits every market, and results should be examined on the instrument and timeframe in question before relying on them.
⚠️ Disclaimer
All provided scripts and indicators are strictly for educational exploration and must not be interpreted as financial advice or a recommendation to execute trades. We expressly disclaim all liability for any financial losses or damages that may result, directly or indirectly, from the reliance on or application of these tools. Market participation carries inherent risk where past performance never guarantees future returns, leaving all investment decisions and due diligence solely at your own discretion.

💡 Proprietary indicators. Original research. Built by analysts who trade.
📢 Free Telegram: t.me/MarkitTick_Updates
👑 Premium: TradingView Marketplace
📘 Guides: markittick.com
📢 Free Telegram: t.me/MarkitTick_Updates
👑 Premium: TradingView Marketplace
📘 Guides: markittick.com
คำจำกัดสิทธิ์ความรับผิดชอบ
ข้อมูลและบทความไม่ได้มีวัตถุประสงค์เพื่อก่อให้เกิดกิจกรรมทางการเงิน, การลงทุน, การซื้อขาย, ข้อเสนอแนะ หรือคำแนะนำประเภทอื่น ๆ ที่ให้หรือรับรองโดย TradingView อ่านเพิ่มเติมใน ข้อกำหนดการใช้งาน
💡 Proprietary indicators. Original research. Built by analysts who trade.
📢 Free Telegram: t.me/MarkitTick_Updates
👑 Premium: TradingView Marketplace
📘 Guides: markittick.com
📢 Free Telegram: t.me/MarkitTick_Updates
👑 Premium: TradingView Marketplace
📘 Guides: markittick.com
คำจำกัดสิทธิ์ความรับผิดชอบ
ข้อมูลและบทความไม่ได้มีวัตถุประสงค์เพื่อก่อให้เกิดกิจกรรมทางการเงิน, การลงทุน, การซื้อขาย, ข้อเสนอแนะ หรือคำแนะนำประเภทอื่น ๆ ที่ให้หรือรับรองโดย TradingView อ่านเพิ่มเติมใน ข้อกำหนดการใช้งาน