OPEN-SOURCE SCRIPT
ที่อัปเดต: Buy / Sell Volume + % (Classic + Pressure)
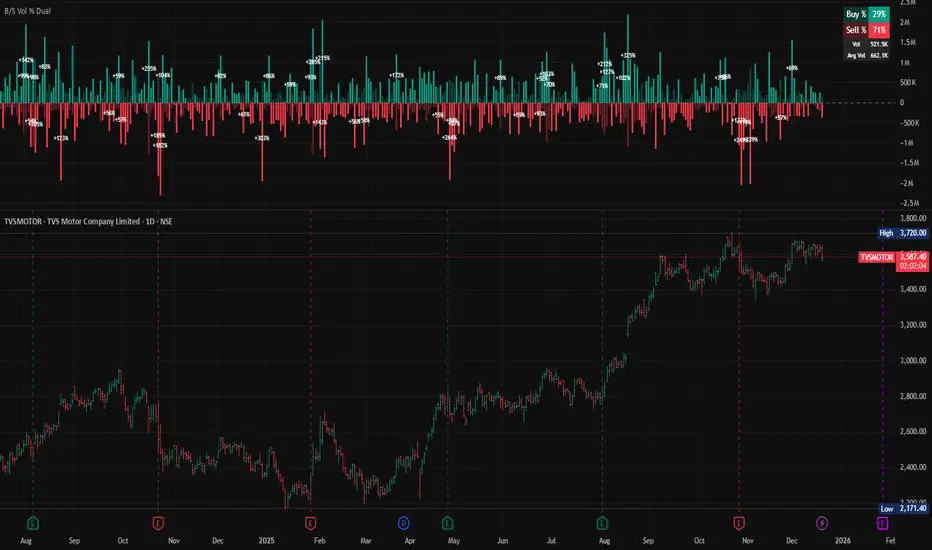
Buy / Sell Volume % (Classic + Pressure)
Overview
Buy / Sell Volume (Classic + Pressure) is a volume decomposition and dominance indicator designed to help traders understand how trading volume is distributed between buying and selling pressure on each candle.
Instead of treating volume as a single number, this indicator splits total volume into estimated Buy Volume and Sell Volume, visualizes them symmetrically, and summarizes dominance using a compact on-chart dashboard.
The indicator is intended as a context and confirmation tool, not a trade signal generator.
Core Concepts
1. Buy / Sell Volume Decomposition
The indicator estimates buying and selling activity based on the position of the close within the candle’s high–low range:
Closes near the high → more buying pressure
Closes near the low → more selling pressure
Middle closes → balanced activity
This provides a clear visual view of demand vs supply on every bar.
2. Dual Calculation Modes
🔹 Classic Mode (Default)
Uses pure candle-range logic
Buy Volume + Sell Volume = Total Volume (exact conservation)
No smoothing or directional bias
Values closely match traditional volume behavior
Best for:
Structural analysis
Accumulation / distribution studies
Comparing against raw volume
🔹 Pressure Mode
Introduces a directional bias:
Bullish candles slightly favor buy volume
Bearish candles slightly favor sell volume
Optional EMA smoothing reduces noise
Still volume-conserving (Buy + Sell = Total Volume)
Best for:
Identifying dominance
Trend continuation confirmation
Absorption vs initiative activity
Visual Elements
Volume Bars
Buy Volume plotted above zero
Sell Volume plotted below zero
Optional Total Volume Envelope for context
Color by Dominance
Bright colors when one side dominates
Faded colors when dominance is weak
Helps instantly identify:
Accumulation
Distribution
Absorption
Dashboard (Optional)
A compact dashboard displays:
Buy %
Sell %
Dominance State
BUY DOM
SELL DOM
BALANCED
The dashboard can be toggled ON/OFF and switched between Normal and Compact size to suit multi-pane layouts.
How to Use This Indicator
This indicator works best as a confirmation layer, not a standalone system.
Common Use Cases
Confirming breakouts or breakdowns
Spotting accumulation or distribution near key levels
Identifying absorption during consolidations
Filtering false price moves
Examples
Price rising + strong Buy % → constructive demand
Price rising + strong Sell % → possible distribution
Flat price + balanced volume → absorption / compression
What This Indicator Is NOT
❌ Not true order-flow or bid/ask data
❌ Not a buy/sell signal generator
❌ Not predictive on its own
All calculations are candle-based estimations, designed for context and insight, not execution timing.
Best Use
Works on all timeframes
Most reliable on liquid instruments
Especially useful when combined with:
Support / resistance
Trend structure
Market regime or breadth indicators
Summary
Buy / Sell Volume (Classic + Pressure) helps traders go beyond raw volume by visualizing who is in control of each candle, how strong that control is, and whether volume behavior supports price action.
Used correctly, it can significantly improve trade selectivity, confidence, and risk awareness.
Overview
Buy / Sell Volume (Classic + Pressure) is a volume decomposition and dominance indicator designed to help traders understand how trading volume is distributed between buying and selling pressure on each candle.
Instead of treating volume as a single number, this indicator splits total volume into estimated Buy Volume and Sell Volume, visualizes them symmetrically, and summarizes dominance using a compact on-chart dashboard.
The indicator is intended as a context and confirmation tool, not a trade signal generator.
Core Concepts
1. Buy / Sell Volume Decomposition
The indicator estimates buying and selling activity based on the position of the close within the candle’s high–low range:
Closes near the high → more buying pressure
Closes near the low → more selling pressure
Middle closes → balanced activity
This provides a clear visual view of demand vs supply on every bar.
2. Dual Calculation Modes
🔹 Classic Mode (Default)
Uses pure candle-range logic
Buy Volume + Sell Volume = Total Volume (exact conservation)
No smoothing or directional bias
Values closely match traditional volume behavior
Best for:
Structural analysis
Accumulation / distribution studies
Comparing against raw volume
🔹 Pressure Mode
Introduces a directional bias:
Bullish candles slightly favor buy volume
Bearish candles slightly favor sell volume
Optional EMA smoothing reduces noise
Still volume-conserving (Buy + Sell = Total Volume)
Best for:
Identifying dominance
Trend continuation confirmation
Absorption vs initiative activity
Visual Elements
Volume Bars
Buy Volume plotted above zero
Sell Volume plotted below zero
Optional Total Volume Envelope for context
Color by Dominance
Bright colors when one side dominates
Faded colors when dominance is weak
Helps instantly identify:
Accumulation
Distribution
Absorption
Dashboard (Optional)
A compact dashboard displays:
Buy %
Sell %
Dominance State
BUY DOM
SELL DOM
BALANCED
The dashboard can be toggled ON/OFF and switched between Normal and Compact size to suit multi-pane layouts.
How to Use This Indicator
This indicator works best as a confirmation layer, not a standalone system.
Common Use Cases
Confirming breakouts or breakdowns
Spotting accumulation or distribution near key levels
Identifying absorption during consolidations
Filtering false price moves
Examples
Price rising + strong Buy % → constructive demand
Price rising + strong Sell % → possible distribution
Flat price + balanced volume → absorption / compression
What This Indicator Is NOT
❌ Not true order-flow or bid/ask data
❌ Not a buy/sell signal generator
❌ Not predictive on its own
All calculations are candle-based estimations, designed for context and insight, not execution timing.
Best Use
Works on all timeframes
Most reliable on liquid instruments
Especially useful when combined with:
Support / resistance
Trend structure
Market regime or breadth indicators
Summary
Buy / Sell Volume (Classic + Pressure) helps traders go beyond raw volume by visualizing who is in control of each candle, how strong that control is, and whether volume behavior supports price action.
Used correctly, it can significantly improve trade selectivity, confidence, and risk awareness.
Release Note
📊 Buy / Sell Volume (Classic + Pressure)Buy / Sell Volume (Classic + Pressure) is a volume-analysis indicator that estimates buying vs selling participation inside each candle, helping traders understand who is in control — buyers, sellers, or neither.
Unlike raw volume, this tool decomposes volume into Buy Volume and Sell Volume using price location and candle behavior, then visualizes dominance, strength, and participation quality.
🚨 IMPORTANT SETTINGS NOTE (Please Read)
For the cleanest and intended visual experience, please do the following after adding the indicator:
Turn OFF
➜ “Show Total Volume Envelope”
Turn OFF
➜ “Labels on Price Scale”
These settings do not affect calculations, only chart clarity.
🔍 How it works
The indicator splits each bar’s total volume into two components:
1️⃣ Classic Mode (Neutral)
Volume is distributed based on where price closes within the candle range
Close near high → more buy volume
Close near low → more sell volume
Fully volume-conserving and unbiased
Best suited for:
Range-bound markets
Mean-reversion strategies
Broad participation analysis
2️⃣ Pressure Mode (Directional)
Adds a directional bias:
Bull candles slightly favor buy volume
Bear candles slightly favor sell volume
Buy/Sell volumes are EMA-smoothed to reduce noise
Best suited for:
Trending markets
Breakouts and continuations
Momentum confirmation
📈 Visual Elements
Buy & Sell Volume Histograms
Buy Volume plotted above zero
Sell Volume plotted below zero
Zero line clearly separates control
Delta-Based Coloring
Dominant side appears brighter
Non-dominant side is visually muted
This allows quick identification of:
Strong accumulation
Active distribution
Weak or mixed participation
📊 Volume Strength, Labels & Tooltips
Current volume is compared against a moving average of volume
When volume exceeds 150% of its average, a visible +% label appears inside the dominant bar
These labels are intentionally rare and highlight only meaningful participation
Hovering over the label or bar reveals a tooltip showing:
Actual traded volume
Average volume
Buy %
Sell %
Current dominance state
This design keeps the chart clean while still providing deep context on demand.
🧭 Dashboard
A compact dashboard displays:
Buy %
Sell %
Current dominance state (BUY / SELL / BALANCED)
Designed for quick reads without cluttering the chart.
🧠 How to use it
Confirm breakouts → Rising buy volume with BUY dominance
Spot weak rallies → Price up but sell volume still dominant
Identify exhaustion → Large volume expansion followed by shrinking dominance
Combine with structure → Best used alongside price action, VWAP, or trend tools
⚠️ Important notes
This is not true bid/ask or tick-level order flow
It is a price-position-weighted volume approximation
Accuracy is lower on:
Illiquid instruments
Large gap candles
Intended as a confirmation tool, not a standalone signal
✅ Key features
Buy / Sell volume decomposition
Classic & Pressure calculation modes
Delta-based visual dominance
Above-average volume highlighting with hover tooltips
Clean, non-repainting logic
Works on all timeframes and markets
Release Note
Made visual updates only :1. Replaced Buy Dom/Sell Dom on dashboard with Vol and Ave Vol.
2. Introduced "Soft Clipping" on spike/outlier/high-vol bars so that one bar does not shrink the rest of the layout due to scaling. Hovering over high vol bars shows "Clipped" when it has occurred, along with other previous info.
3. Fixed Normal and Compact dashboard sizes.
*As mentioned earlier, disable "Labels on Price Scale" in settings.
Release Note
This script has been enhanced to work correctly from Day-1 for newly listed (IPO) stocks, without altering its behavior on mature symbols.Previously, certain calculations (such as average volume, volume clipping, and smoothing) required 30–50 historical bars. Newly listed stocks do not have sufficient history, which caused:
-Missing dashboard values
-No above-average volume labels
-Incomplete or inactive visuals during the first few weeks
The script now uses progressive, history-aware calculations during the early life of a stock:
Average Volume
Gradually builds using available bars
Automatically converges to the full lookback once enough data exists
Above-Average Volume Detection
Early phase: compares volume against the highest volume seen so far
Mature phase: reverts to the original “1.5× average volume” rule
Volume Clipping (Visual Scaling Only)
Uses highest observed volume when history is limited
Transitions back to the original SMA-based clipping once sufficient data exists
Pressure Mode Smoothing
EMA smoothing is deferred until enough bars are available
Prevents distorted early readings
What has NOT changed :
All visuals, colors, dashboard layout, and sizing
Label behavior and user inputs
Logic and output for non-IPO / mature stocks
Overall interpretation of buy/sell pressure
➡ After approximately 30–50 bars post listing of the stock, the script behaves identically to previous versions. So, this enhancement was only to provide accurate info in the early days of a listed stock.
Release Note
Changed script for corner-case scenarios whereby absurd volumes on a particular day (esp for illiquid stocks) used to not clip properly, and thus made other histograms visually much smaller in comparison.Changed the logic to fix that.
Release Note
Visual only : Added a Large size for the dashboard. Now sizes are compact, normal and large.สคริปต์โอเพนซอร์ซ
ด้วยเจตนารมณ์หลักของ TradingView ผู้สร้างสคริปต์นี้ได้ทำให้เป็นโอเพนซอร์ส เพื่อให้เทรดเดอร์สามารถตรวจสอบและยืนยันฟังก์ชันการทำงานของมันได้ ขอชื่นชมผู้เขียน! แม้ว่าคุณจะใช้งานได้ฟรี แต่โปรดจำไว้ว่าการเผยแพร่โค้ดซ้ำจะต้องเป็นไปตาม กฎระเบียบการใช้งาน ของเรา

คำจำกัดสิทธิ์ความรับผิดชอบ
ข้อมูลและบทความไม่ได้มีวัตถุประสงค์เพื่อก่อให้เกิดกิจกรรมทางการเงิน, การลงทุน, การซื้อขาย, ข้อเสนอแนะ หรือคำแนะนำประเภทอื่น ๆ ที่ให้หรือรับรองโดย TradingView อ่านเพิ่มเติมใน ข้อกำหนดการใช้งาน
สคริปต์โอเพนซอร์ซ
ด้วยเจตนารมณ์หลักของ TradingView ผู้สร้างสคริปต์นี้ได้ทำให้เป็นโอเพนซอร์ส เพื่อให้เทรดเดอร์สามารถตรวจสอบและยืนยันฟังก์ชันการทำงานของมันได้ ขอชื่นชมผู้เขียน! แม้ว่าคุณจะใช้งานได้ฟรี แต่โปรดจำไว้ว่าการเผยแพร่โค้ดซ้ำจะต้องเป็นไปตาม กฎระเบียบการใช้งาน ของเรา
คำจำกัดสิทธิ์ความรับผิดชอบ
ข้อมูลและบทความไม่ได้มีวัตถุประสงค์เพื่อก่อให้เกิดกิจกรรมทางการเงิน, การลงทุน, การซื้อขาย, ข้อเสนอแนะ หรือคำแนะนำประเภทอื่น ๆ ที่ให้หรือรับรองโดย TradingView อ่านเพิ่มเติมใน ข้อกำหนดการใช้งาน