Price Flow - Buy Sell
# Price Flow Buy Sell
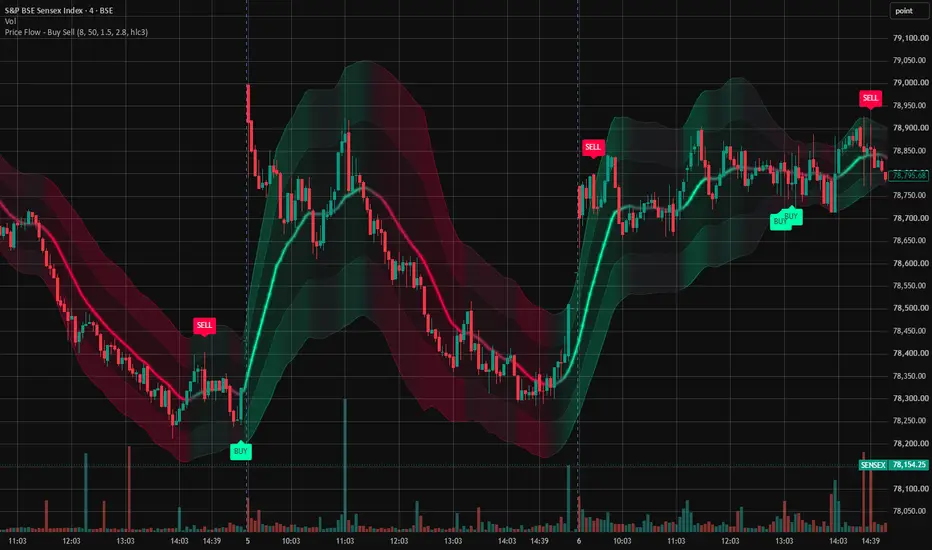
**Price Flow Buy Sell** is an adaptive market-flow indicator designed to identify potential BUY and SELL opportunities by analyzing price direction, volatility, momentum, statistical price extremes, and signs of trend exhaustion.
Instead of relying on a basic moving-average crossover, Price Flow Buy Sell continuously estimates the market's dynamic **fair value** and measures how price is behaving around that level.
The goal is simple:
**Identify when price becomes stretched, momentum begins to weaken, and price flow shows signs of changing direction.**
## 🚀 Key Features
### 🟢 Clear BUY & SELL Signals
Price Flow Buy Sell displays easy-to-read signals directly on the chart:
**BUY** signals identify potential bullish reversal opportunities.
**SELL** signals identify potential bearish reversal opportunities.
Signals are not generated from price crossing a single line. Multiple conditions involving price rejection, momentum and market behavior are evaluated before a signal is produced.
---
## 📈 Adaptive Price Flow
At the heart of the indicator is an adaptive statistical regression model that calculates a dynamic **Fair Value Core**.
Unlike a traditional moving average, the calculation uses weighted historical price information and automatically adapts to changing volatility.
This creates a smoother representation of the underlying price flow while helping reduce short-term market noise.
---
## 🌊 Dynamic Fair Value
The central Price Flow line represents the estimated fair value of the market.
Its color provides a quick visual indication of momentum:
🟢 **Green:** Bullish price flow
🔴 **Red:** Bearish price flow
⚪ **Grey/Neutral:** Momentum is weak or transitioning
The indicator analyzes both the **velocity and acceleration** of the fair-value curve rather than simply checking whether price is above or below it.
This can help identify when an existing move is beginning to lose momentum.
---
## 🎯 Adaptive Price Zones
Price Flow Buy Sell automatically creates dynamic Inner and Outer zones around fair value.
### Inner Zones
The Inner Zones represent moderate deviations from fair value.
They are particularly useful when the market is consolidating or trading within a range.
### Outer Zones
The Outer Zones represent more extreme deviations from fair value.
During stronger trends, the indicator becomes more selective and focuses on price rejection around these extreme zones.
This helps reduce the tendency to generate reversal signals too early during powerful market moves.
---
## 🟢 How BUY Signals Are Detected
A potential BUY setup begins when price becomes extended below its calculated fair-value range.
The indicator then looks for evidence that bearish pressure is weakening.
Depending on current market conditions, the system evaluates factors including:
• Price reaching the lower adaptive zone
• Rejection back inside the zone
• Bullish candle confirmation
• Weakening bearish price flow
• Positive momentum acceleration
• Current trend/range conditions
When the required conditions align, a **BUY** signal is displayed below the candle.
The objective is to identify potential bullish reversals after selling pressure begins to lose strength.
---
## 🔴 How SELL Signals Are Detected
A potential SELL setup occurs when price becomes extended above its calculated fair-value range.
The indicator then analyzes whether bullish momentum is beginning to weaken.
Conditions can include:
• Price reaching the upper adaptive zone
• Rejection back inside the zone
• Bearish candle confirmation
• Weakening bullish price flow
• Negative momentum acceleration
• Current trend/range conditions
When the conditions align, a **SELL** signal is displayed above the candle.
The objective is to identify potential bearish reversals after buying pressure begins to lose strength.
---
## 🧠 Automatic Trend & Range Detection
Markets behave differently when trending and ranging.
Price Flow Buy Sell automatically evaluates the strength of the underlying price movement and adjusts its signal logic accordingly.
**Trending Market**
The indicator becomes more selective and primarily looks for reversals from the Outer Zones.
**Ranging Market**
The indicator can use the closer Inner Zones to detect shorter price-flow reversals.
This adaptive behavior allows the same indicator to respond differently as market conditions change.
---
## ⚡ Adaptive Volatility Engine
Market volatility is constantly changing.
When **Adaptive Volatility** is enabled, Price Flow Buy Sell automatically adjusts its calculations using current ATR volatility relative to recent market volatility.
During high volatility, additional smoothing helps reduce noise.
During normal or lower volatility, the indicator can remain more responsive to changes in price flow.
---
## 🛡️ Range Filter
The optional **Range Filter** provides additional momentum confirmation for signals generated around the Inner Zones.
When enabled, the indicator requires evidence that the existing price movement is weakening before generating a signal.
This provides a more selective signal approach.
Traders looking for more aggressive signals can disable the Range Filter.
---
## 🔄 Strict Buy/Sell Alternation
Price Flow Buy Sell also includes an optional **Strict Buy/Sell Alternation** mode.
When enabled, signals follow the sequence:
**BUY → SELL → BUY → SELL**
A second BUY cannot occur until a SELL has appeared, and vice versa.
This can provide a cleaner chart for traders who prefer directional transitions rather than repeated same-direction signals.
---
## 🔔 BUY & SELL Alerts
TradingView alerts are available for both signal types:
🔔 **BUY Alert**
🔔 **SELL Alert**
Alerts can be used to monitor multiple markets without continuously watching every chart.
---
## ⚙️ Main Settings
**Base Bandwidth**
Controls the responsiveness and smoothness of the Price Flow calculation.
Lower values increase responsiveness, while higher values provide greater smoothing.
**Lookback Window**
Controls the amount of historical price information used in calculating fair value.
**Inner Band Multiplier**
Controls the distance of the Inner Price Flow Zones.
**Outer Band Multiplier**
Controls the distance of the more extreme Outer Price Flow Zones.
**Adaptive Volatility**
Allows the calculation to automatically adjust to changing volatility.
**Range Filter**
Adds momentum confirmation to signals generated during ranging conditions.
**Strict Buy/Sell Alternation**
Prevents consecutive signals in the same direction.
---
## 📊 Suitable Markets
Price Flow Buy Sell can be applied to different liquid markets, including:
• Stocks
• Indices
• Futures
• Commodities
• Forex
• Cryptocurrency
It can also be tested across different chart timeframes depending on the trader's strategy.
---
## 💡 How to Use Price Flow Buy Sell
Rather than treating every BUY or SELL label as an automatic trade, traders can use Price Flow Buy Sell as a confirmation tool alongside:
• Support & Resistance
• VWAP
• Market Structure
• Volume Analysis
• Higher-Timeframe Trend
• RSI / Momentum
• Risk Management
For example, a BUY signal appearing near an established support area can provide stronger context than a BUY signal occurring without supporting market structure.
---
## ⚠️ Important
Price Flow Buy Sell does not attempt to predict the exact top or bottom of every market movement.
The indicator identifies conditions where price has become statistically extended from its estimated fair value while the underlying price flow shows potential signs of momentum exhaustion or reversal.
Signals should therefore be considered trading opportunities rather than guaranteed outcomes.
Always use appropriate risk management and independently evaluate market conditions before making trading decisions.
---
### Price Flow Buy Sell
**Follow the flow. Identify the extremes. Spot potential reversals.**
**Price Flow Buy Sell** is an adaptive market-flow indicator designed to identify potential BUY and SELL opportunities by analyzing price direction, volatility, momentum, statistical price extremes, and signs of trend exhaustion.
Instead of relying on a basic moving-average crossover, Price Flow Buy Sell continuously estimates the market's dynamic **fair value** and measures how price is behaving around that level.
The goal is simple:
**Identify when price becomes stretched, momentum begins to weaken, and price flow shows signs of changing direction.**
## 🚀 Key Features
### 🟢 Clear BUY & SELL Signals
Price Flow Buy Sell displays easy-to-read signals directly on the chart:
**BUY** signals identify potential bullish reversal opportunities.
**SELL** signals identify potential bearish reversal opportunities.
Signals are not generated from price crossing a single line. Multiple conditions involving price rejection, momentum and market behavior are evaluated before a signal is produced.
---
## 📈 Adaptive Price Flow
At the heart of the indicator is an adaptive statistical regression model that calculates a dynamic **Fair Value Core**.
Unlike a traditional moving average, the calculation uses weighted historical price information and automatically adapts to changing volatility.
This creates a smoother representation of the underlying price flow while helping reduce short-term market noise.
---
## 🌊 Dynamic Fair Value
The central Price Flow line represents the estimated fair value of the market.
Its color provides a quick visual indication of momentum:
🟢 **Green:** Bullish price flow
🔴 **Red:** Bearish price flow
⚪ **Grey/Neutral:** Momentum is weak or transitioning
The indicator analyzes both the **velocity and acceleration** of the fair-value curve rather than simply checking whether price is above or below it.
This can help identify when an existing move is beginning to lose momentum.
---
## 🎯 Adaptive Price Zones
Price Flow Buy Sell automatically creates dynamic Inner and Outer zones around fair value.
### Inner Zones
The Inner Zones represent moderate deviations from fair value.
They are particularly useful when the market is consolidating or trading within a range.
### Outer Zones
The Outer Zones represent more extreme deviations from fair value.
During stronger trends, the indicator becomes more selective and focuses on price rejection around these extreme zones.
This helps reduce the tendency to generate reversal signals too early during powerful market moves.
---
## 🟢 How BUY Signals Are Detected
A potential BUY setup begins when price becomes extended below its calculated fair-value range.
The indicator then looks for evidence that bearish pressure is weakening.
Depending on current market conditions, the system evaluates factors including:
• Price reaching the lower adaptive zone
• Rejection back inside the zone
• Bullish candle confirmation
• Weakening bearish price flow
• Positive momentum acceleration
• Current trend/range conditions
When the required conditions align, a **BUY** signal is displayed below the candle.
The objective is to identify potential bullish reversals after selling pressure begins to lose strength.
---
## 🔴 How SELL Signals Are Detected
A potential SELL setup occurs when price becomes extended above its calculated fair-value range.
The indicator then analyzes whether bullish momentum is beginning to weaken.
Conditions can include:
• Price reaching the upper adaptive zone
• Rejection back inside the zone
• Bearish candle confirmation
• Weakening bullish price flow
• Negative momentum acceleration
• Current trend/range conditions
When the conditions align, a **SELL** signal is displayed above the candle.
The objective is to identify potential bearish reversals after buying pressure begins to lose strength.
---
## 🧠 Automatic Trend & Range Detection
Markets behave differently when trending and ranging.
Price Flow Buy Sell automatically evaluates the strength of the underlying price movement and adjusts its signal logic accordingly.
**Trending Market**
The indicator becomes more selective and primarily looks for reversals from the Outer Zones.
**Ranging Market**
The indicator can use the closer Inner Zones to detect shorter price-flow reversals.
This adaptive behavior allows the same indicator to respond differently as market conditions change.
---
## ⚡ Adaptive Volatility Engine
Market volatility is constantly changing.
When **Adaptive Volatility** is enabled, Price Flow Buy Sell automatically adjusts its calculations using current ATR volatility relative to recent market volatility.
During high volatility, additional smoothing helps reduce noise.
During normal or lower volatility, the indicator can remain more responsive to changes in price flow.
---
## 🛡️ Range Filter
The optional **Range Filter** provides additional momentum confirmation for signals generated around the Inner Zones.
When enabled, the indicator requires evidence that the existing price movement is weakening before generating a signal.
This provides a more selective signal approach.
Traders looking for more aggressive signals can disable the Range Filter.
---
## 🔄 Strict Buy/Sell Alternation
Price Flow Buy Sell also includes an optional **Strict Buy/Sell Alternation** mode.
When enabled, signals follow the sequence:
**BUY → SELL → BUY → SELL**
A second BUY cannot occur until a SELL has appeared, and vice versa.
This can provide a cleaner chart for traders who prefer directional transitions rather than repeated same-direction signals.
---
## 🔔 BUY & SELL Alerts
TradingView alerts are available for both signal types:
🔔 **BUY Alert**
🔔 **SELL Alert**
Alerts can be used to monitor multiple markets without continuously watching every chart.
---
## ⚙️ Main Settings
**Base Bandwidth**
Controls the responsiveness and smoothness of the Price Flow calculation.
Lower values increase responsiveness, while higher values provide greater smoothing.
**Lookback Window**
Controls the amount of historical price information used in calculating fair value.
**Inner Band Multiplier**
Controls the distance of the Inner Price Flow Zones.
**Outer Band Multiplier**
Controls the distance of the more extreme Outer Price Flow Zones.
**Adaptive Volatility**
Allows the calculation to automatically adjust to changing volatility.
**Range Filter**
Adds momentum confirmation to signals generated during ranging conditions.
**Strict Buy/Sell Alternation**
Prevents consecutive signals in the same direction.
---
## 📊 Suitable Markets
Price Flow Buy Sell can be applied to different liquid markets, including:
• Stocks
• Indices
• Futures
• Commodities
• Forex
• Cryptocurrency
It can also be tested across different chart timeframes depending on the trader's strategy.
---
## 💡 How to Use Price Flow Buy Sell
Rather than treating every BUY or SELL label as an automatic trade, traders can use Price Flow Buy Sell as a confirmation tool alongside:
• Support & Resistance
• VWAP
• Market Structure
• Volume Analysis
• Higher-Timeframe Trend
• RSI / Momentum
• Risk Management
For example, a BUY signal appearing near an established support area can provide stronger context than a BUY signal occurring without supporting market structure.
---
## ⚠️ Important
Price Flow Buy Sell does not attempt to predict the exact top or bottom of every market movement.
The indicator identifies conditions where price has become statistically extended from its estimated fair value while the underlying price flow shows potential signs of momentum exhaustion or reversal.
Signals should therefore be considered trading opportunities rather than guaranteed outcomes.
Always use appropriate risk management and independently evaluate market conditions before making trading decisions.
---
### Price Flow Buy Sell
**Follow the flow. Identify the extremes. Spot potential reversals.**

คำจำกัดสิทธิ์ความรับผิดชอบ
ข้อมูลและบทความไม่ได้มีวัตถุประสงค์เพื่อก่อให้เกิดกิจกรรมทางการเงิน, การลงทุน, การซื้อขาย, ข้อเสนอแนะ หรือคำแนะนำประเภทอื่น ๆ ที่ให้หรือรับรองโดย TradingView อ่านเพิ่มเติมใน ข้อกำหนดการใช้งาน
คำจำกัดสิทธิ์ความรับผิดชอบ
ข้อมูลและบทความไม่ได้มีวัตถุประสงค์เพื่อก่อให้เกิดกิจกรรมทางการเงิน, การลงทุน, การซื้อขาย, ข้อเสนอแนะ หรือคำแนะนำประเภทอื่น ๆ ที่ให้หรือรับรองโดย TradingView อ่านเพิ่มเติมใน ข้อกำหนดการใช้งาน