OPEN-SOURCE SCRIPT
ที่อัปเดต: Volume Participation Shock Map [AGPro Series]
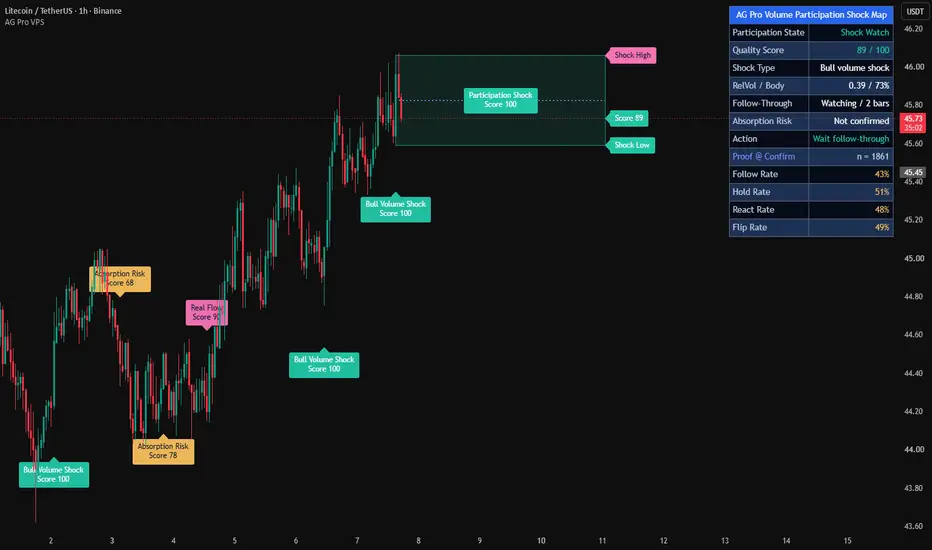
Volume Participation Shock Map [AGPro Series]
🧠 Core Idea
Did the volume shock bring real participation, or did the move get absorbed after the first impulse?

📌 Overview / What it does
Volume Participation Shock Map is a volume-flow interpretation tool designed to study what happens after a major participation candle appears.
The script identifies high-quality volume shocks by combining relative volume, candle body participation, ATR-adjusted range expansion, and close location. It then projects the active shock zone, tracks follow-through, detects absorption risk, highlights thin continuation attempts, and summarizes the current participation state in an AG Pro panel.
It does not predict price direction, automate trades, or claim that every high-volume candle will continue. It is a structured visualization tool for reading participation quality after volume events.

🎯 Purpose & Design Philosophy
Many volume tools stop at the first spike.
This script was built to answer the next question:
Did the market continue to participate after the shock, or was the impulse absorbed?
The design goal is to help traders separate meaningful volume expansion from one-bar excitement, thin breakouts, and failed participation.
⚡ Why This Script Is Different
Most tools focus on volume spikes, climax candles, or simple high-volume alerts.
This script does NOT treat high volume as automatically bullish or bearish.
Instead, it checks whether the candle had real body participation, whether price followed through beyond the shock zone, whether the move was absorbed back through the zone, and whether later breakouts happened with weak participation.
⚙️ Methodology
1. Shock Detection
The script compares current volume with recent average volume, checks candle body share, evaluates ATR-adjusted range expansion, and scores close location.
2. Shock Zone Mapping
When a qualified shock appears, the candle range becomes an active participation shock zone.
3. Follow-Through Evaluation
After the shock, the script watches whether price accepts beyond the shock high or low with enough relative volume.
4. Absorption Evaluation
If price closes back through the shock zone after the impulse, the script can mark absorption risk.
5. Visual Output
The chart displays the active shock zone, midpoint participation rail, event labels, right-side context tags, alerts, and a compact AG Pro panel.
🗺️ How to Read the Chart
Participation Shock Zone = the active high-volume candle range being evaluated.
Participation Rail = the midpoint of the shock zone.
BULL VOLUME SHOCK = a bullish shock candle with strong volume, body participation, and range expansion.
BEAR VOLUME SHOCK = a bearish shock candle with strong volume, body participation, and range expansion.
REAL FLOW CONTINUATION = price followed through beyond the shock zone with acceptable participation.
ABSORPTION RISK = price moved back through the shock zone after the initial impulse.
THIN MOVE = price moved beyond the shock edge without enough relative volume. This appears in Detailed label mode.
Panel = summarizes participation state, quality score, shock type, relative volume, body participation, follow-through, absorption risk, and next context.
🚦 Signals & States
• BULL VOLUME SHOCK → bullish high-participation impulse appeared.
• BEAR VOLUME SHOCK → bearish high-participation impulse appeared.
• REAL FLOW UP → bullish shock followed through with acceptable participation.
• REAL FLOW DOWN → bearish shock followed through with acceptable participation.
• BULL SHOCK ABSORBED → bullish shock lost participation back through the zone.
• BEAR SHOCK ABSORBED → bearish shock lost participation back through the zone.
• SHOCK WATCH → an active shock is still being evaluated.
• QUIET FLOW → no active participation shock is currently dominant.
🔔 Alerts Logic
Alerts trigger when a major participation state appears.
• Volume Participation Shock → a high-quality volume shock appears.
• Real-Flow Continuation → price follows through beyond the active shock zone with acceptable participation.
• Absorption Risk → price closes back through the active shock zone after the shock.
• Thin Move → price moves beyond the shock edge without enough relative volume.
Alerts are attention markers, not trade instructions.
🧩 Confluence Logic
The context becomes stronger when:
• Relative volume is clearly above normal
• Candle body participation is strong
• Candle range expands versus ATR
• Price closes near the directional side of the candle
• Follow-through appears before the evaluation window expires
• The panel state agrees with the chart label
If these elements do not align, the script avoids treating volume as automatic conviction.
📊 When to Use
• Breakout participation review
• Trend continuation validation
• Reversal impulse analysis
• High-volume candle interpretation
• Futures, stocks, forex, crypto, and liquid markets
• 15m, 30m, 1H, 4H, and 1D charts where volume data is meaningful
⚠️ When NOT to Use
• Symbols with unreliable or missing volume data
• Very low-liquidity markets
• Extremely noisy micro timeframes
• News spikes where volume behavior may be abnormal
• Markets where candle volume does not represent real participation well
• Situations where a single volume event should not be over-interpreted
🎛️ Key Inputs
• Relative Volume Length → defines the volume baseline.
• Shock Relative Volume → sets how strong volume must be before a shock can qualify.
• Minimum Body Participation % → controls how much candle body commitment is required.
• Minimum Range ATR → filters out small candles with high volume.
• Shock Quality Threshold → controls how selective the main shock labels are.
• Follow-Through Window → defines how long after a shock the script watches for continuation or absorption.
• Minimum Follow Relative Volume → defines whether continuation has enough participation.
• Absorption Midline Threshold % → controls how deeply price must return into the shock zone before absorption risk is marked.
• Event Label Mode → Premium focuses on major shock, continuation, and absorption events. Detailed also allows thin-move labels.
🖥️ Interface & Visual Design
The visual hierarchy is built around the active shock zone.
The zone shows the high-volume impulse range.
The midpoint rail helps judge acceptance versus absorption.
Event labels highlight the most important participation behavior.
Right-side tags keep the current shock context visible.
The AG Pro panel compresses the current state into a fast, readable decision-support summary.
🧪 Practical Usage Workflow
1. Read the panel participation state.
2. Check whether an active shock zone is present.
3. Watch whether price accepts beyond the shock high or low.
4. Evaluate whether follow-through has enough relative volume.
5. Watch for absorption back through the shock zone.
6. Confirm the chart context with structure, trend, liquidity, and risk planning.
🔍 Interpretation Guidelines
A volume shock is not automatically a valid trade signal.
Continuation is stronger when price accepts beyond the shock zone with participation.
Absorption matters when the first impulse cannot hold its zone.
Thin moves can warn that price is extending without enough participation.
The script is best used as a participation-reading layer, not as a standalone decision system.
🚫 What This Script Is NOT
This script is not a prediction engine.
It is not financial advice.
It is not an auto-trading system.
It does not provide guaranteed entry or exit signals.
It is not a simple volume spike alert.
⚠️ Limitations & Transparency
Volume quality depends on the symbol and market.
Crypto, futures, stocks, and forex may represent volume differently.
High volatility can create sudden shock labels that need broader context.
Low-liquidity assets may produce misleading relative volume readings.
Different timeframes may show different participation behavior.
🧠 Market Context Notes
Volume can be useful only when it is read together with price behavior.
A strong candle with high volume may show participation.
But if price cannot follow through, that same candle may become an absorption reference.
This script is designed to make that difference easier to see.
🧾 Use Case Examples
If a strong bullish candle appears with high relative volume, large body participation, and range expansion, the script may mark BULL VOLUME SHOCK.
If price later closes above the shock high with enough participation, the script may mark REAL FLOW CONTINUATION.
If price closes back through the shock zone after the impulse, the script may mark ABSORPTION RISK.
If price breaks beyond the shock edge with weak relative volume, Detailed mode may mark THIN MOVE.
🧱 System Philosophy
The goal is not to make volume louder.
The goal is to make volume behavior more interpretable.
This script treats participation as a sequence:
shock → acceptance → follow-through → absorption or continuation.
🔐 Non-Promise Statement
No script can guarantee market direction.
No volume event guarantees continuation.
No absorption label guarantees reversal.
All outputs should be interpreted as analytical context.
📉 Risk Disclosure
Trading involves risk.
This script is for educational and analytical purposes only.
It does not provide financial advice, investment advice, or guaranteed trading outcomes.
Users are fully responsible for their own decisions, risk management, and trade execution.
📚 Educational Note
Use the script to study how markets behave after high-participation candles.
The most important question is not only whether volume appeared.
The better question is whether price continued to accept that participation afterward.
🧠 Core Idea
Did the volume shock bring real participation, or did the move get absorbed after the first impulse?
📌 Overview / What it does
Volume Participation Shock Map is a volume-flow interpretation tool designed to study what happens after a major participation candle appears.
The script identifies high-quality volume shocks by combining relative volume, candle body participation, ATR-adjusted range expansion, and close location. It then projects the active shock zone, tracks follow-through, detects absorption risk, highlights thin continuation attempts, and summarizes the current participation state in an AG Pro panel.
It does not predict price direction, automate trades, or claim that every high-volume candle will continue. It is a structured visualization tool for reading participation quality after volume events.
🎯 Purpose & Design Philosophy
Many volume tools stop at the first spike.
This script was built to answer the next question:
Did the market continue to participate after the shock, or was the impulse absorbed?
The design goal is to help traders separate meaningful volume expansion from one-bar excitement, thin breakouts, and failed participation.
⚡ Why This Script Is Different
Most tools focus on volume spikes, climax candles, or simple high-volume alerts.
This script does NOT treat high volume as automatically bullish or bearish.
Instead, it checks whether the candle had real body participation, whether price followed through beyond the shock zone, whether the move was absorbed back through the zone, and whether later breakouts happened with weak participation.
⚙️ Methodology
1. Shock Detection
The script compares current volume with recent average volume, checks candle body share, evaluates ATR-adjusted range expansion, and scores close location.
2. Shock Zone Mapping
When a qualified shock appears, the candle range becomes an active participation shock zone.
3. Follow-Through Evaluation
After the shock, the script watches whether price accepts beyond the shock high or low with enough relative volume.
4. Absorption Evaluation
If price closes back through the shock zone after the impulse, the script can mark absorption risk.
5. Visual Output
The chart displays the active shock zone, midpoint participation rail, event labels, right-side context tags, alerts, and a compact AG Pro panel.
🗺️ How to Read the Chart
Participation Shock Zone = the active high-volume candle range being evaluated.
Participation Rail = the midpoint of the shock zone.
BULL VOLUME SHOCK = a bullish shock candle with strong volume, body participation, and range expansion.
BEAR VOLUME SHOCK = a bearish shock candle with strong volume, body participation, and range expansion.
REAL FLOW CONTINUATION = price followed through beyond the shock zone with acceptable participation.
ABSORPTION RISK = price moved back through the shock zone after the initial impulse.
THIN MOVE = price moved beyond the shock edge without enough relative volume. This appears in Detailed label mode.
Panel = summarizes participation state, quality score, shock type, relative volume, body participation, follow-through, absorption risk, and next context.
🚦 Signals & States
• BULL VOLUME SHOCK → bullish high-participation impulse appeared.
• BEAR VOLUME SHOCK → bearish high-participation impulse appeared.
• REAL FLOW UP → bullish shock followed through with acceptable participation.
• REAL FLOW DOWN → bearish shock followed through with acceptable participation.
• BULL SHOCK ABSORBED → bullish shock lost participation back through the zone.
• BEAR SHOCK ABSORBED → bearish shock lost participation back through the zone.
• SHOCK WATCH → an active shock is still being evaluated.
• QUIET FLOW → no active participation shock is currently dominant.
🔔 Alerts Logic
Alerts trigger when a major participation state appears.
• Volume Participation Shock → a high-quality volume shock appears.
• Real-Flow Continuation → price follows through beyond the active shock zone with acceptable participation.
• Absorption Risk → price closes back through the active shock zone after the shock.
• Thin Move → price moves beyond the shock edge without enough relative volume.
Alerts are attention markers, not trade instructions.
🧩 Confluence Logic
The context becomes stronger when:
• Relative volume is clearly above normal
• Candle body participation is strong
• Candle range expands versus ATR
• Price closes near the directional side of the candle
• Follow-through appears before the evaluation window expires
• The panel state agrees with the chart label
If these elements do not align, the script avoids treating volume as automatic conviction.
📊 When to Use
• Breakout participation review
• Trend continuation validation
• Reversal impulse analysis
• High-volume candle interpretation
• Futures, stocks, forex, crypto, and liquid markets
• 15m, 30m, 1H, 4H, and 1D charts where volume data is meaningful
⚠️ When NOT to Use
• Symbols with unreliable or missing volume data
• Very low-liquidity markets
• Extremely noisy micro timeframes
• News spikes where volume behavior may be abnormal
• Markets where candle volume does not represent real participation well
• Situations where a single volume event should not be over-interpreted
🎛️ Key Inputs
• Relative Volume Length → defines the volume baseline.
• Shock Relative Volume → sets how strong volume must be before a shock can qualify.
• Minimum Body Participation % → controls how much candle body commitment is required.
• Minimum Range ATR → filters out small candles with high volume.
• Shock Quality Threshold → controls how selective the main shock labels are.
• Follow-Through Window → defines how long after a shock the script watches for continuation or absorption.
• Minimum Follow Relative Volume → defines whether continuation has enough participation.
• Absorption Midline Threshold % → controls how deeply price must return into the shock zone before absorption risk is marked.
• Event Label Mode → Premium focuses on major shock, continuation, and absorption events. Detailed also allows thin-move labels.
🖥️ Interface & Visual Design
The visual hierarchy is built around the active shock zone.
The zone shows the high-volume impulse range.
The midpoint rail helps judge acceptance versus absorption.
Event labels highlight the most important participation behavior.
Right-side tags keep the current shock context visible.
The AG Pro panel compresses the current state into a fast, readable decision-support summary.
🧪 Practical Usage Workflow
1. Read the panel participation state.
2. Check whether an active shock zone is present.
3. Watch whether price accepts beyond the shock high or low.
4. Evaluate whether follow-through has enough relative volume.
5. Watch for absorption back through the shock zone.
6. Confirm the chart context with structure, trend, liquidity, and risk planning.
🔍 Interpretation Guidelines
A volume shock is not automatically a valid trade signal.
Continuation is stronger when price accepts beyond the shock zone with participation.
Absorption matters when the first impulse cannot hold its zone.
Thin moves can warn that price is extending without enough participation.
The script is best used as a participation-reading layer, not as a standalone decision system.
🚫 What This Script Is NOT
This script is not a prediction engine.
It is not financial advice.
It is not an auto-trading system.
It does not provide guaranteed entry or exit signals.
It is not a simple volume spike alert.
⚠️ Limitations & Transparency
Volume quality depends on the symbol and market.
Crypto, futures, stocks, and forex may represent volume differently.
High volatility can create sudden shock labels that need broader context.
Low-liquidity assets may produce misleading relative volume readings.
Different timeframes may show different participation behavior.
🧠 Market Context Notes
Volume can be useful only when it is read together with price behavior.
A strong candle with high volume may show participation.
But if price cannot follow through, that same candle may become an absorption reference.
This script is designed to make that difference easier to see.
🧾 Use Case Examples
If a strong bullish candle appears with high relative volume, large body participation, and range expansion, the script may mark BULL VOLUME SHOCK.
If price later closes above the shock high with enough participation, the script may mark REAL FLOW CONTINUATION.
If price closes back through the shock zone after the impulse, the script may mark ABSORPTION RISK.
If price breaks beyond the shock edge with weak relative volume, Detailed mode may mark THIN MOVE.
🧱 System Philosophy
The goal is not to make volume louder.
The goal is to make volume behavior more interpretable.
This script treats participation as a sequence:
shock → acceptance → follow-through → absorption or continuation.
🔐 Non-Promise Statement
No script can guarantee market direction.
No volume event guarantees continuation.
No absorption label guarantees reversal.
All outputs should be interpreted as analytical context.
📉 Risk Disclosure
Trading involves risk.
This script is for educational and analytical purposes only.
It does not provide financial advice, investment advice, or guaranteed trading outcomes.
Users are fully responsible for their own decisions, risk management, and trade execution.
📚 Educational Note
Use the script to study how markets behave after high-participation candles.
The most important question is not only whether volume appeared.
The better question is whether price continued to accept that participation afterward.
Release Note
🔧 UPDATE NOTES - V1.1This update focuses on readability, panel contrast, label clarity, and cleaner public-release presentation.
The core purpose of the script remains unchanged.
This release improves how the existing volume shock logic is presented, organized, and interpreted on the chart.
This script continues to function as an analytical and visualization tool.
It does not attempt to predict price direction or provide guaranteed outcomes.
------------------------
What Changed
------------------------
• Refined on-chart participation labels.
Labels now use cleaner two-line text, premium casing, and contrast-aware text colors for improved readability.
• Improved active shock zone presentation.
The shock zone keeps a centered badge while avoiding hard-to-read text directly on transparent chart objects.
• Strengthened right-side context tags.
Shock high, shock low, and participation score tags now use clearer text and safer foreground colors.
• Rebuilt the AG Pro panel surface.
The panel now uses stronger dark-theme contrast, alternating rows, and the standard merged blue header row.
• Added event-label retention control.
Users can now control how many historical participation labels remain visible on the chart.
------------------------
Visual Improvements
------------------------
• Improved chart readability by adjusting labels, tags, spacing, and contrast
• Reduced visual clutter while keeping the chart active and informative
• Refined visual hierarchy so shock zones and follow-through states stand out more clearly
• Adjusted label wording to avoid oversized single-line text blocks
------------------------
Interface & Usability
------------------------
• Optimized panel layout for clearer information flow
• Improved label readability for better chart interaction
• Expanded panel location options for more flexible placement
• Enhanced overall user experience without changing core logic
------------------------
Behavior Notes
------------------------
This update does not change the core analytical logic of the script.
The goal is to improve clarity and usability, not to introduce new predictive behavior.
Users should interpret outputs the same way as before, but with improved visual structure.
------------------------
Limitations Reminder
------------------------
The script remains a rule-based analytical tool.
Market conditions such as volatility, liquidity, and timeframe differences may affect how signals appear.
Outputs should always be interpreted within broader market context.
------------------------
Risk Reminder
------------------------
This script is for educational and analytical purposes only.
It does not provide financial advice or guaranteed trading outcomes.
Users remain responsible for their own decisions.
Release Note
UPDATE NOTES - Version 1.2This update focuses on adding a confirmation-anchored proof layer to the panel.
The core purpose of the script remains unchanged.
This release adds a proof layer that measures how often volume shocks followed through in their
direction before being absorbed back through the shock midline.
This script continues to function as an analytical and visualization tool.
It does not attempt to predict price direction or provide guaranteed outcomes.
------------------------
What Changed
------------------------
* Added a Proof Layer (Follow / Hold / React / Flip)
The panel now reports how qualified volume shocks resolved on the current symbol and timeframe.
Each time a participation shock fires, price is tracked forward over a configurable horizon using
the shock zone as the structure (the shock midline is the absorption reference, and a continuation
of one risk unit in the shock direction is the reference target):
- Follow Rate : share of shocks that continued one risk unit in the shock direction first
- Hold Rate : share whose midline absorption reference was not lost through resolution
- React Rate : share that produced an early favorable follow-through reaction
- Flip Rate : share whose midline was lost, meaning the shock was absorbed back into the zone
A sample size (n) is shown so the rates are read in context, and they display as "building" only
until the first shock resolves.
* Added hidden proof outputs
The participation score and the Follow, Hold, React, and Flip rates are exported as hidden plots
so they can be used in alerts and screeners without adding chart clutter.
------------------------
Visual Improvements
------------------------
* Extended the panel with the proof layer below the existing workflow rows.
* Preserved the active shock zone, participation rail, curated event labels, right-side shock-high,
shock-low, and state tags, and the adaptive high-timeframe projection behavior.
* Kept label density controlled with the existing cooldown and retention limits.
------------------------
Behavior Notes
------------------------
This update does not change the core shock, participation, follow-through, or absorption logic.
The proof rates are descriptive statistics of volume shocks on the current symbol and timeframe.
They measure how often a shock continued in its direction before being absorbed, complementing the
live Follow-Through and Absorption Risk rows, which show the status of the current shock. The proof
rates do not change how shocks, zones, scores, states, or tags are produced.
Users should interpret outputs the same way as before, now with added reliability context.
------------------------
Limitations Reminder
------------------------
The script remains a rule-based analytical tool.
Proof rates depend on the available history and on how many shocks occurred on the current symbol
and timeframe; a small sample (low n) should be treated with caution. Each shock is counted once,
with the entry, midline reference, and risk-unit target frozen at the shock bar. Market conditions
such as volatility, liquidity, and timeframe differences may affect how shocks and rates appear.
Outputs should always be interpreted within broader market context.
------------------------
Risk Reminder
------------------------
This script is for educational and analytical purposes only.
It does not provide financial advice or guaranteed trading outcomes.
Users remain responsible for their own decisions.
Release Note
Version 1.3 — Publication Visual RefreshThis update refreshes the publication chart image to present volume shocks, participation quality, follow-through context, and absorption risk with a clearer visual hierarchy. The script’s analytical calculations, proof statistics, inputs, alerts, and runtime behavior remain unchanged.
• Updated the publication image to use a focused 1-hour chart where bullish volume shocks, real-flow continuation, absorption-risk events, and the active participation zone remain visible in one coherent sequence.
• Improved first-glance interpretation by keeping the projected shock zone, vertically and horizontally centered zone label, participation rail, shock boundaries, live score tag, and summary panel visible within one clean composition.
• Refined the visible time range to retain approximately five to six meaningful historical event labels while leaving sufficient open space around the active shock structure.
• Retained Premium event-label mode with Normal chart-label and panel font sizes for a balanced presentation that remains readable without covering price action.
• Preserved the dark chart, AGPro state colors, contrast-safe labels, and single-row blue panel title for consistent premium visual identity.
• Advanced the publication version to 1.3 for this visual refresh. No changes were made to shock qualification, participation scoring, follow-through detection, absorption logic, proof calculations, or alert conditions.
สคริปต์แบบโอเพนซอร์ส
ด้วยเจตนารมณ์หลักของ TradingView ผู้สร้างสคริปต์นี้ได้ทำให้เป็นโอเพนซอร์ส เพื่อให้เทรดเดอร์สามารถตรวจสอบและยืนยันฟังก์ชันการทำงานของมันได้ ขอชื่นชมผู้เขียน! แม้ว่าคุณจะใช้งานได้ฟรี แต่โปรดจำไว้ว่าการเผยแพร่โค้ดซ้ำจะต้องเป็นไปตาม กฎระเบียบการใช้งาน ของเรา

Trading Suite | Flagship Workflow :
tradingview.com/script/XJmX3p98-Trading-Suite-AGPro-Series/
Crypto Setup Planner | Multi-Symbol Analysis :
tradingview.com/script/LgVRo7Ql-Crypto-Setup-Planner-AGPro-Series/
tradingview.com/script/XJmX3p98-Trading-Suite-AGPro-Series/
Crypto Setup Planner | Multi-Symbol Analysis :
tradingview.com/script/LgVRo7Ql-Crypto-Setup-Planner-AGPro-Series/
คำจำกัดสิทธิ์ความรับผิดชอบ
ข้อมูลและบทความไม่ได้มีวัตถุประสงค์เพื่อก่อให้เกิดกิจกรรมทางการเงิน, การลงทุน, การซื้อขาย, ข้อเสนอแนะ หรือคำแนะนำประเภทอื่น ๆ ที่ให้หรือรับรองโดย TradingView อ่านเพิ่มเติมใน ข้อกำหนดการใช้งาน
สคริปต์แบบโอเพนซอร์ส
ด้วยเจตนารมณ์หลักของ TradingView ผู้สร้างสคริปต์นี้ได้ทำให้เป็นโอเพนซอร์ส เพื่อให้เทรดเดอร์สามารถตรวจสอบและยืนยันฟังก์ชันการทำงานของมันได้ ขอชื่นชมผู้เขียน! แม้ว่าคุณจะใช้งานได้ฟรี แต่โปรดจำไว้ว่าการเผยแพร่โค้ดซ้ำจะต้องเป็นไปตาม กฎระเบียบการใช้งาน ของเรา
Trading Suite | Flagship Workflow :
tradingview.com/script/XJmX3p98-Trading-Suite-AGPro-Series/
Crypto Setup Planner | Multi-Symbol Analysis :
tradingview.com/script/LgVRo7Ql-Crypto-Setup-Planner-AGPro-Series/
tradingview.com/script/XJmX3p98-Trading-Suite-AGPro-Series/
Crypto Setup Planner | Multi-Symbol Analysis :
tradingview.com/script/LgVRo7Ql-Crypto-Setup-Planner-AGPro-Series/
คำจำกัดสิทธิ์ความรับผิดชอบ
ข้อมูลและบทความไม่ได้มีวัตถุประสงค์เพื่อก่อให้เกิดกิจกรรมทางการเงิน, การลงทุน, การซื้อขาย, ข้อเสนอแนะ หรือคำแนะนำประเภทอื่น ๆ ที่ให้หรือรับรองโดย TradingView อ่านเพิ่มเติมใน ข้อกำหนดการใช้งาน