ที่อัปเดต:
TheStrat Full Timeframe Continuity (FTFC) vs Signals In-Force
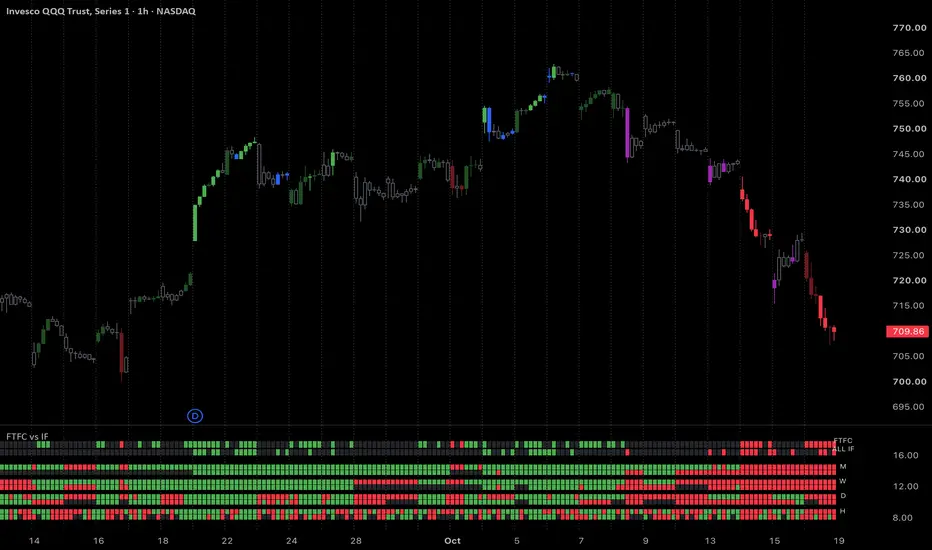
FTFC vs In Force puts two questions from TheStrat methodology (developed by Rob Smith) side by side on every bar, across the Hour, Day, Week and Month, and colors your candles by whether the answers agree.
1. Full Timeframe Continuity (FTFC): is every timeframe trading on the same side of its open?
2. All In Force: does every timeframe have a Strat signal that has triggered and is still holding, all pointing the same way?
This study shows, bar by bar, when they agree, when only one of them is true, and which timeframe is holding the other back.
DEFINITIONS
SIGNALS THAT COUNT (each can be switched off)
These are the same definitions and rules TheStrat Suite uses, with its FTFC and hammer/shooter filters off.
CANDLE COLORS (default: Agreement)
Green and red always mean bull and bear. For the cleanest look, hide the chart's own candles (Chart Settings > Symbol: uncheck Body, Borders and Wick). Other candle modes: Agreement, Solid (paints the chart's own candles, solid gray for neither), Agreement, Outlines (faded body with a full outline for FTFC only, hollow with a colored outline for In Force only), Body = FTFC / Outline = In Force (body filled when FTFC is aligned, outline colored when All In Force), FTFC Only, In Force Only, and Off.
THE PANE (HEATMAP)
OPTIONAL LAYERS (off by default)
HOW TO USE IT
Use a 1-hour or lower chart so all four timeframes count; timeframes below the chart's are skipped (the Hour on a daily chart, for example). Each timeframe can be switched off. Scan for where the bright candles start and stop, then use the heatmap to see which timeframe triggered last, or which one dropped out. Faded stretches show continuity without structure behind it; blue and purple stretches show structure that has triggered before price has cleared every open.
DOES IT REPAINT?
No. Each timeframe's forming candle is rebuilt from your chart's own candles (its running high and low since the period opened, and the chart candle's close as its price), and C1, C2 and the period open come from completed or period-stable data. Every historical bar is graded as things stood at that bar's close, not as the period finally closed. The live bar updates in real time, as any forming candle does.
KNOWN LIMITATIONS
OPEN SOURCE
Published under the Mozilla Public License 2.0 as a companion study to TheStrat Suite. Bar classification and hammer/shooter detection come from the open TheStratGrammar library.
This is a charting and learning tool, not financial advice. Trading involves risk.
1. Full Timeframe Continuity (FTFC): is every timeframe trading on the same side of its open?
2. All In Force: does every timeframe have a Strat signal that has triggered and is still holding, all pointing the same way?
This study shows, bar by bar, when they agree, when only one of them is true, and which timeframe is holding the other back.
DEFINITIONS
- Candle types: each candle is compared with the candle before it. 1 (inside) = stays within the prior candle's range. 2u = takes out the prior high only. 2d = takes out the prior low only. 3 (outside) = takes out both.
- C2, C1, CC: on each timeframe, CC is the current (forming) candle, C1 is the last closed candle, C2 is the one before it.
- Trigger: C1's high for a bullish signal, C1's low for a bearish one.
- Open: the opening price of the timeframe's current period (this hour, today, this week, this month).
- Above / below open: price above the period open counts as up; at or below counts as down.
- FTFC: every enabled timeframe up (bullish FTFC) or every one down (bearish FTFC). Anything mixed is not FTFC.
- Signal: one of the setups below, judged on C2, C1 and CC of that timeframe.
- In force: a signal whose CC has broken the trigger and price is still beyond it. If price falls back through the trigger, the signal drops out of force (and can re-enter). A Failing 2 is in force while its failure condition holds.
- All In Force: every enabled timeframe has a signal in force, all in the same direction. Signal type does not matter, only direction. A timeframe with nothing in force (an inside candle, a break with no qualifying setup, or a signal that lost its trigger) breaks it.
SIGNALS THAT COUNT (each can be switched off)
- Inside Reversal: C1 is inside (1) and CC breaks it against C2's direction, e.g. 2d-1-2u (bull) or 2u-1-2d (bear).
- Inside Continuation: C1 is inside and CC breaks it in C2's direction, e.g. 2u-1-2u.
- 2-2 Reversal: C1 was a 2 one way and CC breaks C1 the other way, e.g. 2d-2u.
- 2-2 Continuation: C1 was a 2 and CC breaks C1 the same way again, e.g. 2u-2u.
- 3-2 Expansion: C1 was an outside candle (3) and CC breaks one side of it, e.g. 3-2u.
- Hammer / Shooter: C1 is a hammer (long lower wick, rejected lower prices) and CC breaks its high, or a shooter (long upper wick) and CC breaks its low. Three definitions are available: Broad, Classic and Pin Bar.
- Failing 2 (Range Reclaim): CC broke one side of C1 but failed. F2u = broke the high, failed (bearish). F2d = broke the low, failed (bullish). Detection methods: Reclaim = CC closes back inside C1's range; Open = CC closes back through its own open; Reclaim + Open = both; Reclaim OR Open = either.
- Outside Bars (3): when CC has broken both sides of C1, allows a hammer or shooter signal to stay in force. Off = an outside CC never counts.
These are the same definitions and rules TheStrat Suite uses, with its FTFC and hammer/shooter filters off.
CANDLE COLORS (default: Agreement)
- Bright green / red: FTFC and All In Force agree, bullish / bearish.
- Faded green / red: FTFC only. Every timeframe is on the same side of its open, but not every timeframe has a signal in force.
- Blue / purple: All In Force only. Every timeframe has a signal in force up (blue) or down (purple), but price is not on the same side of every open.
- Hollow gray: neither. Every filled candle means something is aligned.
Green and red always mean bull and bear. For the cleanest look, hide the chart's own candles (Chart Settings > Symbol: uncheck Body, Borders and Wick). Other candle modes: Agreement, Solid (paints the chart's own candles, solid gray for neither), Agreement, Outlines (faded body with a full outline for FTFC only, hollow with a colored outline for In Force only), Body = FTFC / Outline = In Force (body filled when FTFC is aligned, outline colored when All In Force), FTFC Only, In Force Only, and Off.
THE PANE (HEATMAP)
- Top two rows: FTFC and ALL IF for each bar. Green = bull, red = bear, dim = not aligned.
- One band per timeframe (M, W, D, H): the top half shows above (green) or below (red) its open; the bottom half shows its signal in force, bull (green), bear (red) or none (dim).
- When a summary row goes dim, the timeframe band that is dim or opposite is the one holding it back.
OPTIONAL LAYERS (off by default)
- Score: columns show the net open count (+1 for each timeframe above its open, -1 for each below; full color only at FTFC). The white step line shows the net in-force count (+1 for each timeframe in force bull, -1 for each in force bear, 0 for none). Line on top of full columns = both agree. Full columns with the line near zero = continuity with nothing triggered.
- Cascade Ladder: a letter (H, D, W, M) on the bar where each timeframe goes in force, green below the bar for bull and red above for bear, stacked by timeframe so you can read the order in which timeframes trigger. First entry per period by default; Every Re-entry shows contested triggers chopping in and out.
- Stats Table: how often FTFC, All In Force and both together occurred over the closed bars loaded on your chart.
HOW TO USE IT
Use a 1-hour or lower chart so all four timeframes count; timeframes below the chart's are skipped (the Hour on a daily chart, for example). Each timeframe can be switched off. Scan for where the bright candles start and stop, then use the heatmap to see which timeframe triggered last, or which one dropped out. Faded stretches show continuity without structure behind it; blue and purple stretches show structure that has triggered before price has cleared every open.
DOES IT REPAINT?
No. Each timeframe's forming candle is rebuilt from your chart's own candles (its running high and low since the period opened, and the chart candle's close as its price), and C1, C2 and the period open come from completed or period-stable data. Every historical bar is graded as things stood at that bar's close, not as the period finally closed. The live bar updates in real time, as any forming candle does.
KNOWN LIMITATIONS
- History depth depends on your TradingView plan. No artificial limit is set.
- The first period of each timeframe at the left edge of the chart may be partial, because the forming candle is rebuilt only from bars that are loaded.
- Heikin Ashi charts are refused: TheStrat needs real candles.
OPEN SOURCE
Published under the Mozilla Public License 2.0 as a companion study to TheStrat Suite. Bar classification and hammer/shooter detection come from the open TheStratGrammar library.
This is a charting and learning tool, not financial advice. Trading involves risk.
Release Note
Bug fixes and optimizations.- Outside bars count as in force: a 3 closing above C1's high is in force bull, below C1's low in force bear. Closing back inside C1 is not in force.
- Score split: bull and bear counts plotted separately, so they no longer cancel out.
- Shared opens: the heatmap fades a timeframe's open when it shares it with a lower timeframe (Monday W = D, first trading day M = D, first hour D = H).
- Optional 15m and 30m timeframes, off by default.
- Cascade ladder now drawn as labels (most recent 500) to stay under the plot limit.
Thank you to Mike for the suggested fixes!

Tools for traders and investors smart enough to keep it simple 😘👌
➡️ SETUP SCREENER GUIDE: TheStratSuite.com/scanner/guide
🤑 TheStrat Suite is now FREE & open source: TheStratSuite.com
345strategies.com · github.com/345-strategies
➡️ SETUP SCREENER GUIDE: TheStratSuite.com/scanner/guide
🤑 TheStrat Suite is now FREE & open source: TheStratSuite.com
345strategies.com · github.com/345-strategies
คำจำกัดสิทธิ์ความรับผิดชอบ
ข้อมูลและบทความไม่ได้มีวัตถุประสงค์เพื่อก่อให้เกิดกิจกรรมทางการเงิน, การลงทุน, การซื้อขาย, ข้อเสนอแนะ หรือคำแนะนำประเภทอื่น ๆ ที่ให้หรือรับรองโดย TradingView อ่านเพิ่มเติมใน ข้อกำหนดการใช้งาน
Tools for traders and investors smart enough to keep it simple 😘👌
➡️ SETUP SCREENER GUIDE: TheStratSuite.com/scanner/guide
🤑 TheStrat Suite is now FREE & open source: TheStratSuite.com
345strategies.com · github.com/345-strategies
➡️ SETUP SCREENER GUIDE: TheStratSuite.com/scanner/guide
🤑 TheStrat Suite is now FREE & open source: TheStratSuite.com
345strategies.com · github.com/345-strategies
คำจำกัดสิทธิ์ความรับผิดชอบ
ข้อมูลและบทความไม่ได้มีวัตถุประสงค์เพื่อก่อให้เกิดกิจกรรมทางการเงิน, การลงทุน, การซื้อขาย, ข้อเสนอแนะ หรือคำแนะนำประเภทอื่น ๆ ที่ให้หรือรับรองโดย TradingView อ่านเพิ่มเติมใน ข้อกำหนดการใช้งาน