OPEN-SOURCE SCRIPT
Long-Term Growth Stock Scorer
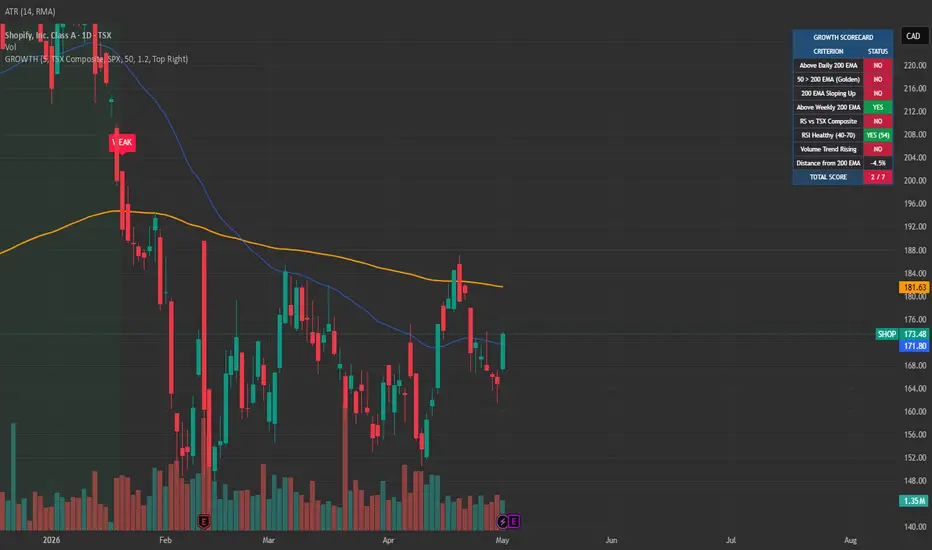
Long-Term Growth Stock Scorer plots a 7-criterion scoring system on any stock, identifying high-quality growth setups and signaling 200 EMA retest entries. Designed for long-term investors building positions in trending stocks with confirmed strength across trend, momentum, and participation.
THE 7-CRITERION SCORECARD
Each stock is scored 0-7 based on:
Price above daily 200 EMA — primary trend
50 EMA above 200 EMA — golden cross alignment
200 EMA sloping up — confirmed long-term uptrend
Price above weekly 200 EMA — multi-timeframe confirmation
Relative strength vs benchmark (S&P 500, NASDAQ 100, TSX Composite, FTSE, ASX, Russell 2000, or any custom symbol)
RSI in healthy range (40-70) — momentum quality, not exhausted
Volume trend rising — institutional participation expanding
SIGNALS
BUY label fires when a qualified stock (score >= threshold) retests its 200 EMA on volume
WEAK label fires when a held position drops below the qualification threshold
Background highlight when current score is in the qualified zone
Three built-in alerts: buy signal, score weakening, and score strengthening (entering the qualified zone)
FEATURES
Configurable benchmark index — works for any major market or custom symbol
Live dashboard showing each criterion's pass/fail status, current RSI value, and distance from 200 EMA
Six dashboard position options
Adjustable minimum score threshold (default 5/7)
Volume confirmation toggle for retest signals
HOW TO USE
Run on any stock chart on the daily timeframe. Set your benchmark to match the stock's market (S&P 500 for US stocks, TSX Composite for Canadian stocks, etc.). Use the dashboard to scan watchlist stocks for current qualification. When a qualified stock retests its 200 EMA on rising volume, the BUY signal fires.
Best used as a confirmation layer alongside fundamental analysis — strong technical setups need strong businesses underneath.
Open-source. Feedback and forks welcome.
THE 7-CRITERION SCORECARD
Each stock is scored 0-7 based on:
Price above daily 200 EMA — primary trend
50 EMA above 200 EMA — golden cross alignment
200 EMA sloping up — confirmed long-term uptrend
Price above weekly 200 EMA — multi-timeframe confirmation
Relative strength vs benchmark (S&P 500, NASDAQ 100, TSX Composite, FTSE, ASX, Russell 2000, or any custom symbol)
RSI in healthy range (40-70) — momentum quality, not exhausted
Volume trend rising — institutional participation expanding
SIGNALS
BUY label fires when a qualified stock (score >= threshold) retests its 200 EMA on volume
WEAK label fires when a held position drops below the qualification threshold
Background highlight when current score is in the qualified zone
Three built-in alerts: buy signal, score weakening, and score strengthening (entering the qualified zone)
FEATURES
Configurable benchmark index — works for any major market or custom symbol
Live dashboard showing each criterion's pass/fail status, current RSI value, and distance from 200 EMA
Six dashboard position options
Adjustable minimum score threshold (default 5/7)
Volume confirmation toggle for retest signals
HOW TO USE
Run on any stock chart on the daily timeframe. Set your benchmark to match the stock's market (S&P 500 for US stocks, TSX Composite for Canadian stocks, etc.). Use the dashboard to scan watchlist stocks for current qualification. When a qualified stock retests its 200 EMA on rising volume, the BUY signal fires.
Best used as a confirmation layer alongside fundamental analysis — strong technical setups need strong businesses underneath.
Open-source. Feedback and forks welcome.
สคริปต์แบบโอเพนซอร์ส
ด้วยเจตนารมณ์หลักของ TradingView ผู้สร้างสคริปต์นี้ได้ทำให้เป็นโอเพนซอร์ส เพื่อให้เทรดเดอร์สามารถตรวจสอบและยืนยันฟังก์ชันการทำงานของมันได้ ขอชื่นชมผู้เขียน! แม้ว่าคุณจะใช้งานได้ฟรี แต่โปรดจำไว้ว่าการเผยแพร่โค้ดซ้ำจะต้องเป็นไปตาม กฎระเบียบการใช้งาน ของเรา

คำจำกัดสิทธิ์ความรับผิดชอบ
ข้อมูลและบทความไม่ได้มีวัตถุประสงค์เพื่อก่อให้เกิดกิจกรรมทางการเงิน, การลงทุน, การซื้อขาย, ข้อเสนอแนะ หรือคำแนะนำประเภทอื่น ๆ ที่ให้หรือรับรองโดย TradingView อ่านเพิ่มเติมใน ข้อกำหนดการใช้งาน
สคริปต์แบบโอเพนซอร์ส
ด้วยเจตนารมณ์หลักของ TradingView ผู้สร้างสคริปต์นี้ได้ทำให้เป็นโอเพนซอร์ส เพื่อให้เทรดเดอร์สามารถตรวจสอบและยืนยันฟังก์ชันการทำงานของมันได้ ขอชื่นชมผู้เขียน! แม้ว่าคุณจะใช้งานได้ฟรี แต่โปรดจำไว้ว่าการเผยแพร่โค้ดซ้ำจะต้องเป็นไปตาม กฎระเบียบการใช้งาน ของเรา
คำจำกัดสิทธิ์ความรับผิดชอบ
ข้อมูลและบทความไม่ได้มีวัตถุประสงค์เพื่อก่อให้เกิดกิจกรรมทางการเงิน, การลงทุน, การซื้อขาย, ข้อเสนอแนะ หรือคำแนะนำประเภทอื่น ๆ ที่ให้หรือรับรองโดย TradingView อ่านเพิ่มเติมใน ข้อกำหนดการใช้งาน