OPEN-SOURCE SCRIPT
ES Breakout Toolkit ADX Regime Filter Free
=== PART OF THE ES BREAKOUT TOOLKIT ===
This is one of several free, standalone indicators that make up the ES Breakout Toolkit series. Each indicator isolates a single component used in the full ES London Breakout Pro strategy. They are designed to be useful on their own and educational for traders looking to filter trades by market regime using ADX.
=== WHAT THIS INDICATOR DOES ===
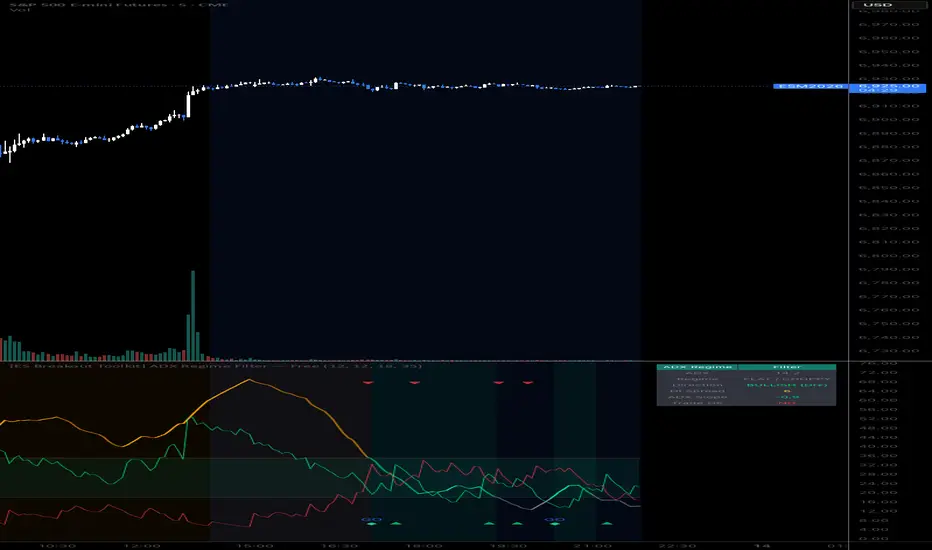
The ADX Regime Filter classifies the current market environment into three states: Flat/Choppy, Trending, and Overextended. It does this using the Average Directional Index (ADX) with configurable minimum and maximum thresholds that define a "sweet spot" where the market is trending enough to produce clean breakouts but not so extended that it is likely to reverse or stall.
The indicator plots ADX alongside DI+ and DI- lines, highlights the sweet spot zone between your min and max ADX values, and provides visual markers when ADX enters or exits each regime. DI crossovers are also marked to help identify directional shifts.
=== HOW TO USE IT ===
Apply this indicator to a separate pane below your chart. The shaded zone between the min and max ADX lines represents the regime where trend-following and breakout strategies tend to perform best. When ADX is below the minimum, the market is likely choppy and breakout signals are less reliable. When ADX is above the maximum, the trend may be overextended and new entries carry higher reversal risk.
The dashboard shows the current ADX value, regime classification, DI direction, DI spread, ADX slope, and an overall trade readiness assessment. The DI spread reading helps confirm whether the directional move has conviction — a narrow spread suggests indecision even if ADX is technically in range.
=== KEY FEATURES ===
- Three-state regime classification (Flat, Trending, Overextended)
- Configurable ADX sweet spot zone with visual fill
- DI+/DI- directional lines with crossover markers
- ADX slope tracking (rising vs falling momentum)
- Optional bar coloring by regime and direction
- Background shading by current state
- Dashboard with ADX, regime, direction, DI spread, slope, and trade readiness
- Alerts for regime transitions and DI crossovers
=== WHY ADX BOUNDARIES MATTER ===
Most traders using ADX only set a minimum threshold. However, extremely high ADX readings often indicate that a trend is mature and vulnerable to exhaustion. By defining both a floor and a ceiling, you can focus on the portion of the trend cycle where momentum is building rather than peaking. This indicator makes that concept visual and actionable.
=== ABOUT THE ES BREAKOUT TOOLKIT ===
This indicator is part of a free series that breaks down the building blocks of a London session ES futures breakout strategy. Other free indicators in the series cover session highlighting, consolidation range detection, breakout candle scanning, and momentum close analysis. Each is published separately on my profile.
The full ES London Breakout Pro indicator combines all of these components into a unified strategy with additional proprietary features including advanced risk management, trade qualification, and data tracking. It is available as an invite-only script on my profile. Use the access request instructions on that script's page if you are interested.
=== DISCLAIMER ===
This indicator is provided for educational and informational purposes only. It is NOT financial advice. It does not constitute a recommendation to buy, sell, or hold any financial instrument. Trading futures involves substantial risk of loss and is not suitable for all investors. Past performance of any indicator or strategy is not indicative of future results. Always conduct your own research and consult a qualified financial advisor before making any trading decisions. You are solely responsible for your own trading activity.
This is one of several free, standalone indicators that make up the ES Breakout Toolkit series. Each indicator isolates a single component used in the full ES London Breakout Pro strategy. They are designed to be useful on their own and educational for traders looking to filter trades by market regime using ADX.
=== WHAT THIS INDICATOR DOES ===
The ADX Regime Filter classifies the current market environment into three states: Flat/Choppy, Trending, and Overextended. It does this using the Average Directional Index (ADX) with configurable minimum and maximum thresholds that define a "sweet spot" where the market is trending enough to produce clean breakouts but not so extended that it is likely to reverse or stall.
The indicator plots ADX alongside DI+ and DI- lines, highlights the sweet spot zone between your min and max ADX values, and provides visual markers when ADX enters or exits each regime. DI crossovers are also marked to help identify directional shifts.
=== HOW TO USE IT ===
Apply this indicator to a separate pane below your chart. The shaded zone between the min and max ADX lines represents the regime where trend-following and breakout strategies tend to perform best. When ADX is below the minimum, the market is likely choppy and breakout signals are less reliable. When ADX is above the maximum, the trend may be overextended and new entries carry higher reversal risk.
The dashboard shows the current ADX value, regime classification, DI direction, DI spread, ADX slope, and an overall trade readiness assessment. The DI spread reading helps confirm whether the directional move has conviction — a narrow spread suggests indecision even if ADX is technically in range.
=== KEY FEATURES ===
- Three-state regime classification (Flat, Trending, Overextended)
- Configurable ADX sweet spot zone with visual fill
- DI+/DI- directional lines with crossover markers
- ADX slope tracking (rising vs falling momentum)
- Optional bar coloring by regime and direction
- Background shading by current state
- Dashboard with ADX, regime, direction, DI spread, slope, and trade readiness
- Alerts for regime transitions and DI crossovers
=== WHY ADX BOUNDARIES MATTER ===
Most traders using ADX only set a minimum threshold. However, extremely high ADX readings often indicate that a trend is mature and vulnerable to exhaustion. By defining both a floor and a ceiling, you can focus on the portion of the trend cycle where momentum is building rather than peaking. This indicator makes that concept visual and actionable.
=== ABOUT THE ES BREAKOUT TOOLKIT ===
This indicator is part of a free series that breaks down the building blocks of a London session ES futures breakout strategy. Other free indicators in the series cover session highlighting, consolidation range detection, breakout candle scanning, and momentum close analysis. Each is published separately on my profile.
The full ES London Breakout Pro indicator combines all of these components into a unified strategy with additional proprietary features including advanced risk management, trade qualification, and data tracking. It is available as an invite-only script on my profile. Use the access request instructions on that script's page if you are interested.
=== DISCLAIMER ===
This indicator is provided for educational and informational purposes only. It is NOT financial advice. It does not constitute a recommendation to buy, sell, or hold any financial instrument. Trading futures involves substantial risk of loss and is not suitable for all investors. Past performance of any indicator or strategy is not indicative of future results. Always conduct your own research and consult a qualified financial advisor before making any trading decisions. You are solely responsible for your own trading activity.
สคริปต์แบบโอเพนซอร์ส
ด้วยเจตนารมณ์หลักของ TradingView ผู้สร้างสคริปต์นี้ได้ทำให้เป็นโอเพนซอร์ส เพื่อให้เทรดเดอร์สามารถตรวจสอบและยืนยันฟังก์ชันการทำงานของมันได้ ขอชื่นชมผู้เขียน! แม้ว่าคุณจะใช้งานได้ฟรี แต่โปรดจำไว้ว่าการเผยแพร่โค้ดซ้ำจะต้องเป็นไปตาม กฎระเบียบการใช้งาน ของเรา

คำจำกัดสิทธิ์ความรับผิดชอบ
ข้อมูลและบทความไม่ได้มีวัตถุประสงค์เพื่อก่อให้เกิดกิจกรรมทางการเงิน, การลงทุน, การซื้อขาย, ข้อเสนอแนะ หรือคำแนะนำประเภทอื่น ๆ ที่ให้หรือรับรองโดย TradingView อ่านเพิ่มเติมใน ข้อกำหนดการใช้งาน
สคริปต์แบบโอเพนซอร์ส
ด้วยเจตนารมณ์หลักของ TradingView ผู้สร้างสคริปต์นี้ได้ทำให้เป็นโอเพนซอร์ส เพื่อให้เทรดเดอร์สามารถตรวจสอบและยืนยันฟังก์ชันการทำงานของมันได้ ขอชื่นชมผู้เขียน! แม้ว่าคุณจะใช้งานได้ฟรี แต่โปรดจำไว้ว่าการเผยแพร่โค้ดซ้ำจะต้องเป็นไปตาม กฎระเบียบการใช้งาน ของเรา
คำจำกัดสิทธิ์ความรับผิดชอบ
ข้อมูลและบทความไม่ได้มีวัตถุประสงค์เพื่อก่อให้เกิดกิจกรรมทางการเงิน, การลงทุน, การซื้อขาย, ข้อเสนอแนะ หรือคำแนะนำประเภทอื่น ๆ ที่ให้หรือรับรองโดย TradingView อ่านเพิ่มเติมใน ข้อกำหนดการใช้งาน