ที่อัปเดต:
VietRoadie's RVol Label
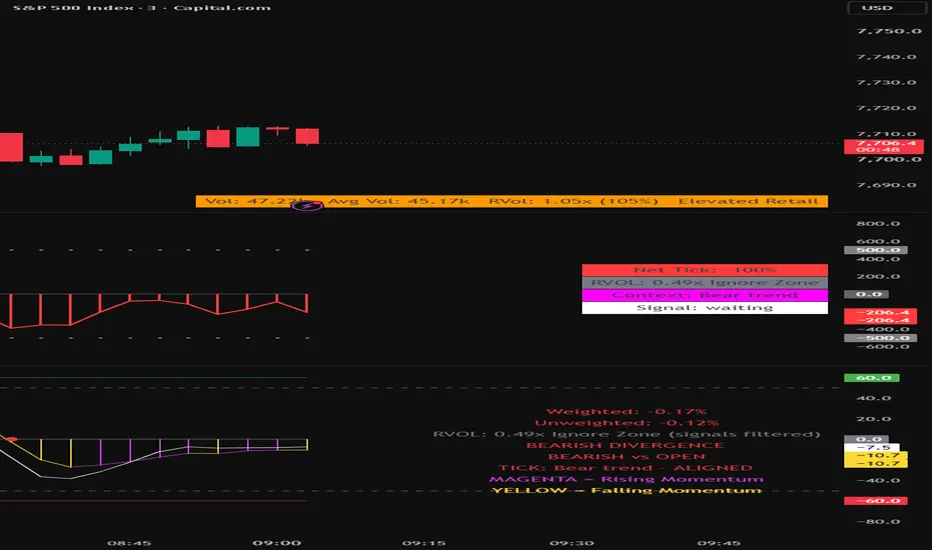
How the label is calculated
On an intraday or daily chart, the label compares the current day's cumulative volume with the average volume of the previous 20 completed days:
RVol = current daily volume / average(previous 20 daily volumes)
On a weekly chart, the calculation instead uses current-week volume against previous completed weeks; on a monthly chart, it uses current-month volume against previous completed months. The indicator does not compare the current 1-minute or 3-minute bar with the same clock-minute bar on earlier days.
The label reads Vol: … Avg Vol: … RVol: …x (…%) [zone]:
Field Meaning
Vol Accumulated volume for the current day, week, or month of the chart symbol
Avg Vol Average total volume for the previous Relative Volume Length completed periods
RVol Current period volume divided by Avg Vol; 1.00x means equal to that full-period average
% RVol multiplied by 100 and rounded to a whole percent
For example, Vol: 30 Mil Avg Vol: 40 Mil RVol: 0.75x (75%) means the current period has traded 75% of the volume of an average completed period. Early in the session, a reading below 1.00x is normal because the current day is still forming. The label changes as volume accumulates; compare it with full-day average at the end of the day, not as a same-time participation gauge.
Color zones
RVol Label zone Label color
Below 1.00x Ignore Zone Gray
1.00x through 1.50x Elevated Retail Orange
Above 1.50x through 2.00x Momentum Build Green (partly transparent)
Above 2.00x Strong BO, Big Institutional Acculumation Green
These are indicator labels, not guarantees of trade quality or evidence of who traded.
Inputs
Input Default Effect
Relative Volume Length 20 Number of prior completed days, weeks, or months in the full-period average
Text Size auto Label font size
Panel position top / center Label placement: vertical top, middle, or bottom; horizontal left, center, or right
Show Selected Bar RVol Line Off Displays the separate Each Bar RVol plot in red
The optional Each Bar RVol line is a different measure: the chart bar's volume divided by the average volume of the previous 20 chart bars, multiplied by 100. At 150, the current chart bar traded 1.5 times the recent bar-volume average. This plot uses the chart timeframe, not the same-clock-time average over prior sessions. Because the indicator overlays price, enabling this percentage plot may affect the chart's scale.
Compared with IceBerg and Weighted A/D RVOL
The IceBerg TICK and Weighted SPX Sectors A/D RVOL filters use SPY volume at the same clock time across earlier sessions. Their readings are intended to assess participation at this point in the day; this label assesses accumulated volume against an entire average day (or week/month). They are different quantities and should not be expected to match, even on a SPY chart.
For SPX, which has no meaningful exchange-traded share volume, use a liquid proxy such as a SPY chart if you want this label to reflect equity volume. The label does not automatically substitute SPY on an SPX chart.
Data notes: Before enough completed periods exist, or if the symbol has no usable volume or the average is zero, RVol may be unavailable (na). On historical intraday candles, TradingView's higher-timeframe data merging can display the daily value only when that day's bar is available; use the live label for an in-progress reading. This indicator is context, not a standalone entry signal.
On an intraday or daily chart, the label compares the current day's cumulative volume with the average volume of the previous 20 completed days:
RVol = current daily volume / average(previous 20 daily volumes)
On a weekly chart, the calculation instead uses current-week volume against previous completed weeks; on a monthly chart, it uses current-month volume against previous completed months. The indicator does not compare the current 1-minute or 3-minute bar with the same clock-minute bar on earlier days.
The label reads Vol: … Avg Vol: … RVol: …x (…%) [zone]:
Field Meaning
Vol Accumulated volume for the current day, week, or month of the chart symbol
Avg Vol Average total volume for the previous Relative Volume Length completed periods
RVol Current period volume divided by Avg Vol; 1.00x means equal to that full-period average
% RVol multiplied by 100 and rounded to a whole percent
For example, Vol: 30 Mil Avg Vol: 40 Mil RVol: 0.75x (75%) means the current period has traded 75% of the volume of an average completed period. Early in the session, a reading below 1.00x is normal because the current day is still forming. The label changes as volume accumulates; compare it with full-day average at the end of the day, not as a same-time participation gauge.
Color zones
RVol Label zone Label color
Below 1.00x Ignore Zone Gray
1.00x through 1.50x Elevated Retail Orange
Above 1.50x through 2.00x Momentum Build Green (partly transparent)
Above 2.00x Strong BO, Big Institutional Acculumation Green
These are indicator labels, not guarantees of trade quality or evidence of who traded.
Inputs
Input Default Effect
Relative Volume Length 20 Number of prior completed days, weeks, or months in the full-period average
Text Size auto Label font size
Panel position top / center Label placement: vertical top, middle, or bottom; horizontal left, center, or right
Show Selected Bar RVol Line Off Displays the separate Each Bar RVol plot in red
The optional Each Bar RVol line is a different measure: the chart bar's volume divided by the average volume of the previous 20 chart bars, multiplied by 100. At 150, the current chart bar traded 1.5 times the recent bar-volume average. This plot uses the chart timeframe, not the same-clock-time average over prior sessions. Because the indicator overlays price, enabling this percentage plot may affect the chart's scale.
Compared with IceBerg and Weighted A/D RVOL
The IceBerg TICK and Weighted SPX Sectors A/D RVOL filters use SPY volume at the same clock time across earlier sessions. Their readings are intended to assess participation at this point in the day; this label assesses accumulated volume against an entire average day (or week/month). They are different quantities and should not be expected to match, even on a SPY chart.
For SPX, which has no meaningful exchange-traded share volume, use a liquid proxy such as a SPY chart if you want this label to reflect equity volume. The label does not automatically substitute SPY on an SPX chart.
Data notes: Before enough completed periods exist, or if the symbol has no usable volume or the average is zero, RVol may be unavailable (na). On historical intraday candles, TradingView's higher-timeframe data merging can display the daily value only when that day's bar is available; use the live label for an in-progress reading. This indicator is context, not a standalone entry signal.
Release Note
listing all nine standard docking positions: top, middle, and bottom, each with left, center, and right alignment.
คำจำกัดสิทธิ์ความรับผิดชอบ
ข้อมูลและบทความไม่ได้มีวัตถุประสงค์เพื่อก่อให้เกิดกิจกรรมทางการเงิน, การลงทุน, การซื้อขาย, ข้อเสนอแนะ หรือคำแนะนำประเภทอื่น ๆ ที่ให้หรือรับรองโดย TradingView อ่านเพิ่มเติมใน ข้อกำหนดการใช้งาน
คำจำกัดสิทธิ์ความรับผิดชอบ
ข้อมูลและบทความไม่ได้มีวัตถุประสงค์เพื่อก่อให้เกิดกิจกรรมทางการเงิน, การลงทุน, การซื้อขาย, ข้อเสนอแนะ หรือคำแนะนำประเภทอื่น ๆ ที่ให้หรือรับรองโดย TradingView อ่านเพิ่มเติมใน ข้อกำหนดการใช้งาน