Percentile Momentum Rotation [Pineify]
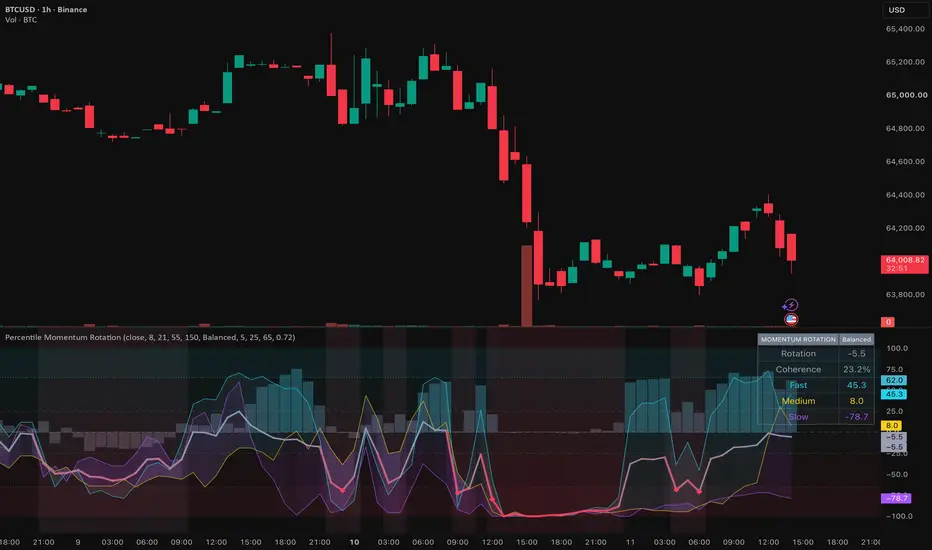
Percentile Momentum Rotation
Overview
Percentile Momentum Rotation is a Pine Script v6 oscillator that converts fast, medium, and slow rate of change into a comparable spectrum. It shows a centered score, horizon coherence, a fast-slow wave, and a dashboard for momentum context rather than prediction.
Problem Definition
Raw ROC is a percentage return over one window. An 8-bar ROC has a different range from a 55-bar ROC, and the same value can be ordinary in a volatile regime but unusual in a quiet one. Averaging raw readings lets the largest horizon dominate, while fixed thresholds change meaning with the distribution. The design must retain each horizon's information but remove its local scale before combination.
Design Rationale
Each ROC is ranked against its own history and centered from -100 to +100, avoiding an assumption of normal returns. A z-score was rejected because outliers can distort its mean and deviation; a raw blend was rejected because it keeps the scale mismatch. The centroid is discounted when horizon polarities disagree or ranks spread apart. This favors coherent states but reacts less to an early one-window turn. The visual hierarchy follows these variables: primary score first, explanatory layers second.
Key Features
How It Works
The script calculates percentage ROC over fast, medium, and slow lengths. ta.percentrank compares each current ROC with its configured history. Percentile 50 maps to zero, 100 to +100, and 0 to -100. Positive therefore means high versus that horizon's recent distribution; it does not guarantee a positive raw return.
The centered ranks form a weighted centroid; the three profiles shift emphasis across horizons. Polarity checks whether ranks share a side outside the dead zone, while compactness measures dispersion. Their 0-to-1 coherence controls a 0.55-to-1.00 consistency factor applied to the score.
The wave is half the fast-minus-slow rank difference. Color encodes score direction, halo intensity encodes coherence, and fan width shows dispersion. Output remains empty through warm-up. Visuals update intrabar; diamonds and alerts require bar close.
How Multiple Indicators Work Together
This is one pipeline, not a mashup. ROC supplies horizon change; percentile rank removes local scale; the centroid summarizes location; polarity and dispersion test coherence; and the consistency factor forms the score. The wave exposes lead-lag behavior that the centroid hides, while the fan visualizes disagreement. Removing a stage either removes momentum, restores the comparability problem, or hides confidence.
Trading Ideas and Insights
Upper and lower states organize review of relative momentum expansion. Synchronization means all horizons are unusual versus their own histories, not that a trade must follow. The wave reveals whether fast momentum leads or lags the slow horizon; repeated zero crossings describe unstable context. Confirm with independent structure and risk controls.
Unique Aspects
ROC and percentile rank are standard; the contribution is their information architecture. Each horizon is normalized against itself, then the composite is discounted by both side agreement and compactness. It separates historical location, synchronization, and lead-lag rotation; the same variables control halo, fan, and wave. No retrieved code is reproduced.
How to Use
Customization
Short ROC windows react faster but rotate more often; long windows add persistence and lag. Longer percentile history provides broader context but adapts more slowly after regime shifts. The dead zone sets how much near-median movement is directionless. Rotation thresholds define context and extremes; Synchronization Threshold sets required agreement. Weight profiles change the analytical question, so comparisons should keep settings consistent.
Assumptions and Limitations
The source and available history must be representative enough for ranking. Percentiles are relative: a high rank can occur while raw returns are negative if the decline is milder than recent declines. Results depend on lengths, lookback, and structural breaks. It is lagging and omits volume, execution, fundamentals, and structure. Visuals can change before close; alerts wait for confirmation. No future values or external data are used, but this does not establish performance.
Conclusion
Percentile Momentum Rotation turns incompatible ROC scales into an auditable spectrum. It keeps relative location, coherence, and lead-lag rotation distinct but connected, helping diagnose momentum context without treating thresholds as guaranteed entries.
Overview
Percentile Momentum Rotation is a Pine Script v6 oscillator that converts fast, medium, and slow rate of change into a comparable spectrum. It shows a centered score, horizon coherence, a fast-slow wave, and a dashboard for momentum context rather than prediction.
Problem Definition
Raw ROC is a percentage return over one window. An 8-bar ROC has a different range from a 55-bar ROC, and the same value can be ordinary in a volatile regime but unusual in a quiet one. Averaging raw readings lets the largest horizon dominate, while fixed thresholds change meaning with the distribution. The design must retain each horizon's information but remove its local scale before combination.
Design Rationale
Each ROC is ranked against its own history and centered from -100 to +100, avoiding an assumption of normal returns. A z-score was rejected because outliers can distort its mean and deviation; a raw blend was rejected because it keeps the scale mismatch. The centroid is discounted when horizon polarities disagree or ranks spread apart. This favors coherent states but reacts less to an early one-window turn. The visual hierarchy follows these variables: primary score first, explanatory layers second.
Key Features
- Three independently normalized ROC percentile streams.
- A coherence-weighted composite and fast-slow rotation wave.
- A state-colored spectrum, horizon fan, confirmed alerts, and dashboard.
- Balanced, fast-focus, and slow-focus weighting.
How It Works
The script calculates percentage ROC over fast, medium, and slow lengths. ta.percentrank compares each current ROC with its configured history. Percentile 50 maps to zero, 100 to +100, and 0 to -100. Positive therefore means high versus that horizon's recent distribution; it does not guarantee a positive raw return.
The centered ranks form a weighted centroid; the three profiles shift emphasis across horizons. Polarity checks whether ranks share a side outside the dead zone, while compactness measures dispersion. Their 0-to-1 coherence controls a 0.55-to-1.00 consistency factor applied to the score.
The wave is half the fast-minus-slow rank difference. Color encodes score direction, halo intensity encodes coherence, and fan width shows dispersion. Output remains empty through warm-up. Visuals update intrabar; diamonds and alerts require bar close.
How Multiple Indicators Work Together
This is one pipeline, not a mashup. ROC supplies horizon change; percentile rank removes local scale; the centroid summarizes location; polarity and dispersion test coherence; and the consistency factor forms the score. The wave exposes lead-lag behavior that the centroid hides, while the fan visualizes disagreement. Removing a stage either removes momentum, restores the comparability problem, or hides confidence.
Trading Ideas and Insights
Upper and lower states organize review of relative momentum expansion. Synchronization means all horizons are unusual versus their own histories, not that a trade must follow. The wave reveals whether fast momentum leads or lags the slow horizon; repeated zero crossings describe unstable context. Confirm with independent structure and risk controls.
Unique Aspects
ROC and percentile rank are standard; the contribution is their information architecture. Each horizon is normalized against itself, then the composite is discounted by both side agreement and compactness. It separates historical location, synchronization, and lead-lag rotation; the same variables control halo, fan, and wave. No retrieved code is reproduced.
How to Use
- Allow the slow ROC plus percentile history to warm up.
- Start with Balanced and read score, coherence, and wave together.
- Treat synchronization as context, then assess price structure and risk separately.
- Use confirmed alerts; current-bar plots may move before close.
- Disable secondary layers for a cleaner chart.
Customization
Short ROC windows react faster but rotate more often; long windows add persistence and lag. Longer percentile history provides broader context but adapts more slowly after regime shifts. The dead zone sets how much near-median movement is directionless. Rotation thresholds define context and extremes; Synchronization Threshold sets required agreement. Weight profiles change the analytical question, so comparisons should keep settings consistent.
Assumptions and Limitations
The source and available history must be representative enough for ranking. Percentiles are relative: a high rank can occur while raw returns are negative if the decline is milder than recent declines. Results depend on lengths, lookback, and structural breaks. It is lagging and omits volume, execution, fundamentals, and structure. Visuals can change before close; alerts wait for confirmation. No future values or external data are used, but this does not establish performance.
Conclusion
Percentile Momentum Rotation turns incompatible ROC scales into an auditable spectrum. It keeps relative location, coherence, and lead-lag rotation distinct but connected, helping diagnose momentum context without treating thresholds as guaranteed entries.

🚀🚀🚀 Pineify - pineify.app
Essential Toolkit for Every Trader
- AI Pine Script Generator
- Finance AI Agent
- AI Stock Picker
- Pine Script Visual Editor
- Invited indicators
- Strategy Optimizer
- Trading Journal
- Backtest Report
Essential Toolkit for Every Trader
- AI Pine Script Generator
- Finance AI Agent
- AI Stock Picker
- Pine Script Visual Editor
- Invited indicators
- Strategy Optimizer
- Trading Journal
- Backtest Report
คำจำกัดสิทธิ์ความรับผิดชอบ
ข้อมูลและบทความไม่ได้มีวัตถุประสงค์เพื่อก่อให้เกิดกิจกรรมทางการเงิน, การลงทุน, การซื้อขาย, ข้อเสนอแนะ หรือคำแนะนำประเภทอื่น ๆ ที่ให้หรือรับรองโดย TradingView อ่านเพิ่มเติมใน ข้อกำหนดการใช้งาน
🚀🚀🚀 Pineify - pineify.app
Essential Toolkit for Every Trader
- AI Pine Script Generator
- Finance AI Agent
- AI Stock Picker
- Pine Script Visual Editor
- Invited indicators
- Strategy Optimizer
- Trading Journal
- Backtest Report
Essential Toolkit for Every Trader
- AI Pine Script Generator
- Finance AI Agent
- AI Stock Picker
- Pine Script Visual Editor
- Invited indicators
- Strategy Optimizer
- Trading Journal
- Backtest Report
คำจำกัดสิทธิ์ความรับผิดชอบ
ข้อมูลและบทความไม่ได้มีวัตถุประสงค์เพื่อก่อให้เกิดกิจกรรมทางการเงิน, การลงทุน, การซื้อขาย, ข้อเสนอแนะ หรือคำแนะนำประเภทอื่น ๆ ที่ให้หรือรับรองโดย TradingView อ่านเพิ่มเติมใน ข้อกำหนดการใช้งาน