ETFSI Trend Stack
ETFSI Trend Stack
FOR WEEKLY CHARTS. This indicator is designed and tuned for use on a weekly chart. All lengths are in bars, so on a daily or intraday chart the 20/50/100/200 settings mean something very different and the signals will not read the same way. The panel header turns orange and says
"DESIGNED FOR WEEKLY CHARTS" if it is loaded on any other timeframe.
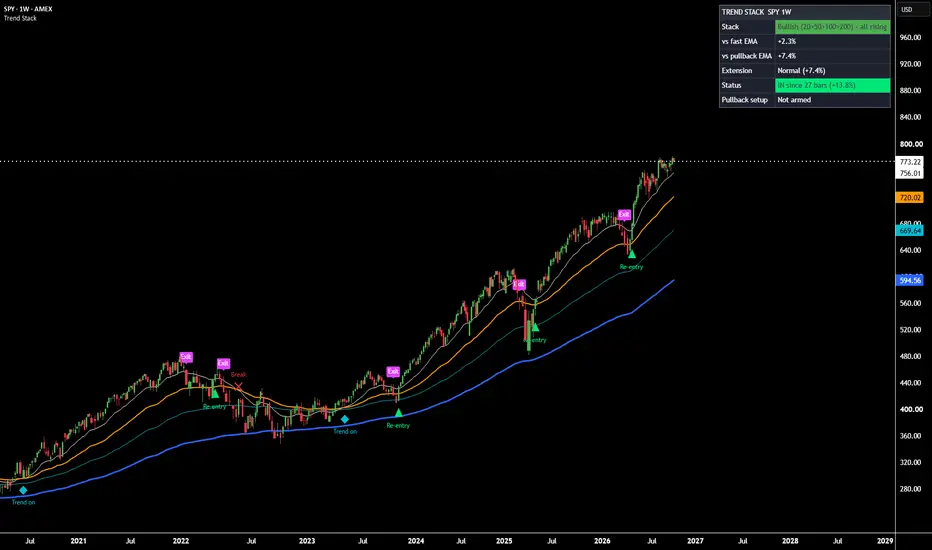
Trend Stack reads the trend the way many longer-term traders already look at a weekly chart: four exponential moving averages (20, 50, 100 and 200 weeks) and where price sits relative to them. It turns that picture into a small set of labels and a status panel, so you can see at a glance whether the trend is intact, whether a pullback has finished, and when the trend has actually broken.
WHERE IT WORKS BEST
Broad market indexes (SPY, QQQ, IWM) and sector or thematic ETFs that are trending. It is a trend tool: in sideways, range-bound markets it will flip between Exit and Re-entry, and no setting fully removes that. Seeing those flips is itself information: the trend is not there.
HOW IT READS THE TREND
Stack. When the 20 is above the 50, the 50 above the 100, and the 100 above the 200, the stack is fully bullish. Fully inverted is bearish. Anything else is mixed. The panel also flags when all four EMAs are rising.
Trend on / Break. The trend is switched on when the 20 crosses above the 50 (aqua diamond, "Trend on") and switched off when it crosses below (red X, "Break"). While the trend is off, no re-entry labels appear. This keeps the indicator quiet through bear markets such as 2022.
SIGNALS
Re-entry (green triangle). Two ways a re-entry is marked while the trend is on:
1. Pullback re-entry: price pulls back to the 50 EMA (the low comes within a set % of it), then closes back above the 20 EMA within a set number of bars.
2. Trend re-entry: price closes back above the 20 EMA while all four EMAs are sloping up.
Exit (purple label). After a re-entry or Trend on, an Exit is marked on the first weekly close more than 1 ATR (14-week Average True Range) below the 20 EMA. Measuring the buffer in ATR lets it adapt to each chart: on SPY one weekly ATR is roughly 2.5 to 3%, while on a volatile stock or ETF it widens automatically, so ordinary weekly noise does not trigger an exit. Alternative exit rules in settings: a fixed % below the 20, any close below the 20, or N closes in a row below the 20. A Break also ends the position.
Extended (optional, off by default). Marks the first bar of a run where price is more than 15% above the 50 EMA (or the 20 if you choose). Markets can stay extended for a long time, so this is information, not an exit.
PANEL
Stack state and whether all EMAs are rising; distance from the 20 and the 50; extension status; IN / OUT status with bars held and % change since the last signal; and whether a pullback setup is armed or switched off after a Break. Panel position (8 locations) and text size (Tiny to Large) are configurable.
ALERTS
Pullback re-entry, Exit, Trend break, Trend on, Over-extended.
DEFAULT SETTINGS
EMA lengths 20 / 50 / 100 / 200. Pullback touch tolerance 1%, max 8 bars from touch to re-entry, minimum 6 bars between re-entry labels, long-term filter (50 above 200). Exit: close more than 1 ATR (14) below the 20. Slope lookback 3 bars. Extension 15% above the 50 (labels off).
NOTES
Labels are drawn on confirmed (closed) weekly bars only, so they do not repaint once the bar is complete. During the live, unfinished week the panel reflects current prices and can change until the weekly close.
This is a chart-reading tool. It has not been tested as a trading system, and the labels are observations, not recommendations to buy or sell. Past behavior on any chart does not guarantee future results.
Open-source under MPL-2.0. Trade_Logic1019 / ETF Sector Intelligence.
FOR WEEKLY CHARTS. This indicator is designed and tuned for use on a weekly chart. All lengths are in bars, so on a daily or intraday chart the 20/50/100/200 settings mean something very different and the signals will not read the same way. The panel header turns orange and says
"DESIGNED FOR WEEKLY CHARTS" if it is loaded on any other timeframe.
Trend Stack reads the trend the way many longer-term traders already look at a weekly chart: four exponential moving averages (20, 50, 100 and 200 weeks) and where price sits relative to them. It turns that picture into a small set of labels and a status panel, so you can see at a glance whether the trend is intact, whether a pullback has finished, and when the trend has actually broken.
WHERE IT WORKS BEST
Broad market indexes (SPY, QQQ, IWM) and sector or thematic ETFs that are trending. It is a trend tool: in sideways, range-bound markets it will flip between Exit and Re-entry, and no setting fully removes that. Seeing those flips is itself information: the trend is not there.
HOW IT READS THE TREND
Stack. When the 20 is above the 50, the 50 above the 100, and the 100 above the 200, the stack is fully bullish. Fully inverted is bearish. Anything else is mixed. The panel also flags when all four EMAs are rising.
Trend on / Break. The trend is switched on when the 20 crosses above the 50 (aqua diamond, "Trend on") and switched off when it crosses below (red X, "Break"). While the trend is off, no re-entry labels appear. This keeps the indicator quiet through bear markets such as 2022.
SIGNALS
Re-entry (green triangle). Two ways a re-entry is marked while the trend is on:
1. Pullback re-entry: price pulls back to the 50 EMA (the low comes within a set % of it), then closes back above the 20 EMA within a set number of bars.
2. Trend re-entry: price closes back above the 20 EMA while all four EMAs are sloping up.
Exit (purple label). After a re-entry or Trend on, an Exit is marked on the first weekly close more than 1 ATR (14-week Average True Range) below the 20 EMA. Measuring the buffer in ATR lets it adapt to each chart: on SPY one weekly ATR is roughly 2.5 to 3%, while on a volatile stock or ETF it widens automatically, so ordinary weekly noise does not trigger an exit. Alternative exit rules in settings: a fixed % below the 20, any close below the 20, or N closes in a row below the 20. A Break also ends the position.
Extended (optional, off by default). Marks the first bar of a run where price is more than 15% above the 50 EMA (or the 20 if you choose). Markets can stay extended for a long time, so this is information, not an exit.
PANEL
Stack state and whether all EMAs are rising; distance from the 20 and the 50; extension status; IN / OUT status with bars held and % change since the last signal; and whether a pullback setup is armed or switched off after a Break. Panel position (8 locations) and text size (Tiny to Large) are configurable.
ALERTS
Pullback re-entry, Exit, Trend break, Trend on, Over-extended.
DEFAULT SETTINGS
EMA lengths 20 / 50 / 100 / 200. Pullback touch tolerance 1%, max 8 bars from touch to re-entry, minimum 6 bars between re-entry labels, long-term filter (50 above 200). Exit: close more than 1 ATR (14) below the 20. Slope lookback 3 bars. Extension 15% above the 50 (labels off).
NOTES
Labels are drawn on confirmed (closed) weekly bars only, so they do not repaint once the bar is complete. During the live, unfinished week the panel reflects current prices and can change until the weekly close.
This is a chart-reading tool. It has not been tested as a trading system, and the labels are observations, not recommendations to buy or sell. Past behavior on any chart does not guarantee future results.
Open-source under MPL-2.0. Trade_Logic1019 / ETF Sector Intelligence.

คำจำกัดสิทธิ์ความรับผิดชอบ
ข้อมูลและบทความไม่ได้มีวัตถุประสงค์เพื่อก่อให้เกิดกิจกรรมทางการเงิน, การลงทุน, การซื้อขาย, ข้อเสนอแนะ หรือคำแนะนำประเภทอื่น ๆ ที่ให้หรือรับรองโดย TradingView อ่านเพิ่มเติมใน ข้อกำหนดการใช้งาน
คำจำกัดสิทธิ์ความรับผิดชอบ
ข้อมูลและบทความไม่ได้มีวัตถุประสงค์เพื่อก่อให้เกิดกิจกรรมทางการเงิน, การลงทุน, การซื้อขาย, ข้อเสนอแนะ หรือคำแนะนำประเภทอื่น ๆ ที่ให้หรือรับรองโดย TradingView อ่านเพิ่มเติมใน ข้อกำหนดการใช้งาน