OPEN-SOURCE SCRIPT
Weis Wave Oscillator
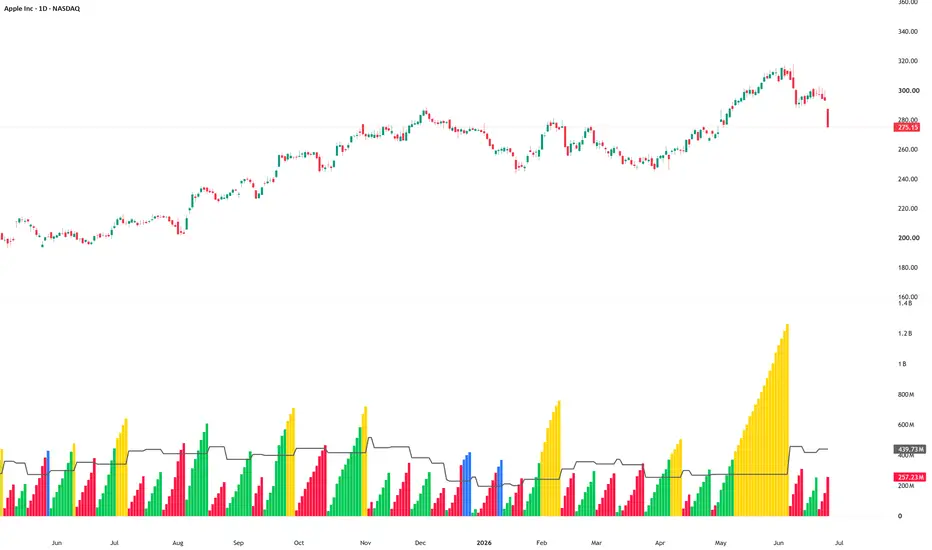
Weis Wave Oscillator
1. Overview
Weis Wave Oscillator is a volume-based wave analysis indicator.
Instead of reading volume bar by bar, the indicator groups volume into directional price waves. It accumulates volume during confirmed upward and downward waves, then displays the accumulated wave volume as columns in a separate pane.
The purpose of the indicator is to help users compare effort versus result by studying how much volume was involved in each directional wave.
This is an indicator, not a strategy. It does not place trades, does not execute orders, and does not produce TradingView Strategy Tester results.
2. Core Idea
Traditional volume bars show volume for each individual candle.
Weis Wave Oscillator groups volume across an entire price wave.
This allows users to ask a different question:
How much volume was required to create this wave?
This can help users study whether a move had strong participation, weak participation, or inefficient effort.
3. Wave Direction
Wave direction is based on confirmed pivot highs and pivot lows.
When a pivot low is confirmed, the indicator starts or continues an upward wave.
When a pivot high is confirmed, the indicator starts or continues a downward wave.
Because pivots require future bars to confirm, wave changes can appear with a delay. This is expected behavior for pivot-based wave analysis.
4. Wave Volume
During each wave, the indicator accumulates the volume of each bar.
For an upward wave, the accumulated volume is displayed using the up wave color.
For a downward wave, the accumulated volume is displayed using the down wave color.
The displayed columns represent the total volume accumulated inside the current directional wave, not only the volume of a single candle.
5. Average Wave Volume
The indicator includes an optional average completed wave volume line.
This line is calculated from recently completed waves.
It helps users compare the current wave volume against the recent average wave effort.
If the current wave grows above the average, it may suggest stronger participation compared with recent waves.
6. High Effort Waves
The indicator can highlight high effort waves.
A wave is considered high effort when its accumulated volume becomes greater than the average completed wave volume multiplied by the selected high-effort factor.
The default high-effort factor is 1.50.
This means the wave must reach at least 150% of the average completed wave volume to be highlighted.
High effort does not automatically mean bullish or bearish continuation. It simply means that the wave used a larger amount of volume compared with recent completed waves.
7. Effort Versus Result
The main purpose of the indicator is to support effort-versus-result analysis.
Examples:
* A strong upward wave with high volume and clear price progress may suggest committed buying participation.
* A strong downward wave with high volume and clear downside progress may suggest committed selling pressure.
* A very large wave volume with limited price progress may suggest inefficient effort, absorption, resistance, or support.
* Comparing the volume of opposing waves can help users study whether buyers or sellers are showing stronger participation.
These observations should always be reviewed with price structure and market context.
8. Optional Effort / Result Line
The indicator includes an optional effort/result line.
This line compares completed wave volume with the absolute price result of the wave.
It is OFF by default to keep the chart clean.
When enabled, it can help users study cases where a wave uses large volume but produces limited price movement.
9. Display
The default display is designed to be clean:
* Wave volume columns are ON.
* Average completed wave volume line is ON.
* Wave volume line is OFF.
* Effort/result line is OFF.
The colors are designed to make wave states easier to separate visually:
* Normal up wave: green
* Normal down wave: red
* High effort up wave: yellow
* High effort down wave: blue
Users can change all colors from the settings.
10. How to Use
A practical workflow:
1. Add the indicator to the chart.
2. Watch how volume accumulates during each upward and downward wave.
3. Compare the current wave volume with the average completed wave volume line.
4. Look for high effort waves when the columns change to the high-effort colors.
5. Compare wave volume with price progress.
6. Review whether large effort produced strong movement or weak movement.
7. Combine the reading with support, resistance, trend direction, market structure, and volume context.
8. Avoid using wave color alone as a trade signal.
9. Suggested Use Cases
Weis Wave Oscillator can be useful for:
* Volume wave analysis
* Effort-versus-result review
* Wyckoff-style volume interpretation
* Comparing buying and selling pressure
* Studying absorption or inefficient effort
* Reviewing support and resistance reactions
* Confirming or questioning directional moves
* Identifying waves with unusually high participation
12. Important Usage Note
This indicator does not tell users when to buy or sell.
It does not predict future price movement.
It does not guarantee continuation.
It does not guarantee reversal.
It does not identify support or resistance by itself.
It only groups volume into directional waves and highlights wave effort.
Users should treat the output as an analytical layer, not as a standalone trading system.
13. Limitations
Wave direction is based on confirmed pivots, so wave changes may appear after the actual turning point.
The indicator can behave differently across timeframes.
Volume data quality can vary by market and symbol.
On markets with unreliable or synthetic volume, the interpretation may be less useful.
A high effort wave can appear before continuation, reversal, or consolidation.
Users should always review the broader chart context before making any trading decision.
14. Alerts
The script includes alert conditions for:
* New up wave
* New down wave
* High effort wave
Alerts are notifications only. They do not place orders and do not confirm broker execution.
15. Educational Disclaimer
This script is for educational and chart-analysis purposes only. It is not financial advice, investment advice, or a recommendation to buy or sell any financial instrument. Users are responsible for their own analysis, risk management, and trading decisions.
1. Overview
Weis Wave Oscillator is a volume-based wave analysis indicator.
Instead of reading volume bar by bar, the indicator groups volume into directional price waves. It accumulates volume during confirmed upward and downward waves, then displays the accumulated wave volume as columns in a separate pane.
The purpose of the indicator is to help users compare effort versus result by studying how much volume was involved in each directional wave.
This is an indicator, not a strategy. It does not place trades, does not execute orders, and does not produce TradingView Strategy Tester results.
2. Core Idea
Traditional volume bars show volume for each individual candle.
Weis Wave Oscillator groups volume across an entire price wave.
This allows users to ask a different question:
How much volume was required to create this wave?
This can help users study whether a move had strong participation, weak participation, or inefficient effort.
3. Wave Direction
Wave direction is based on confirmed pivot highs and pivot lows.
When a pivot low is confirmed, the indicator starts or continues an upward wave.
When a pivot high is confirmed, the indicator starts or continues a downward wave.
Because pivots require future bars to confirm, wave changes can appear with a delay. This is expected behavior for pivot-based wave analysis.
4. Wave Volume
During each wave, the indicator accumulates the volume of each bar.
For an upward wave, the accumulated volume is displayed using the up wave color.
For a downward wave, the accumulated volume is displayed using the down wave color.
The displayed columns represent the total volume accumulated inside the current directional wave, not only the volume of a single candle.
5. Average Wave Volume
The indicator includes an optional average completed wave volume line.
This line is calculated from recently completed waves.
It helps users compare the current wave volume against the recent average wave effort.
If the current wave grows above the average, it may suggest stronger participation compared with recent waves.
6. High Effort Waves
The indicator can highlight high effort waves.
A wave is considered high effort when its accumulated volume becomes greater than the average completed wave volume multiplied by the selected high-effort factor.
The default high-effort factor is 1.50.
This means the wave must reach at least 150% of the average completed wave volume to be highlighted.
High effort does not automatically mean bullish or bearish continuation. It simply means that the wave used a larger amount of volume compared with recent completed waves.
7. Effort Versus Result
The main purpose of the indicator is to support effort-versus-result analysis.
Examples:
* A strong upward wave with high volume and clear price progress may suggest committed buying participation.
* A strong downward wave with high volume and clear downside progress may suggest committed selling pressure.
* A very large wave volume with limited price progress may suggest inefficient effort, absorption, resistance, or support.
* Comparing the volume of opposing waves can help users study whether buyers or sellers are showing stronger participation.
These observations should always be reviewed with price structure and market context.
8. Optional Effort / Result Line
The indicator includes an optional effort/result line.
This line compares completed wave volume with the absolute price result of the wave.
It is OFF by default to keep the chart clean.
When enabled, it can help users study cases where a wave uses large volume but produces limited price movement.
9. Display
The default display is designed to be clean:
* Wave volume columns are ON.
* Average completed wave volume line is ON.
* Wave volume line is OFF.
* Effort/result line is OFF.
The colors are designed to make wave states easier to separate visually:
* Normal up wave: green
* Normal down wave: red
* High effort up wave: yellow
* High effort down wave: blue
Users can change all colors from the settings.
10. How to Use
A practical workflow:
1. Add the indicator to the chart.
2. Watch how volume accumulates during each upward and downward wave.
3. Compare the current wave volume with the average completed wave volume line.
4. Look for high effort waves when the columns change to the high-effort colors.
5. Compare wave volume with price progress.
6. Review whether large effort produced strong movement or weak movement.
7. Combine the reading with support, resistance, trend direction, market structure, and volume context.
8. Avoid using wave color alone as a trade signal.
9. Suggested Use Cases
Weis Wave Oscillator can be useful for:
* Volume wave analysis
* Effort-versus-result review
* Wyckoff-style volume interpretation
* Comparing buying and selling pressure
* Studying absorption or inefficient effort
* Reviewing support and resistance reactions
* Confirming or questioning directional moves
* Identifying waves with unusually high participation
12. Important Usage Note
This indicator does not tell users when to buy or sell.
It does not predict future price movement.
It does not guarantee continuation.
It does not guarantee reversal.
It does not identify support or resistance by itself.
It only groups volume into directional waves and highlights wave effort.
Users should treat the output as an analytical layer, not as a standalone trading system.
13. Limitations
Wave direction is based on confirmed pivots, so wave changes may appear after the actual turning point.
The indicator can behave differently across timeframes.
Volume data quality can vary by market and symbol.
On markets with unreliable or synthetic volume, the interpretation may be less useful.
A high effort wave can appear before continuation, reversal, or consolidation.
Users should always review the broader chart context before making any trading decision.
14. Alerts
The script includes alert conditions for:
* New up wave
* New down wave
* High effort wave
Alerts are notifications only. They do not place orders and do not confirm broker execution.
15. Educational Disclaimer
This script is for educational and chart-analysis purposes only. It is not financial advice, investment advice, or a recommendation to buy or sell any financial instrument. Users are responsible for their own analysis, risk management, and trading decisions.
สคริปต์แบบโอเพนซอร์ส
ด้วยเจตนารมณ์หลักของ TradingView ผู้สร้างสคริปต์นี้ได้ทำให้เป็นโอเพนซอร์ส เพื่อให้เทรดเดอร์สามารถตรวจสอบและยืนยันฟังก์ชันการทำงานของมันได้ ขอชื่นชมผู้เขียน! แม้ว่าคุณจะใช้งานได้ฟรี แต่โปรดจำไว้ว่าการเผยแพร่โค้ดซ้ำจะต้องเป็นไปตาม กฎระเบียบการใช้งาน ของเรา

คำจำกัดสิทธิ์ความรับผิดชอบ
ข้อมูลและบทความไม่ได้มีวัตถุประสงค์เพื่อก่อให้เกิดกิจกรรมทางการเงิน, การลงทุน, การซื้อขาย, ข้อเสนอแนะ หรือคำแนะนำประเภทอื่น ๆ ที่ให้หรือรับรองโดย TradingView อ่านเพิ่มเติมใน ข้อกำหนดการใช้งาน
สคริปต์แบบโอเพนซอร์ส
ด้วยเจตนารมณ์หลักของ TradingView ผู้สร้างสคริปต์นี้ได้ทำให้เป็นโอเพนซอร์ส เพื่อให้เทรดเดอร์สามารถตรวจสอบและยืนยันฟังก์ชันการทำงานของมันได้ ขอชื่นชมผู้เขียน! แม้ว่าคุณจะใช้งานได้ฟรี แต่โปรดจำไว้ว่าการเผยแพร่โค้ดซ้ำจะต้องเป็นไปตาม กฎระเบียบการใช้งาน ของเรา
คำจำกัดสิทธิ์ความรับผิดชอบ
ข้อมูลและบทความไม่ได้มีวัตถุประสงค์เพื่อก่อให้เกิดกิจกรรมทางการเงิน, การลงทุน, การซื้อขาย, ข้อเสนอแนะ หรือคำแนะนำประเภทอื่น ๆ ที่ให้หรือรับรองโดย TradingView อ่านเพิ่มเติมใน ข้อกำหนดการใช้งาน