ที่อัปเดต:
day of Month | xilix
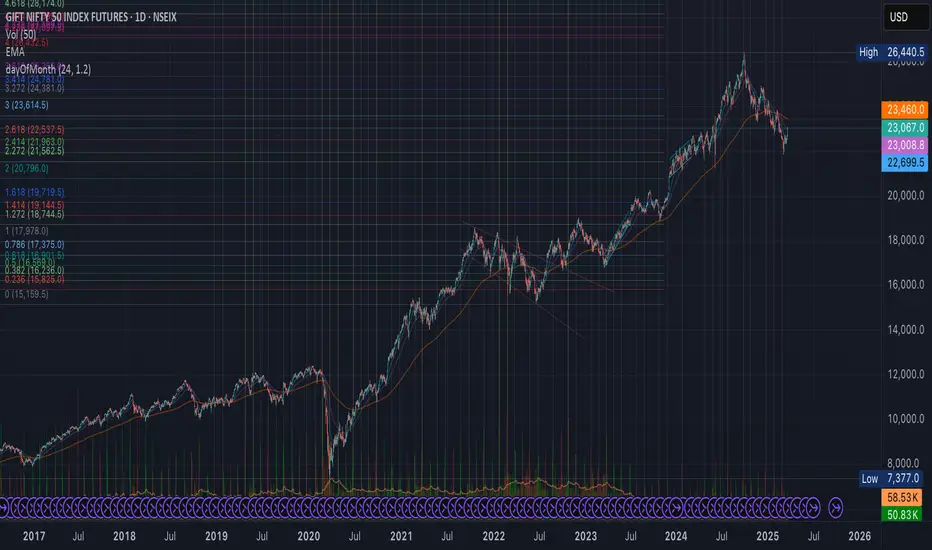
Monthly Marker (1D Only)
The Monthly Marker indicator automatically highlights a specific day of the month on a daily (1D) chart by drawing a vertical line. Users can select their desired day of the month and customize the line color.
Features:
✅ Marks the chosen day of each month with a vertical line.
✅ Customizable line color (set in the indicator settings).
✅ Helps traders quickly identify key monthly dates.
Note: This indicator will not work on lower timeframes (e.g., 4H, 1H) and will show an error if applied outside the 1D timeframe.
Best Use Cases: Monthly trend tracking, economic event alignment, and custom date-based analysis. 🚀
Release Note
Day of Month Marker (1D Only)The Monthly Marker indicator automatically highlights a specific day of the month on a daily (1D) chart by drawing a vertical line. Users can select their desired day of the month and customize the line color.
If the selected day experiences a price change greater than a user-defined percentage, the line is highlighted in a different color.
Features:
✅ Marks the chosen day of each month with a vertical line.
✅ Highlights the line if the day's price change (open to close) exceeds the input threshold.
✅ Customizable colors for default and highlighted lines.
✅ Helps traders quickly identify key monthly dates.
Note: This indicator will not work on lower timeframes (e.g., 4H, 1H) and will show an error if applied outside the 1D timeframe.
Best Use Cases: Monthly trend tracking,economic event alignment, and custom date-based analysis. 🚀

คำจำกัดสิทธิ์ความรับผิดชอบ
ข้อมูลและบทความไม่ได้มีวัตถุประสงค์เพื่อก่อให้เกิดกิจกรรมทางการเงิน, การลงทุน, การซื้อขาย, ข้อเสนอแนะ หรือคำแนะนำประเภทอื่น ๆ ที่ให้หรือรับรองโดย TradingView อ่านเพิ่มเติมใน ข้อกำหนดการใช้งาน
คำจำกัดสิทธิ์ความรับผิดชอบ
ข้อมูลและบทความไม่ได้มีวัตถุประสงค์เพื่อก่อให้เกิดกิจกรรมทางการเงิน, การลงทุน, การซื้อขาย, ข้อเสนอแนะ หรือคำแนะนำประเภทอื่น ๆ ที่ให้หรือรับรองโดย TradingView อ่านเพิ่มเติมใน ข้อกำหนดการใช้งาน