OPEN-SOURCE SCRIPT
Trend-Aware Oscillator [Indicatr]
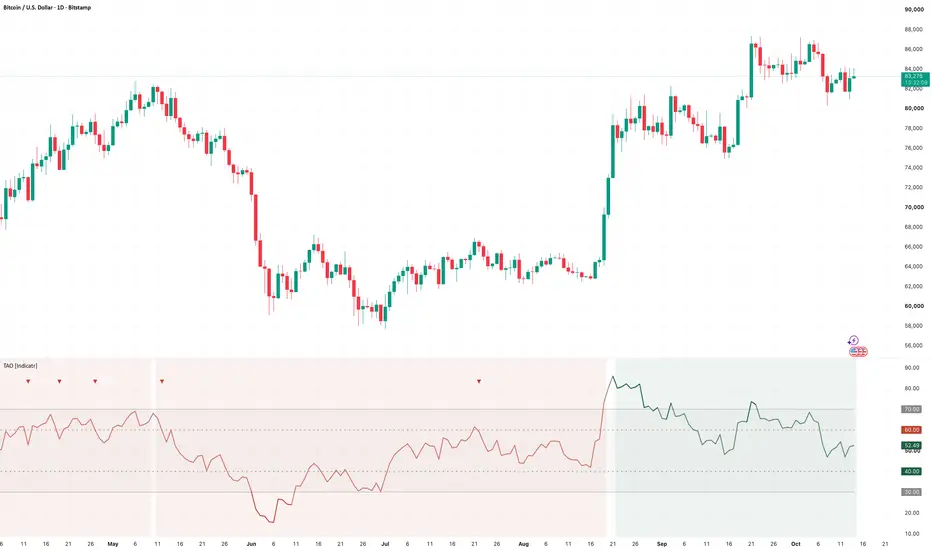
Trend-Aware Oscillator puts classic oscillators into the context of the prevailing trend. Overbought in an uptrend is shown as strength, oversold in a downtrend as weakness, and pullback signals are only marked in the direction of the trend - for long and short.
WHAT IT DOES
Oscillators such as RSI or Stochastic are often read as "overbought = sell, oversold = buy". In trending markets this reading fails: an oscillator can stay overbought for weeks in an uptrend and oversold for weeks in a downtrend. This script adds a trend regime and changes how readings are coloured and signalled.
HOW IT WORKS
Each oscillator has its own default levels, e.g. RSI 70/30 with pullback levels 60/40, Williams %R -20/-80 with -30/-70. Custom levels can be set in the inputs.
HOW TO USE
THE CHART
BTCUSD daily with RSI 14 and the EMA 200 trend filter. Red background = downtrend regime, green background = uptrend regime. In the downtrend phase the red triangles mark RSI rejections from the 60 level (pullback short). After the regime turns up, RSI above 70 is coloured as strength instead of an exit signal.
WHAT IS ORIGINAL
The built-in oscillators show readings without context. This script adds a selectable trend regime, regime-dependent colouring (strength/weakness instead of overbought/oversold), oscillator-specific pullback levels and symmetric long/short pullback logic. Combining eight oscillators in one script is intentional: the same trend logic is applied to interchangeable momentum sources so they can be compared on equal terms.
CREDITS
RSI and ADX/DMI (J. Welles Wilder), Stochastic (George Lane), Williams %R (Larry Williams), CCI (Donald Lambert), MFI (Gene Quong and Avrum Soudack), Fisher Transform (John Ehlers). The WaveTrend calculation follows the community version popularised on TradingView by LazyBear; it is re-implemented here and credited accordingly.
LIMITATIONS
Disclaimer
For educational and analytical purposes only. Not financial advice. Marks and signals are not buy or sell recommendations. Past behaviour does not guarantee future results.
WHAT IT DOES
Oscillators such as RSI or Stochastic are often read as "overbought = sell, oversold = buy". In trending markets this reading fails: an oscillator can stay overbought for weeks in an uptrend and oversold for weeks in a downtrend. This script adds a trend regime and changes how readings are coloured and signalled.
HOW IT WORKS
- Choose one oscillator: RSI, Stochastic, Stochastic RSI, Williams %R, CCI, MFI, WaveTrend or Fisher Transform. All use their standard formulas.
- Trend filter classifies every bar as uptrend, downtrend or no trend:
EMA - price above a rising EMA (default 200) = uptrend, below a falling EMA = downtrend.
ADX / DMI - ADX above the threshold with +DI above -DI = uptrend, the opposite = downtrend.
EMA + ADX - both must agree. - Uptrend: overbought readings are coloured as strength, not as a sell signal. A trend pullback long (green triangle) is marked when the oscillator dips below the uptrend pullback level and crosses back above it.
- Downtrend: oversold readings are coloured as weakness, not as a buy signal. A trend pullback short (red triangle) is marked when the oscillator rises above the downtrend pullback level and crosses back below it.
- No trend: classic overbought/oversold reversal marks can optionally be shown (grey circles).
Each oscillator has its own default levels, e.g. RSI 70/30 with pullback levels 60/40, Williams %R -20/-80 with -30/-70. Custom levels can be set in the inputs.
HOW TO USE
- Use it as a context tool: is an extreme reading more likely continuation or exhaustion, given the trend?
- Combine the pullback marks with your own entry rules, levels and risk management.
- Alerts: trend pullback long, trend pullback short, range long, range short.
THE CHART
BTCUSD daily with RSI 14 and the EMA 200 trend filter. Red background = downtrend regime, green background = uptrend regime. In the downtrend phase the red triangles mark RSI rejections from the 60 level (pullback short). After the regime turns up, RSI above 70 is coloured as strength instead of an exit signal.
WHAT IS ORIGINAL
The built-in oscillators show readings without context. This script adds a selectable trend regime, regime-dependent colouring (strength/weakness instead of overbought/oversold), oscillator-specific pullback levels and symmetric long/short pullback logic. Combining eight oscillators in one script is intentional: the same trend logic is applied to interchangeable momentum sources so they can be compared on equal terms.
CREDITS
RSI and ADX/DMI (J. Welles Wilder), Stochastic (George Lane), Williams %R (Larry Williams), CCI (Donald Lambert), MFI (Gene Quong and Avrum Soudack), Fisher Transform (John Ehlers). The WaveTrend calculation follows the community version popularised on TradingView by LazyBear; it is re-implemented here and credited accordingly.
LIMITATIONS
- The trend filter lags by design - regime changes are confirmed after the move has started.
- In choppy markets the regime can switch often.
- Signals can appear and disappear on the current, unclosed bar.
Disclaimer
For educational and analytical purposes only. Not financial advice. Marks and signals are not buy or sell recommendations. Past behaviour does not guarantee future results.
สคริปต์แบบโอเพนซอร์ส
ด้วยเจตนารมณ์หลักของ TradingView ผู้สร้างสคริปต์นี้ได้ทำให้เป็นโอเพนซอร์ส เพื่อให้เทรดเดอร์สามารถตรวจสอบและยืนยันฟังก์ชันการทำงานของมันได้ ขอชื่นชมผู้เขียน! แม้ว่าคุณจะใช้งานได้ฟรี แต่โปรดจำไว้ว่าการเผยแพร่โค้ดซ้ำจะต้องเป็นไปตาม กฎระเบียบการใช้งาน ของเรา

Indicatr - the indicators you know, rebuilt with market context: volume, trend and momentum, for long and short. Free open-source tools and Pro tools. Guides and setups: indicator.trading/en/link
คำจำกัดสิทธิ์ความรับผิดชอบ
ข้อมูลและบทความไม่ได้มีวัตถุประสงค์เพื่อก่อให้เกิดกิจกรรมทางการเงิน, การลงทุน, การซื้อขาย, ข้อเสนอแนะ หรือคำแนะนำประเภทอื่น ๆ ที่ให้หรือรับรองโดย TradingView อ่านเพิ่มเติมใน ข้อกำหนดการใช้งาน
สคริปต์แบบโอเพนซอร์ส
ด้วยเจตนารมณ์หลักของ TradingView ผู้สร้างสคริปต์นี้ได้ทำให้เป็นโอเพนซอร์ส เพื่อให้เทรดเดอร์สามารถตรวจสอบและยืนยันฟังก์ชันการทำงานของมันได้ ขอชื่นชมผู้เขียน! แม้ว่าคุณจะใช้งานได้ฟรี แต่โปรดจำไว้ว่าการเผยแพร่โค้ดซ้ำจะต้องเป็นไปตาม กฎระเบียบการใช้งาน ของเรา
Indicatr - the indicators you know, rebuilt with market context: volume, trend and momentum, for long and short. Free open-source tools and Pro tools. Guides and setups: indicator.trading/en/link
คำจำกัดสิทธิ์ความรับผิดชอบ
ข้อมูลและบทความไม่ได้มีวัตถุประสงค์เพื่อก่อให้เกิดกิจกรรมทางการเงิน, การลงทุน, การซื้อขาย, ข้อเสนอแนะ หรือคำแนะนำประเภทอื่น ๆ ที่ให้หรือรับรองโดย TradingView อ่านเพิ่มเติมใน ข้อกำหนดการใช้งาน