A/D Oscillator with Buy/Sell Zones
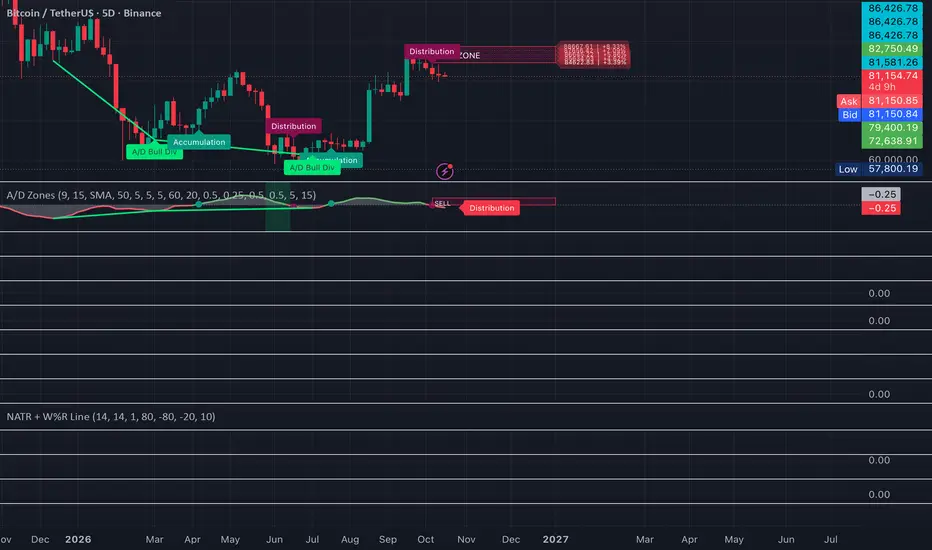
A/D Oscillator – Buy/Sell Zones
OVERVIEW
This indicator turns the Accumulation/Distribution line into a zero-centred oscillator. It then projects actionable buy and sell ranges onto the price chart whenever the money-flow state flips. The goal is to show where buying or selling pressure is building and where price offers the best-value area to act on it.
HOW IT WORKS
- The A/D line is built from each bar's close location value multiplied by volume. This is the standard Chaikin method, protected against zero-range bars and missing volume.
- The oscillator is the difference between a fast and a slow moving average (SMA or EMA) of the A/D line. It can optionally be normalised by average volume so readings are comparable across symbols and timeframes.
- Above zero = ACCUMULATION. Below zero = DISTRIBUTION.
BUY / SELL ZONES
- A BUY ZONE is drawn only when the oscillator flips from Distribution to Accumulation. It sits between the recent swing low (plus a small ATR buffer) and a user-defined depth of the move back toward the signal close. This marks the discount area of the swing.
- A SELL ZONE is drawn only when the oscillator flips from Accumulation to Distribution. It mirrors the buy zone at the recent swing high and marks the premium area.
- Each zone carries a price ladder (1–10 levels). Every level is labelled with its price and its % distance from the signal close, which is useful for scaling in or out.
- A matching box is drawn in the oscillator pane. The pane background highlights while price is trading inside an active zone.
- Only one zone exists at a time, the zone for the current state. A zone is removed automatically when:
– the state flips the other way
– price tags the zone and then bounces away from it (zone used)
– price closes beyond the zone by a set ATR distance (zone invalidated)
- Zones are drawn only after the signal bar closes by default, so they don't flicker intrabar.
DIVERGENCES
- Regular and optional hidden divergences between price and the oscillator, using confirmed pivots.
- Lines can be drawn on the price chart, the oscillator, or both.
ALERTS
- A/D bull cross / bear cross (state change)
- Regular and hidden bullish / bearish divergence
- Price entered BUY zone / SELL zone
SETTINGS
- Fast/slow length, MA type, volume normalisation
- Swing lookback, zone depth, ATR buffer, minimum zone width, invalidation distance
- Number of ladder levels, how far the zone extends to the right, oscillator zone on/off, bar-close confirmation, delete-when-used toggle
- Divergence pivot lookbacks and min/max pivot distance
HOW TO USE
Use the state flip as context, and use the zone as the area to look for entries rather than chasing the signal bar. Combine it with market structure, support/resistance and your own risk management. Volume-based indicators work best on instruments with reliable volume data.
DISCLAIMER
This script is for educational and analytical purposes only. It is not financial advice. Past signals do not guarantee future results.
OVERVIEW
This indicator turns the Accumulation/Distribution line into a zero-centred oscillator. It then projects actionable buy and sell ranges onto the price chart whenever the money-flow state flips. The goal is to show where buying or selling pressure is building and where price offers the best-value area to act on it.
HOW IT WORKS
- The A/D line is built from each bar's close location value multiplied by volume. This is the standard Chaikin method, protected against zero-range bars and missing volume.
- The oscillator is the difference between a fast and a slow moving average (SMA or EMA) of the A/D line. It can optionally be normalised by average volume so readings are comparable across symbols and timeframes.
- Above zero = ACCUMULATION. Below zero = DISTRIBUTION.
BUY / SELL ZONES
- A BUY ZONE is drawn only when the oscillator flips from Distribution to Accumulation. It sits between the recent swing low (plus a small ATR buffer) and a user-defined depth of the move back toward the signal close. This marks the discount area of the swing.
- A SELL ZONE is drawn only when the oscillator flips from Accumulation to Distribution. It mirrors the buy zone at the recent swing high and marks the premium area.
- Each zone carries a price ladder (1–10 levels). Every level is labelled with its price and its % distance from the signal close, which is useful for scaling in or out.
- A matching box is drawn in the oscillator pane. The pane background highlights while price is trading inside an active zone.
- Only one zone exists at a time, the zone for the current state. A zone is removed automatically when:
– the state flips the other way
– price tags the zone and then bounces away from it (zone used)
– price closes beyond the zone by a set ATR distance (zone invalidated)
- Zones are drawn only after the signal bar closes by default, so they don't flicker intrabar.
DIVERGENCES
- Regular and optional hidden divergences between price and the oscillator, using confirmed pivots.
- Lines can be drawn on the price chart, the oscillator, or both.
ALERTS
- A/D bull cross / bear cross (state change)
- Regular and hidden bullish / bearish divergence
- Price entered BUY zone / SELL zone
SETTINGS
- Fast/slow length, MA type, volume normalisation
- Swing lookback, zone depth, ATR buffer, minimum zone width, invalidation distance
- Number of ladder levels, how far the zone extends to the right, oscillator zone on/off, bar-close confirmation, delete-when-used toggle
- Divergence pivot lookbacks and min/max pivot distance
HOW TO USE
Use the state flip as context, and use the zone as the area to look for entries rather than chasing the signal bar. Combine it with market structure, support/resistance and your own risk management. Volume-based indicators work best on instruments with reliable volume data.
DISCLAIMER
This script is for educational and analytical purposes only. It is not financial advice. Past signals do not guarantee future results.

คำจำกัดสิทธิ์ความรับผิดชอบ
ข้อมูลและบทความไม่ได้มีวัตถุประสงค์เพื่อก่อให้เกิดกิจกรรมทางการเงิน, การลงทุน, การซื้อขาย, ข้อเสนอแนะ หรือคำแนะนำประเภทอื่น ๆ ที่ให้หรือรับรองโดย TradingView อ่านเพิ่มเติมใน ข้อกำหนดการใช้งาน
คำจำกัดสิทธิ์ความรับผิดชอบ
ข้อมูลและบทความไม่ได้มีวัตถุประสงค์เพื่อก่อให้เกิดกิจกรรมทางการเงิน, การลงทุน, การซื้อขาย, ข้อเสนอแนะ หรือคำแนะนำประเภทอื่น ๆ ที่ให้หรือรับรองโดย TradingView อ่านเพิ่มเติมใน ข้อกำหนดการใช้งาน