Multi-Timeframe Trend Dashboard - EMA & RSI
OVERVIEW
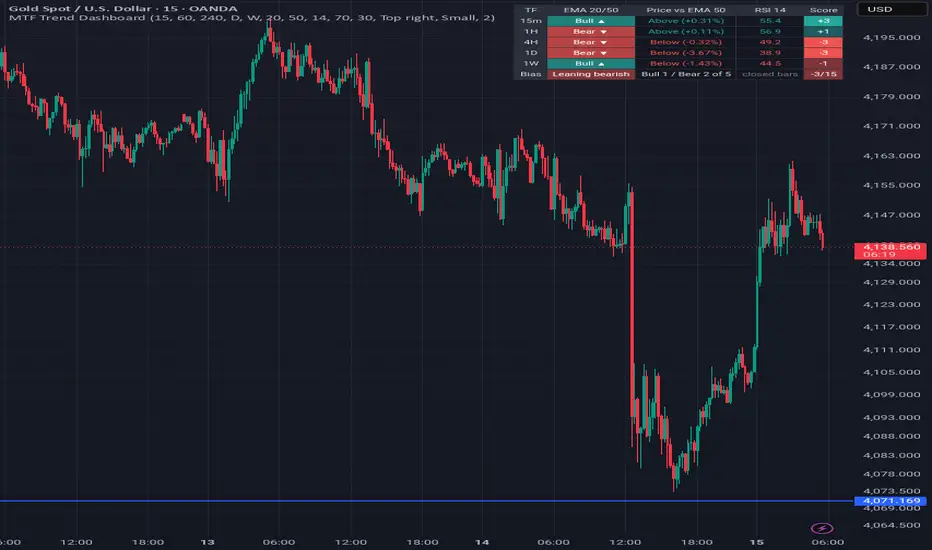
This dashboard shows the trend and momentum state of the current symbol on up to five timeframes in a single table, so you can see whether the lower and higher timeframes agree without switching charts. Each timeframe gets a simple, transparent score, and an overall line summarises how aligned they are. Optional alerts fire when every enabled timeframe agrees, or when that agreement ends.
WHAT MAKES IT DIFFERENT
- By default every reading comes from the last CLOSED bar of each timeframe, so the table does not flicker while higher-timeframe bars are still forming, and historical readings match what was shown in real time. A live mode is available and clearly labelled as repainting.
- The score uses three simple rules that you can check yourself, with no hidden weighting.
- Timeframes below the chart timeframe are flagged and excluded instead of quietly returning misleading values.
HOW IT WORKS
For each selected timeframe the script requests the fast EMA, slow EMA, RSI and close, then scores three conditions:
- EMA trend: fast EMA above slow EMA = +1, below = -1.
- Price position: close above slow EMA = +1, below = -1 (the distance from the slow EMA is shown in %).
- Momentum: RSI above 50 = +1, below 50 = -1. Overbought/oversold levels add an OB/OS tag but do not change the score.
Each timeframe therefore scores from -3 to +3. A timeframe counts as bullish when its score is at or above the chosen threshold (default +2) and as bearish when it is at or below the negative threshold. The Bias row shows "Aligned bullish/bearish" when every enabled, available timeframe agrees, "Leaning" when one side has more timeframes, and "Mixed" otherwise. It also shows the total score out of the maximum possible.
Closed-bars mode requests each value offset by one bar with lookahead enabled. This is the standard non-repainting method for higher-timeframe data: it returns the most recently completed bar of that timeframe on both historical and real-time bars. Live mode requests the current bar without lookahead, so values update tick by tick and can change until each bar closes.
HOW TO USE
1. Choose up to five timeframes, from lowest to highest (defaults: 15m, 1H, 4H, 1D, 1W), and use a chart timeframe equal to or lower than the smallest one.
2. Use the higher timeframes to define directional context and the lower ones to judge timing. For example, a trader might only look for long setups while the higher timeframes are bullish, and wait for a lower timeframe to turn bullish again after a pullback.
3. "Mixed" readings point to a range or a transition between trends, where trend-following approaches tend to be less reliable.
4. Set alerts with "All timeframes bullish", "All timeframes bearish" or "Alignment lost". These alerts are evaluated on confirmed chart bars.
INPUTS
Timeframes
- Five enable boxes and timeframe selectors.
Trend & momentum settings
- Fast EMA length, Slow EMA length, RSI length, RSI overbought/oversold.
- Closed bars only (no repaint): on by default. Turn it off for live, repainting values.
- Plot chart-timeframe EMAs: optionally draws the two EMAs on the chart.
Table
- Position, text size, show distance from slow EMA, and bullish/bearish/neutral colors.
Alignment
- Score needed to count as trending (1-3).
- Highlight chart background when aligned.
LIMITATIONS
- In closed-bars mode, each timeframe reflects its last completed bar. A daily reading does not include today's developing bar, and a timeframe equal to the chart timeframe lags by one bar. This delay is the price of avoiding repainting.
- EMA and RSI are lagging measures. Alignment describes the current state of price; it does not forecast future direction, and aligned conditions can reverse at any time.
- Higher timeframes need enough history to calculate the slow EMA. Rows show "no data" until that history is available.
- Timeframes lower than the chart timeframe are shown as unavailable.
- Readings depend on the symbol's data feed and session settings, so different brokers' symbols can show slightly different values.
This script is for educational and informational purposes only and is not financial advice. Trading CFDs and forex involves significant risk of loss.
This dashboard shows the trend and momentum state of the current symbol on up to five timeframes in a single table, so you can see whether the lower and higher timeframes agree without switching charts. Each timeframe gets a simple, transparent score, and an overall line summarises how aligned they are. Optional alerts fire when every enabled timeframe agrees, or when that agreement ends.
WHAT MAKES IT DIFFERENT
- By default every reading comes from the last CLOSED bar of each timeframe, so the table does not flicker while higher-timeframe bars are still forming, and historical readings match what was shown in real time. A live mode is available and clearly labelled as repainting.
- The score uses three simple rules that you can check yourself, with no hidden weighting.
- Timeframes below the chart timeframe are flagged and excluded instead of quietly returning misleading values.
HOW IT WORKS
For each selected timeframe the script requests the fast EMA, slow EMA, RSI and close, then scores three conditions:
- EMA trend: fast EMA above slow EMA = +1, below = -1.
- Price position: close above slow EMA = +1, below = -1 (the distance from the slow EMA is shown in %).
- Momentum: RSI above 50 = +1, below 50 = -1. Overbought/oversold levels add an OB/OS tag but do not change the score.
Each timeframe therefore scores from -3 to +3. A timeframe counts as bullish when its score is at or above the chosen threshold (default +2) and as bearish when it is at or below the negative threshold. The Bias row shows "Aligned bullish/bearish" when every enabled, available timeframe agrees, "Leaning" when one side has more timeframes, and "Mixed" otherwise. It also shows the total score out of the maximum possible.
Closed-bars mode requests each value offset by one bar with lookahead enabled. This is the standard non-repainting method for higher-timeframe data: it returns the most recently completed bar of that timeframe on both historical and real-time bars. Live mode requests the current bar without lookahead, so values update tick by tick and can change until each bar closes.
HOW TO USE
1. Choose up to five timeframes, from lowest to highest (defaults: 15m, 1H, 4H, 1D, 1W), and use a chart timeframe equal to or lower than the smallest one.
2. Use the higher timeframes to define directional context and the lower ones to judge timing. For example, a trader might only look for long setups while the higher timeframes are bullish, and wait for a lower timeframe to turn bullish again after a pullback.
3. "Mixed" readings point to a range or a transition between trends, where trend-following approaches tend to be less reliable.
4. Set alerts with "All timeframes bullish", "All timeframes bearish" or "Alignment lost". These alerts are evaluated on confirmed chart bars.
INPUTS
Timeframes
- Five enable boxes and timeframe selectors.
Trend & momentum settings
- Fast EMA length, Slow EMA length, RSI length, RSI overbought/oversold.
- Closed bars only (no repaint): on by default. Turn it off for live, repainting values.
- Plot chart-timeframe EMAs: optionally draws the two EMAs on the chart.
Table
- Position, text size, show distance from slow EMA, and bullish/bearish/neutral colors.
Alignment
- Score needed to count as trending (1-3).
- Highlight chart background when aligned.
LIMITATIONS
- In closed-bars mode, each timeframe reflects its last completed bar. A daily reading does not include today's developing bar, and a timeframe equal to the chart timeframe lags by one bar. This delay is the price of avoiding repainting.
- EMA and RSI are lagging measures. Alignment describes the current state of price; it does not forecast future direction, and aligned conditions can reverse at any time.
- Higher timeframes need enough history to calculate the slow EMA. Rows show "no data" until that history is available.
- Timeframes lower than the chart timeframe are shown as unavailable.
- Readings depend on the symbol's data feed and session settings, so different brokers' symbols can show slightly different values.
This script is for educational and informational purposes only and is not financial advice. Trading CFDs and forex involves significant risk of loss.

คำจำกัดสิทธิ์ความรับผิดชอบ
ข้อมูลและบทความไม่ได้มีวัตถุประสงค์เพื่อก่อให้เกิดกิจกรรมทางการเงิน, การลงทุน, การซื้อขาย, ข้อเสนอแนะ หรือคำแนะนำประเภทอื่น ๆ ที่ให้หรือรับรองโดย TradingView อ่านเพิ่มเติมใน ข้อกำหนดการใช้งาน
คำจำกัดสิทธิ์ความรับผิดชอบ
ข้อมูลและบทความไม่ได้มีวัตถุประสงค์เพื่อก่อให้เกิดกิจกรรมทางการเงิน, การลงทุน, การซื้อขาย, ข้อเสนอแนะ หรือคำแนะนำประเภทอื่น ๆ ที่ให้หรือรับรองโดย TradingView อ่านเพิ่มเติมใน ข้อกำหนดการใช้งาน