OPEN-SOURCE SCRIPT
mohit pivot
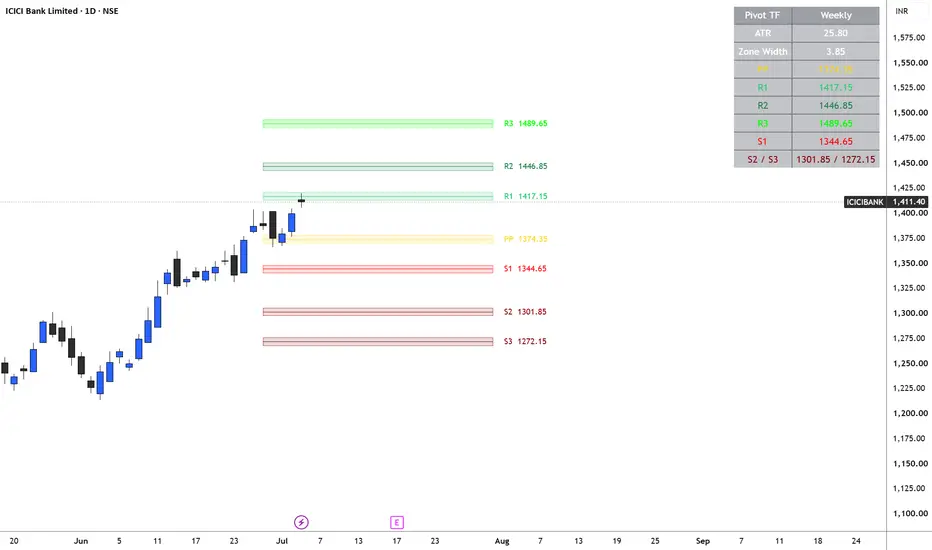
**mohit piviot — ATR Pivot Zones (Daily / Weekly / Monthly)**
This indicator plots classic Standard Pivot Points (PP, R1, R2, R3, S1, S2, S3) calculated from the previous completed Daily, Weekly, or Monthly period — selectable from the settings panel. Instead of drawing thin, single-price lines, each pivot level is expanded into a dynamic support/resistance **zone**, with the zone width driven by current ATR (Average True Range). This means the zones automatically widen in high-volatility conditions and tighten in low-volatility conditions, rather than staying a fixed distance from price regardless of how the market is behaving.
All levels are non-repainting — they're calculated only from confirmed, completed higher-timeframe candles, so the zones never shift or redraw after the fact. The script includes optional zone labels with live prices, a summary table (Pivot TF, ATR, zone width, and all seven levels), full color/style customization, and alerts for zone entries and PP crosses.
**How to read the zones:**
- **PP zone** (yellow) — the central pivot; acts as the line in the sand between bullish and bearish bias for the period.
- **R1 / R2 / R3 zones** (green shades) — potential resistance/take-profit areas above price; R3 marks the most extended resistance.
- **S1 / S2 / S3 zones** (red shades) — potential support/take-profit areas below price; S3 marks the most extended support.
---
**Suggested Entry Criteria**
*Long setups:*
- Price pulls back into an **S1 or S2 zone** and shows rejection (e.g., wick reversal, bullish candle close back above the zone) while the broader trend is up.
- Price breaks and closes **above the PP zone** with strength (momentum move from below), signaling a bias shift to bullish for the period.
- Price bounces off **S1 zone** with a bullish candle close back inside/above the zone after tagging it (mean-reversion long).
*Short setups:*
- Price rallies into an **R1 or R2 zone** and shows rejection (wick reversal, bearish candle close back below the zone) while the broader trend is down.
- Price breaks and closes **below the PP zone**, signaling a bias shift to bearish for the period.
- Price fails at **R1 zone** with a bearish candle close back inside/below the zone after tagging it (mean-reversion short).
**Suggested Exit Criteria**
- **Take-profit targets:** the next zone in sequence — e.g., a long from S1 targets PP, then R1, then R2; a short from R1 targets PP, then S1, then S2.
- **Stop-loss placement:** just beyond the outer boundary of the zone the trade was entered from (e.g., below S1's lower boundary for a long, above R1's upper boundary for a short) — since the zone is ATR-based, this stop naturally adapts to volatility.
- **Trend invalidation exit:** if trading with directional bias, exit longs on a confirmed close back below PP zone, or exit shorts on a confirmed close back above PP zone, since that signals the period's bias has flipped.
- **Zone-to-zone scalps:** for shorter-term trades, treat each zone boundary as its own scalp target rather than waiting for the full next level.
*Note: this description is a starting framework, not a complete trading system. Always combine pivot zone signals with broader market context, trend confirmation, and proper risk management before entering trades.*
This indicator plots classic Standard Pivot Points (PP, R1, R2, R3, S1, S2, S3) calculated from the previous completed Daily, Weekly, or Monthly period — selectable from the settings panel. Instead of drawing thin, single-price lines, each pivot level is expanded into a dynamic support/resistance **zone**, with the zone width driven by current ATR (Average True Range). This means the zones automatically widen in high-volatility conditions and tighten in low-volatility conditions, rather than staying a fixed distance from price regardless of how the market is behaving.
All levels are non-repainting — they're calculated only from confirmed, completed higher-timeframe candles, so the zones never shift or redraw after the fact. The script includes optional zone labels with live prices, a summary table (Pivot TF, ATR, zone width, and all seven levels), full color/style customization, and alerts for zone entries and PP crosses.
**How to read the zones:**
- **PP zone** (yellow) — the central pivot; acts as the line in the sand between bullish and bearish bias for the period.
- **R1 / R2 / R3 zones** (green shades) — potential resistance/take-profit areas above price; R3 marks the most extended resistance.
- **S1 / S2 / S3 zones** (red shades) — potential support/take-profit areas below price; S3 marks the most extended support.
---
**Suggested Entry Criteria**
*Long setups:*
- Price pulls back into an **S1 or S2 zone** and shows rejection (e.g., wick reversal, bullish candle close back above the zone) while the broader trend is up.
- Price breaks and closes **above the PP zone** with strength (momentum move from below), signaling a bias shift to bullish for the period.
- Price bounces off **S1 zone** with a bullish candle close back inside/above the zone after tagging it (mean-reversion long).
*Short setups:*
- Price rallies into an **R1 or R2 zone** and shows rejection (wick reversal, bearish candle close back below the zone) while the broader trend is down.
- Price breaks and closes **below the PP zone**, signaling a bias shift to bearish for the period.
- Price fails at **R1 zone** with a bearish candle close back inside/below the zone after tagging it (mean-reversion short).
**Suggested Exit Criteria**
- **Take-profit targets:** the next zone in sequence — e.g., a long from S1 targets PP, then R1, then R2; a short from R1 targets PP, then S1, then S2.
- **Stop-loss placement:** just beyond the outer boundary of the zone the trade was entered from (e.g., below S1's lower boundary for a long, above R1's upper boundary for a short) — since the zone is ATR-based, this stop naturally adapts to volatility.
- **Trend invalidation exit:** if trading with directional bias, exit longs on a confirmed close back below PP zone, or exit shorts on a confirmed close back above PP zone, since that signals the period's bias has flipped.
- **Zone-to-zone scalps:** for shorter-term trades, treat each zone boundary as its own scalp target rather than waiting for the full next level.
*Note: this description is a starting framework, not a complete trading system. Always combine pivot zone signals with broader market context, trend confirmation, and proper risk management before entering trades.*
สคริปต์โอเพนซอร์ซ
ด้วยเจตนารมณ์หลักของ TradingView ผู้สร้างสคริปต์นี้ได้ทำให้เป็นโอเพนซอร์ส เพื่อให้เทรดเดอร์สามารถตรวจสอบและยืนยันฟังก์ชันการทำงานของมันได้ ขอชื่นชมผู้เขียน! แม้ว่าคุณจะใช้งานได้ฟรี แต่โปรดจำไว้ว่าการเผยแพร่โค้ดซ้ำจะต้องเป็นไปตาม กฎระเบียบการใช้งาน ของเรา

คำจำกัดสิทธิ์ความรับผิดชอบ
ข้อมูลและบทความไม่ได้มีวัตถุประสงค์เพื่อก่อให้เกิดกิจกรรมทางการเงิน, การลงทุน, การซื้อขาย, ข้อเสนอแนะ หรือคำแนะนำประเภทอื่น ๆ ที่ให้หรือรับรองโดย TradingView อ่านเพิ่มเติมใน ข้อกำหนดการใช้งาน
สคริปต์โอเพนซอร์ซ
ด้วยเจตนารมณ์หลักของ TradingView ผู้สร้างสคริปต์นี้ได้ทำให้เป็นโอเพนซอร์ส เพื่อให้เทรดเดอร์สามารถตรวจสอบและยืนยันฟังก์ชันการทำงานของมันได้ ขอชื่นชมผู้เขียน! แม้ว่าคุณจะใช้งานได้ฟรี แต่โปรดจำไว้ว่าการเผยแพร่โค้ดซ้ำจะต้องเป็นไปตาม กฎระเบียบการใช้งาน ของเรา
คำจำกัดสิทธิ์ความรับผิดชอบ
ข้อมูลและบทความไม่ได้มีวัตถุประสงค์เพื่อก่อให้เกิดกิจกรรมทางการเงิน, การลงทุน, การซื้อขาย, ข้อเสนอแนะ หรือคำแนะนำประเภทอื่น ๆ ที่ให้หรือรับรองโดย TradingView อ่านเพิ่มเติมใน ข้อกำหนดการใช้งาน