Liquidity Sweep & Zone Breaks + TP/SL
█ OVERVIEW
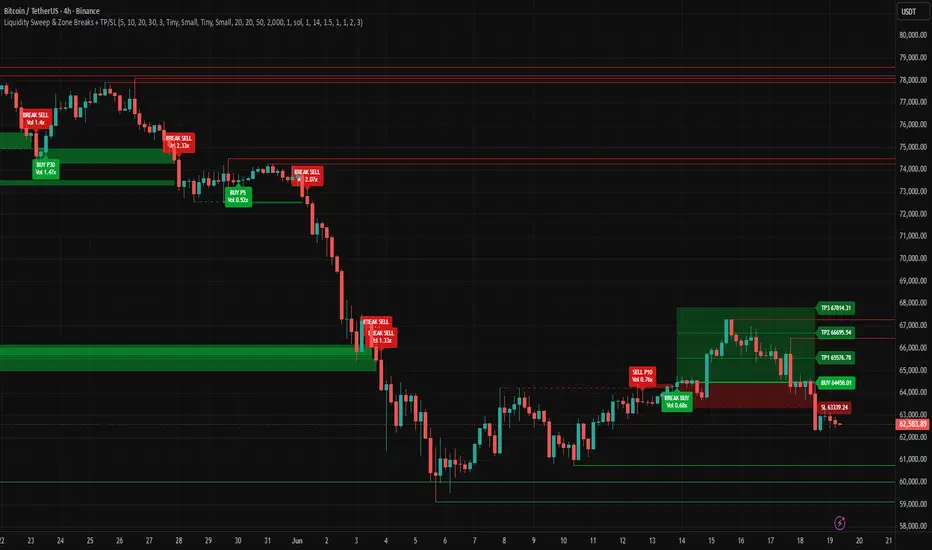
Liquidity Sweep & Zone Breaks + TP/SL is a price action indicator designed to detect liquidity sweeps based on market structure pivots, draw liquidity zones, and generate zone break signals along with a complete trade plan – Stop Loss and three Take Profit levels based on Risk-Reward ratios.
The indicator combines classic pivot-based market structure analysis with liquidity concepts. Signals appear when price briefly breaks significant highs or lows and then returns back inside the previous range, suggesting a liquidity grab or a failed breakout.
The system analyzes four independent pivot lengths simultaneously, allowing it to detect liquidity across different market horizons — from short-term intraday moves to major structural levels.
After a confirmed sweep and after a liquidity zone break, the indicator automatically creates a full position visualization:
• entry level,
• Stop Loss,
• TP1 / TP2 / TP3,
• risk and reward zones.
█ CONCEPTS
The indicator is based on the idea that markets often move by first taking liquidity before executing the real directional move. These behaviors typically occur around key swing highs and lows defined by pivot structure.
Instead of treating breakouts as continuation signals, the indicator focuses on failed breakouts that return back inside the range.
Liquidity Sweep Detection
A liquidity sweep occurs when price temporarily breaks a pivot level and then closes back inside the structure:
• sweep HIGH → price takes the previous high and closes back below it (SELL bias),
• sweep LOW → price takes the previous low and closes back above it (BUY bias).
Confirmation must occur within a defined Confirmation Window.
Confirmation Window
After a pivot is breached, price has a limited number of candles to confirm a return back inside the range.
If confirmation occurs within this window:
• a sweep signal is generated,
• a liquidity zone may be created.
If not confirmed in time, the setup is invalidated.
Multi-Pivot Structure
The indicator uses four pivot lengths:
• short pivots → local liquidity and minor swings,
• medium pivots → local structure,
• long pivots → major swing levels,
• extended pivots → macro liquidity zones.
This allows simultaneous tracking of liquidity across multiple structural timeframes.
Liquidity Zones
After a confirmed sweep, a zone is created between:
• pivot level,
• wick extreme formed during the sweep.
These zones often act as future price reaction areas.
Zone Break
Each zone remains active until it is broken.
A zone break occurs when price closes beyond the sweep extreme:
• break of BUY sweep zone → SELL signal,
• break of SELL sweep zone → BUY signal.
This creates a second layer of signals based on continuation after liquidity has been taken.
Volume Multiplier
Each signal includes a relative volume multiplier compared to a moving average of volume.
It indicates whether the move was supported by increased participation:
• 1.0x → normal volume,
• 2.0x → elevated volume,
• 3.0x+ → strong participation.
Unbroken Pivots
The indicator also tracks pivot levels that have not yet been swept by price.
These represent:
• unfilled liquidity,
• potential future price targets.
Once swept, they are automatically removed.
TP/SL and Risk-Reward
After each signal, the indicator automatically calculates:
• entry price,
• Stop Loss,
• TP1 / TP2 / TP3.
Stop Loss can be defined as:
• ATR multiplier,
or
• fixed percentage from entry.
Take Profit levels are based on predefined Risk-Reward ratios.
█ FEATURES
1. Multi-Pivot Liquidity Detection
Four independent pivot lengths:
• Pivot Length 1
• Pivot Length 2
• Pivot Length 3
• Pivot Length 4
Each represents a different level of market structure.
2. Confirmation Window
Defines how many candles are allowed for sweep confirmation.
• lower values → stricter and fewer signals,
• higher values → more flexible and more signals.
3. Sweep Signals
Optional visualization of sweep signals:
• BUY sweep
• SELL sweep
Signals may include pivot length and volume multiplier.
4. Liquidity Zones
Automatic drawing of zones between pivot level and wick extreme after a confirmed sweep.
5. Zone Break Signals
Signals generated when price breaks a previously formed liquidity zone.
6. Unbroken Pivot Levels
Displays levels that have not yet been taken by price.
7. Volume Analysis
Each signal includes a relative volume strength measurement.
8. TP/SL Settings
• ATR-based Stop Loss or percentage-based Stop Loss
• TP1 / TP2 / TP3 based on RR multipliers
• fully customizable risk-reward structure
9. Position Visualization
The indicator automatically draws:
• entry line,
• Stop Loss,
• Take Profit levels,
• risk/reward zones,
• price labels.
Once TP or SL is hit, all levels stop extending.
TP/SL TRIGGERS
TP/SL can be triggered by:
• sweep signals (P1–P4),
• zone break signals,
• depending on enabled signal source settings.
█ APPLICATIONS
1. Liquidity Sweep Reversals
The main use of the indicator is identifying failed breakouts where price takes liquidity and quickly returns back into range.
These setups often precede short-term reversals or corrections.
2. Market Structure & Liquidity Mapping
Unbroken pivots and sweep zones highlight areas of remaining liquidity and potential future reaction zones.
3. Continuation After Sweep
Zone Break signals may indicate that price has absorbed liquidity and is continuing in the direction of the breakout.
4. Trade Management
The built-in TP/SL system provides immediate visualization of:
• risk,
• reward,
• target levels,
• trade structure.
█ NOTES
• Lower pivot lengths generate more signals and more noise.
• Higher pivot lengths generate fewer but more significant liquidity levels.
• Sweep and Zone Break signals represent different market behaviors and should be analyzed separately.
• Liquidity sweeps do not guarantee reversals and should always be evaluated within broader market structure.
Liquidity Sweep & Zone Breaks + TP/SL is a price action indicator designed to detect liquidity sweeps based on market structure pivots, draw liquidity zones, and generate zone break signals along with a complete trade plan – Stop Loss and three Take Profit levels based on Risk-Reward ratios.
The indicator combines classic pivot-based market structure analysis with liquidity concepts. Signals appear when price briefly breaks significant highs or lows and then returns back inside the previous range, suggesting a liquidity grab or a failed breakout.
The system analyzes four independent pivot lengths simultaneously, allowing it to detect liquidity across different market horizons — from short-term intraday moves to major structural levels.
After a confirmed sweep and after a liquidity zone break, the indicator automatically creates a full position visualization:
• entry level,
• Stop Loss,
• TP1 / TP2 / TP3,
• risk and reward zones.
█ CONCEPTS
The indicator is based on the idea that markets often move by first taking liquidity before executing the real directional move. These behaviors typically occur around key swing highs and lows defined by pivot structure.
Instead of treating breakouts as continuation signals, the indicator focuses on failed breakouts that return back inside the range.
Liquidity Sweep Detection
A liquidity sweep occurs when price temporarily breaks a pivot level and then closes back inside the structure:
• sweep HIGH → price takes the previous high and closes back below it (SELL bias),
• sweep LOW → price takes the previous low and closes back above it (BUY bias).
Confirmation must occur within a defined Confirmation Window.
Confirmation Window
After a pivot is breached, price has a limited number of candles to confirm a return back inside the range.
If confirmation occurs within this window:
• a sweep signal is generated,
• a liquidity zone may be created.
If not confirmed in time, the setup is invalidated.
Multi-Pivot Structure
The indicator uses four pivot lengths:
• short pivots → local liquidity and minor swings,
• medium pivots → local structure,
• long pivots → major swing levels,
• extended pivots → macro liquidity zones.
This allows simultaneous tracking of liquidity across multiple structural timeframes.
Liquidity Zones
After a confirmed sweep, a zone is created between:
• pivot level,
• wick extreme formed during the sweep.
These zones often act as future price reaction areas.
Zone Break
Each zone remains active until it is broken.
A zone break occurs when price closes beyond the sweep extreme:
• break of BUY sweep zone → SELL signal,
• break of SELL sweep zone → BUY signal.
This creates a second layer of signals based on continuation after liquidity has been taken.
Volume Multiplier
Each signal includes a relative volume multiplier compared to a moving average of volume.
It indicates whether the move was supported by increased participation:
• 1.0x → normal volume,
• 2.0x → elevated volume,
• 3.0x+ → strong participation.
Unbroken Pivots
The indicator also tracks pivot levels that have not yet been swept by price.
These represent:
• unfilled liquidity,
• potential future price targets.
Once swept, they are automatically removed.
TP/SL and Risk-Reward
After each signal, the indicator automatically calculates:
• entry price,
• Stop Loss,
• TP1 / TP2 / TP3.
Stop Loss can be defined as:
• ATR multiplier,
or
• fixed percentage from entry.
Take Profit levels are based on predefined Risk-Reward ratios.
█ FEATURES
1. Multi-Pivot Liquidity Detection
Four independent pivot lengths:
• Pivot Length 1
• Pivot Length 2
• Pivot Length 3
• Pivot Length 4
Each represents a different level of market structure.
2. Confirmation Window
Defines how many candles are allowed for sweep confirmation.
• lower values → stricter and fewer signals,
• higher values → more flexible and more signals.
3. Sweep Signals
Optional visualization of sweep signals:
• BUY sweep
• SELL sweep
Signals may include pivot length and volume multiplier.
4. Liquidity Zones
Automatic drawing of zones between pivot level and wick extreme after a confirmed sweep.
5. Zone Break Signals
Signals generated when price breaks a previously formed liquidity zone.
6. Unbroken Pivot Levels
Displays levels that have not yet been taken by price.
7. Volume Analysis
Each signal includes a relative volume strength measurement.
8. TP/SL Settings
• ATR-based Stop Loss or percentage-based Stop Loss
• TP1 / TP2 / TP3 based on RR multipliers
• fully customizable risk-reward structure
9. Position Visualization
The indicator automatically draws:
• entry line,
• Stop Loss,
• Take Profit levels,
• risk/reward zones,
• price labels.
Once TP or SL is hit, all levels stop extending.
TP/SL TRIGGERS
TP/SL can be triggered by:
• sweep signals (P1–P4),
• zone break signals,
• depending on enabled signal source settings.
█ APPLICATIONS
1. Liquidity Sweep Reversals
The main use of the indicator is identifying failed breakouts where price takes liquidity and quickly returns back into range.
These setups often precede short-term reversals or corrections.
2. Market Structure & Liquidity Mapping
Unbroken pivots and sweep zones highlight areas of remaining liquidity and potential future reaction zones.
3. Continuation After Sweep
Zone Break signals may indicate that price has absorbed liquidity and is continuing in the direction of the breakout.
4. Trade Management
The built-in TP/SL system provides immediate visualization of:
• risk,
• reward,
• target levels,
• trade structure.
█ NOTES
• Lower pivot lengths generate more signals and more noise.
• Higher pivot lengths generate fewer but more significant liquidity levels.
• Sweep and Zone Break signals represent different market behaviors and should be analyzed separately.
• Liquidity sweeps do not guarantee reversals and should always be evaluated within broader market structure.

คำจำกัดสิทธิ์ความรับผิดชอบ
ข้อมูลและบทความไม่ได้มีวัตถุประสงค์เพื่อก่อให้เกิดกิจกรรมทางการเงิน, การลงทุน, การซื้อขาย, ข้อเสนอแนะ หรือคำแนะนำประเภทอื่น ๆ ที่ให้หรือรับรองโดย TradingView อ่านเพิ่มเติมใน ข้อกำหนดการใช้งาน
คำจำกัดสิทธิ์ความรับผิดชอบ
ข้อมูลและบทความไม่ได้มีวัตถุประสงค์เพื่อก่อให้เกิดกิจกรรมทางการเงิน, การลงทุน, การซื้อขาย, ข้อเสนอแนะ หรือคำแนะนำประเภทอื่น ๆ ที่ให้หรือรับรองโดย TradingView อ่านเพิ่มเติมใน ข้อกำหนดการใช้งาน