ที่อัปเดต:
Former Horizon | High & Low Levels
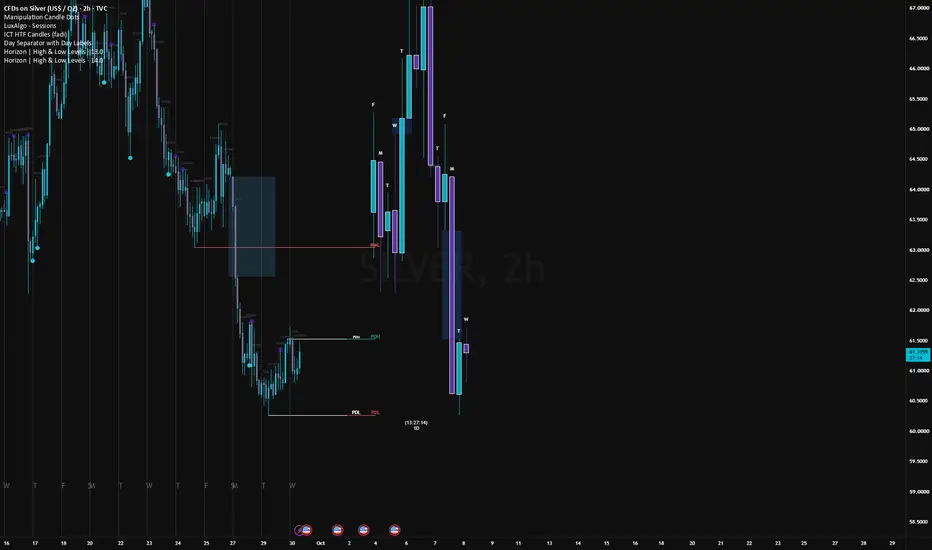
Track key price levels with customisable horizontal lines anchored to the candle wicks that created them.
Displays previous day high and low (PDH / PDL), previous week high and low (PWH / PWL), previous month high and low (PMH / PML), plus optional developing current-day highs and lows.
Four additional high/low pairs support selectable timeframes or manually entered prices, with editable labels.
Customise each line independently:
- Colour, width and solid, dashed or dotted style
- Length in bars
- Label text, colour and font size
- Individual visibility
Choose to extend lines beyond the latest candle or use a fixed length from the originating wick. Optional price values can appear beside each label. When multiple candles share the same extreme, the first matching wick is used.
Previous-period levels use completed candles and follow the symbol’s exchange/session calendar. Automatic levels require a source timeframe equal to or higher than the chart timeframe, with sufficient chart history to locate the originating wick. Manual-price markers start at the latest candle.
Designed for standard time-based candlestick charts.
Displays previous day high and low (PDH / PDL), previous week high and low (PWH / PWL), previous month high and low (PMH / PML), plus optional developing current-day highs and lows.
Four additional high/low pairs support selectable timeframes or manually entered prices, with editable labels.
Customise each line independently:
- Colour, width and solid, dashed or dotted style
- Length in bars
- Label text, colour and font size
- Individual visibility
Choose to extend lines beyond the latest candle or use a fixed length from the originating wick. Optional price values can appear beside each label. When multiple candles share the same extreme, the first matching wick is used.
Previous-period levels use completed candles and follow the symbol’s exchange/session calendar. Automatic levels require a source timeframe equal to or higher than the chart timeframe, with sufficient chart history to locate the originating wick. Manual-price markers start at the latest candle.
Designed for standard time-based candlestick charts.
Release Note
Few issues with AU and AX. Hopefully this has fixed it.
คำจำกัดสิทธิ์ความรับผิดชอบ
ข้อมูลและบทความไม่ได้มีวัตถุประสงค์เพื่อก่อให้เกิดกิจกรรมทางการเงิน, การลงทุน, การซื้อขาย, ข้อเสนอแนะ หรือคำแนะนำประเภทอื่น ๆ ที่ให้หรือรับรองโดย TradingView อ่านเพิ่มเติมใน ข้อกำหนดการใช้งาน
คำจำกัดสิทธิ์ความรับผิดชอบ
ข้อมูลและบทความไม่ได้มีวัตถุประสงค์เพื่อก่อให้เกิดกิจกรรมทางการเงิน, การลงทุน, การซื้อขาย, ข้อเสนอแนะ หรือคำแนะนำประเภทอื่น ๆ ที่ให้หรือรับรองโดย TradingView อ่านเพิ่มเติมใน ข้อกำหนดการใช้งาน