Parallax
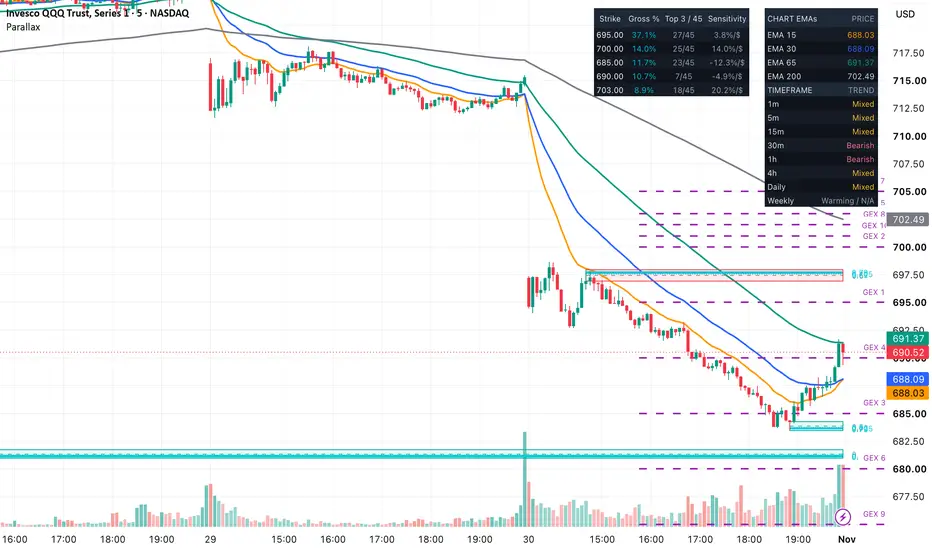
Parallax combines rejection blocks, Fibonacci reference levels, moving averages, volume, and options-gamma analysis in one TradingView indicator.
It is designed for manual chart analysis. You decide which areas matter, whether a price reaction is meaningful, and whether a trade fits your own rules. Parallax does not automatically place trades or guarantee profitable results.
The components work together to provide context: blocks identify potential reaction areas, EMAs describe trend alignment, volume shows activity, and the gamma model maps options sensitivity across strikes.
Reading the blocks
Teal blocks mark potential support around qualifying swing lows. Red blocks mark potential resistance around qualifying swing highs.
A block requires both a confirmed swing point and a candle that meets the wick settings.
Under Settings → Inputs → Blocks:
- Swing strength controls how many candles are required on each side of the turning point. The default of 3 means the pivot confirms after three subsequent candles close.
- Minimum wick / body controls the required wick size relative to the candle body.
- Minimum wick % of range controls how much of the candle’s total range the wick must occupy.
- Maximum active blocks limits how many blocks remain visible.
- Skip same-direction overlap prevents overlapping blocks of the same direction from being added.
The block is drawn back to its original pivot candle, but it only becomes available when the pivot confirms. Its left edge does not represent when you could first have seen it.
A bullish block is removed after a candle closes below its bottom. A bearish block is removed after a candle closes above its top. Older blocks can also be removed when the active-block limit is reached.
A block appearing is not an automatic entry signal.
Using the Fibonacci references
Each block can display internal reference levels. The defaults are 0.50, 0.62, 0.705, and 0.79.
These ratios divide the block’s wick range. They are not automatically drawn across a larger market swing.
Under Block Fibonacci, you can change the ratios, highlight selected levels, show their prices, or hide the labels. Block appearance settings control the fill, borders, midpoint, and extension toward the current candle.
Reading the EMAs and dashboard
Parallax includes four exponential moving averages, with default lengths of 15, 30, 65, and 200 candles. Change their lengths and colors under Optional EMA lines.
The EMA dashboard shows their values on the current chart. The timeframe dashboard separately evaluates 1m, 5m, 15m, 30m, 1h, 4h, Daily, and Weekly.
With the default lengths:
- Bullish means price > EMA 15 > EMA 30 > EMA 65 > EMA 200.
- Bearish means price < EMA 15 < EMA 30 < EMA 65 < EMA 200.
- Mixed means neither complete arrangement is present.
- Warming / N/A means there is insufficient data for the calculation.
Each timeframe uses its own candles and EMA calculations. Readings can change while those candles are forming. These labels describe alignment; they are not forecasts.
Under Dashboard, you can change the position and text size. When both sections are enabled, gamma information appears beside the EMA and timeframe information.
Using volume
Volume bars show the activity reported for each candle. Their colors follow candle direction, so they do not represent separately measured buying and selling volume.
Under Volume, you can:
- Show or hide the bars.
- Adjust their approximate height and transparency.
- Display an average based on preceding candles.
- Highlight volume above a selected multiple of that average.
- Add a compact volume summary to the dashboard.
The default averaging length is 20 candles. A relative-volume reading of 2.0x means the measured completed candle had twice the average volume of its preceding 20 candles.
This comparison is not adjusted for time of day. An unfinished candle’s volume is still accumulating.
Understanding the gamma model
Gamma measures how quickly an option’s delta changes as the underlying price changes.
Parallax estimates gamma from the imported options data, weights it by open interest and the contract multiplier, and groups the results by strike. Calls and puts contribute positively to this gross concentration measure.
The model uses a Black–Scholes–Merton approximation with continuous dividend yield. This is an approximation for American-style QQQ options. It does not identify actual dealer positions or calculate net dealer exposure.
The gamma dashboard contains four columns:
- Strike: the option exercise price.
- Gross %: the strike’s share of total modeled gamma across the usable imported contracts.
- Top 3 / 45: the number of tested scenarios in which that strike ranks among the three largest concentrations.
- Sensitivity: the estimated local percentage change in that strike’s gamma weight per $1 increase in the underlying, holding the other inputs fixed.
For example, 15% gross means the strike represents 15% of the modeled total for the selected dataset. It does not mean a 15% chance of a bounce.
A Top 3 reading of 30/45 means the strike remains among the three largest concentrations in 30 tested scenarios. It does not mean a 30-in-45 trading success rate.
Positive sensitivity means the modeled weight increases locally as the underlying price increases. Negative sensitivity means it decreases. Neither reading is a bullish or bearish price prediction.
In model mode, GEX 1 is the largest baseline concentration, GEX 2 is the second largest, and so on. The numbering reflects modeled size, not distance from the current price.
Adjusting the scenario settings
The model tests 45 combinations: five underlying prices, three time points, and three implied-volatility assumptions.
Under Gamma model:
- Scenario price range controls the percentage movement tested above and below the reference price.
- Scenario horizon controls how far forward the time scenarios extend. Near expiry, the horizon is capped at 80% of the remaining modeled time.
- Scenario IV change controls the relative adjustment to imported implied volatility. A 20% adjustment changes an IV of 0.25 to 0.20 or 0.30.
- Model levels shown controls how many ranked strike levels appear.
- Interest rate and Continuous dividend yield are adjustable model assumptions.
The default scenario settings are ±2% price, an eight-hour requested horizon, and ±20% relative IV.
The scenarios are equally counted hypothetical cases. They are not assigned probabilities, and open interest remains fixed across them.
Getting options data from Cboe
1. Open the [Cboe QQQ Options Quote Table](cboe.com/delayed_quotes/qqq/quote_table).
2. Enter QQQ in the symbol search if needed.
3. Set Options Range → All and Expiration → All.
4. Click View Chain.
5. Scroll below the options table and click Download CSV.
6. Keep the original CSV, including its date, underlying price, and column headers.
Cboe’s quote table provides delayed data. Check the snapshot timestamp rather than assuming the download represents current market conditions.
Converting the CSV with AI
GAMMA1 is Parallax’s custom input format. The indicator does not accept the raw Cboe CSV directly.
Upload the original CSV to ChatGPT or another AI tool, choose one expiration, and use the following prompt. Replace YYYY-MM-DD with your selected expiration.
“Convert this Cboe QQQ options CSV into Parallax’s GAMMA1 format for expiration YYYY-MM-DD.
Use this first-line format:
GAMMA1,QQQ,snapshotTimestampMs,expiryTimestampMs,stockPrice,100,totalSelectedOI,usableOI,strikeCount
Each following line must contain:
strike,callOI,callIV,putOI,putIV
Follow these rules:
- Use the underlying price and snapshot time from the original CSV header.
- Convert timestamps into Unix milliseconds, accounting for the correct New York timezone and daylight saving time.
- Use 4:00 p.m. New York on the selected expiration date as the model’s expiry cutoff. This is a modeling assumption.
- Include only the selected expiration and standard QQQ contracts with a 100-share multiplier. Stop if the contracts are unsupported.
- Create one row per strike, sorted from lowest to highest. Do not silently merge duplicate contracts.
- Express IV as a decimal: 25% becomes 0.25. Do not divide IV by 100 if it is already expressed as a decimal.
- Exclude contracts with missing, nonfinite, or nonpositive IV. For an excluded or zero-OI side, write 0 for both its OI and IV.
- Stop if a retained IV exceeds 10 or if open interest is negative or not a whole number.
- totalSelectedOI includes all open interest for the selected expiration before IV exclusions.
- usableOI includes only the retained contracts.
- Omit rows where both sides have zero usable OI.
- Count the remaining rows as strikeCount. Stop if there are more than 400.
- Verify that the number of rows and summed usable OI match the header.
- Verify that the expiry timestamp is later than the snapshot timestamp.
- Do not invent missing data or silently remove strikes to fit the limit.
Return the complete GAMMA1 text as plain text. If the source is incomplete or inconsistent, explain the problem instead of creating an import.”
AI-generated conversions can contain errors. Check the ticker, snapshot date, selected expiration, and source values before using the result. Passing the indicator’s formatting checks does not establish that every number was copied correctly.
Loading GAMMA1 into Parallax
1. Open Parallax → Settings → Inputs → Gamma model.
2. Enable “Enable in-chart gamma model.”
3. Paste the entire GAMMA1 result into “Compact options data,” including its first line.
4. Make sure the chart symbol matches the imported ticker.
5. Enable “Include gamma in dashboard.” Keep “Show dashboard” enabled under Dashboard.
6. Choose the Model reference.
Snapshot preview calculates using the imported price and snapshot time. Use it to inspect a fixed dataset or try the example below.
Chart price / current time uses the chart’s latest price and the current time when the script updates. Imported IV and open interest remain unchanged. This mode requires an unexpired dataset and does not turn the import into a live options feed.
To refresh the options inputs, download a new CSV, convert it, and replace the previous GAMMA1 text.
Adding existing gamma levels manually
If you already have a list of reference prices, you can display them without running the model.
Under Optional gamma lines:
1. Enable “Show supplied gamma levels.”
2. Enter the matching symbol under “Snapshot ticker.”
3. Paste prices into “Gamma prices and optional labels.”
Use commas or separate lines. Optional labels use the format `price|label`, such as:
```text
690|Reference 1
695|Reference 2
700|Reference 3
```
These are illustrative prices. This mode supports up to 15 unique prices and draws the values you supply. It does not calculate their rankings or automatically refresh or expire them.
One example approach to paper-test
A support-retest approach can combine the information manually:
1. Look for bullish EMA alignment on the timeframe relevant to your analysis.
2. Identify an already-confirmed bullish block. Note whether a gamma reference is nearby.
3. Wait for price to revisit the block and observe whether a completed candle closes back above its upper boundary.
4. Before considering an entry, identify an invalidation level below the block and a possible target near the next higher reference area.
5. Compare the potential reward with the risk. Skip the trade if the available room does not meet your predefined rules.
The bearish version reverses the conditions around a bearish block and a potential lower target.
This is an example to evaluate, not a tested profitability claim. Volume can provide activity context, but agreement between several indicators does not prove that a setup will succeed. Parallax does not automatically execute these steps.
Limitations
Parallax does not guarantee profits, predict every bounce, or prevent losses. Price can move through blocks and gamma references without reversing.
Blocks appear only after confirmation, even though their boxes extend back to earlier candles. Gamma calculations depend on the imported snapshot, selected expiration, usable contracts, and model assumptions. A concentration is not proof of support, resistance, or future dealer hedging.
The gamma model displays the latest calculated state; it is not a historical options-data backtest. Evaluate trading ideas separately, including failed setups, trading costs, and execution risk.
Example GAMMA1 input
The following is a dated demonstration dataset for QQQ. Its header identifies:
- Snapshot reference: November 1, 2026, at 1:28 p.m. New York time.
- Reference underlying price: 692.74.
- Modeled expiry cutoff: November 2, 2026, at 4:00 p.m. New York time.
- Strike rows: 142.
- Usable open interest: 185,573.
Its row count and usable-OI sum match the header. The original source values and their freshness have not been independently verified.
To try it, use a QQQ chart, select Snapshot preview, and paste everything inside the following example into Compact options data. The example does not update automatically.
```text
GAMMA1,QQQ,1793557680000,1793653200000,692.74,100,187833,185573,142
450,0,0,582,1.3733
455,0,0,595,1.3398
460,0,0,625,1.3067
465,0,0,1173,1.2739
470,0,0,2344,1.2414
475,0,0,2879,1.2092
480,0,0,3914,1.1773
485,0,0,1984,1.1458
490,0,0,470,1.1145
495,0,0,378,1.0835
500,0,0,108,1.0528
505,0,0,2100,1.0223
510,0,0,816,0.9921
515,0,0,734,0.9622
520,0,0,273,0.9325
525,0,0,22,0.9027
530,0,0,4269,0.95
535,0,0,138,0.9188
540,0,0,246,0.8878
545,0,0,54,0.8571
550,0,0,5184,0.8266
555,1,0.6874,7167,0.7963
560,0,0,16,0.7662
565,0,0,1402,0.7547
570,0,0,81,0.7244
575,0,0,1271,0.6942
580,0,0,4565,0.6642
585,0,0,345,0.6344
590,0,0,1302,0.6047
595,0,0,77,0.5872
600,0,0,823,0.5569
605,0,0,665,0.5272
610,0,0,364,0.5065
615,0,0,417,0.4765
620,0,0,36,0.447
625,1,0.397,250,0.4236
630,0,0,353,0.3991
635,0,0,786,0.374
640,0,0,949,0.3427
645,34,0.2689,853,0.3119
650,0,0,1005,0.2879
655,0,0,534,0.2619
660,0,0,1376,0.2426
665,0,0,4013,0.2273
670,51,0.2211,1826,0.2221
675,11,0.2157,4897,0.2172
680,24,0.2121,3472,0.2131
685,24,0.2098,4699,0.2117
690,33,0.2035,2736,0.2045
695,134,0.193,8691,0.1935
700,139,0.1879,4933,0.1858
701,13,0.1872,587,0.1848
702,55,0.1876,995,0.1853
703,24,0.1879,5367,0.1846
704,118,0.1882,400,0.1839
705,519,0.1879,1897,0.1842
706,84,0.1886,591,0.1841
707,393,0.1899,741,0.1842
708,574,0.191,637,0.1842
709,237,0.1916,735,0.1842
710,1373,0.1939,2211,0.1839
711,231,0.1954,611,0.1837
712,783,0.1988,737,0.1838
713,821,0.2002,1875,0.1867
714,826,0.2024,1447,0.1867
715,1611,0.2038,3259,0.2004
716,752,0.2054,0,0
717,649,0.2075,261,0.2008
718,987,0.2102,417,0.2006
719,330,0.2109,0,0
720,3057,0.2139,0,0
721,413,0.2166,438,0.2003
722,1273,0.2188,486,0.2841
723,587,0.22,312,0.2007
724,1747,0.2209,288,0.2061
725,9649,0.2266,456,0.2114
726,4016,0.2266,244,0.2249
727,753,0.2257,119,0.2531
728,509,0.2307,127,0.3638
729,624,0.2361,89,0.2715
730,3285,0.2329,45,0.3432
731,790,0.2381,1,0.2874
732,899,0.2433,1,0.2484
733,528,0.2422,9,0.2478
734,587,0.2406,2,0.3009
735,1104,0.2455,19,0.2969
736,1652,0.2504,0,0
737,649,0.2553,3,0.2743
738,315,0.2602,2,0.3166
739,869,0.265,0,0
740,9530,0.2698,0,0
741,984,0.2747,0,0
742,2943,0.2795,0,0
743,276,0.2843,0,0
744,290,0.2891,0,0
745,3268,0.2938,0,0
746,421,0.3071,0,0
747,466,0.3033,0,0
748,352,0.2968,0,0
749,441,0.3013,0,0
750,1963,0.3055,0,0
751,176,0.3104,0,0
752,711,0.315,0,0
753,208,0.3014,0,0
754,337,0.324,0,0
755,266,0.3285,0,0
756,311,0.333,0,0
757,64,0.3185,0,0
758,117,0.3419,0,0
759,186,0.3464,0,0
760,613,0.3508,0,0
761,63,0.3552,0,0
762,107,0.3597,0,0
763,270,0.3439,0,0
764,32,0.3685,0,0
765,362,0.3523,0,0
766,48,0.3772,0,0
767,49,0.3816,0,0
768,26,0.386,0,0
769,25,0.3903,0,0
770,180,0.373,0,0
771,9,0.399,0,0
772,60,0.4033,0,0
773,1,0.4076,0,0
774,2,0.4119,0,0
775,34,0.4162,0,0
780,422,0.4375,0,0
785,51,0.4586,0,0
790,10,0.4795,0,0
795,162,0.5001,0,0
800,211,0.4932,0,0
805,106,0.5126,0,0
810,97,0.5318,0,0
815,129,0.5508,0,0
820,269,0.5696,0,0
825,218,0.5883,0,0
830,13,0.6068,0,0
835,10,0.6251,0,0
840,40,0.6433,0,0
850,10,0.6793,0,0
855,197,0.697,0,0
860,98,0.7147,0,0
```
It is designed for manual chart analysis. You decide which areas matter, whether a price reaction is meaningful, and whether a trade fits your own rules. Parallax does not automatically place trades or guarantee profitable results.
The components work together to provide context: blocks identify potential reaction areas, EMAs describe trend alignment, volume shows activity, and the gamma model maps options sensitivity across strikes.
Reading the blocks
Teal blocks mark potential support around qualifying swing lows. Red blocks mark potential resistance around qualifying swing highs.
A block requires both a confirmed swing point and a candle that meets the wick settings.
Under Settings → Inputs → Blocks:
- Swing strength controls how many candles are required on each side of the turning point. The default of 3 means the pivot confirms after three subsequent candles close.
- Minimum wick / body controls the required wick size relative to the candle body.
- Minimum wick % of range controls how much of the candle’s total range the wick must occupy.
- Maximum active blocks limits how many blocks remain visible.
- Skip same-direction overlap prevents overlapping blocks of the same direction from being added.
The block is drawn back to its original pivot candle, but it only becomes available when the pivot confirms. Its left edge does not represent when you could first have seen it.
A bullish block is removed after a candle closes below its bottom. A bearish block is removed after a candle closes above its top. Older blocks can also be removed when the active-block limit is reached.
A block appearing is not an automatic entry signal.
Using the Fibonacci references
Each block can display internal reference levels. The defaults are 0.50, 0.62, 0.705, and 0.79.
These ratios divide the block’s wick range. They are not automatically drawn across a larger market swing.
Under Block Fibonacci, you can change the ratios, highlight selected levels, show their prices, or hide the labels. Block appearance settings control the fill, borders, midpoint, and extension toward the current candle.
Reading the EMAs and dashboard
Parallax includes four exponential moving averages, with default lengths of 15, 30, 65, and 200 candles. Change their lengths and colors under Optional EMA lines.
The EMA dashboard shows their values on the current chart. The timeframe dashboard separately evaluates 1m, 5m, 15m, 30m, 1h, 4h, Daily, and Weekly.
With the default lengths:
- Bullish means price > EMA 15 > EMA 30 > EMA 65 > EMA 200.
- Bearish means price < EMA 15 < EMA 30 < EMA 65 < EMA 200.
- Mixed means neither complete arrangement is present.
- Warming / N/A means there is insufficient data for the calculation.
Each timeframe uses its own candles and EMA calculations. Readings can change while those candles are forming. These labels describe alignment; they are not forecasts.
Under Dashboard, you can change the position and text size. When both sections are enabled, gamma information appears beside the EMA and timeframe information.
Using volume
Volume bars show the activity reported for each candle. Their colors follow candle direction, so they do not represent separately measured buying and selling volume.
Under Volume, you can:
- Show or hide the bars.
- Adjust their approximate height and transparency.
- Display an average based on preceding candles.
- Highlight volume above a selected multiple of that average.
- Add a compact volume summary to the dashboard.
The default averaging length is 20 candles. A relative-volume reading of 2.0x means the measured completed candle had twice the average volume of its preceding 20 candles.
This comparison is not adjusted for time of day. An unfinished candle’s volume is still accumulating.
Understanding the gamma model
Gamma measures how quickly an option’s delta changes as the underlying price changes.
Parallax estimates gamma from the imported options data, weights it by open interest and the contract multiplier, and groups the results by strike. Calls and puts contribute positively to this gross concentration measure.
The model uses a Black–Scholes–Merton approximation with continuous dividend yield. This is an approximation for American-style QQQ options. It does not identify actual dealer positions or calculate net dealer exposure.
The gamma dashboard contains four columns:
- Strike: the option exercise price.
- Gross %: the strike’s share of total modeled gamma across the usable imported contracts.
- Top 3 / 45: the number of tested scenarios in which that strike ranks among the three largest concentrations.
- Sensitivity: the estimated local percentage change in that strike’s gamma weight per $1 increase in the underlying, holding the other inputs fixed.
For example, 15% gross means the strike represents 15% of the modeled total for the selected dataset. It does not mean a 15% chance of a bounce.
A Top 3 reading of 30/45 means the strike remains among the three largest concentrations in 30 tested scenarios. It does not mean a 30-in-45 trading success rate.
Positive sensitivity means the modeled weight increases locally as the underlying price increases. Negative sensitivity means it decreases. Neither reading is a bullish or bearish price prediction.
In model mode, GEX 1 is the largest baseline concentration, GEX 2 is the second largest, and so on. The numbering reflects modeled size, not distance from the current price.
Adjusting the scenario settings
The model tests 45 combinations: five underlying prices, three time points, and three implied-volatility assumptions.
Under Gamma model:
- Scenario price range controls the percentage movement tested above and below the reference price.
- Scenario horizon controls how far forward the time scenarios extend. Near expiry, the horizon is capped at 80% of the remaining modeled time.
- Scenario IV change controls the relative adjustment to imported implied volatility. A 20% adjustment changes an IV of 0.25 to 0.20 or 0.30.
- Model levels shown controls how many ranked strike levels appear.
- Interest rate and Continuous dividend yield are adjustable model assumptions.
The default scenario settings are ±2% price, an eight-hour requested horizon, and ±20% relative IV.
The scenarios are equally counted hypothetical cases. They are not assigned probabilities, and open interest remains fixed across them.
Getting options data from Cboe
1. Open the [Cboe QQQ Options Quote Table](cboe.com/delayed_quotes/qqq/quote_table).
2. Enter QQQ in the symbol search if needed.
3. Set Options Range → All and Expiration → All.
4. Click View Chain.
5. Scroll below the options table and click Download CSV.
6. Keep the original CSV, including its date, underlying price, and column headers.
Cboe’s quote table provides delayed data. Check the snapshot timestamp rather than assuming the download represents current market conditions.
Converting the CSV with AI
GAMMA1 is Parallax’s custom input format. The indicator does not accept the raw Cboe CSV directly.
Upload the original CSV to ChatGPT or another AI tool, choose one expiration, and use the following prompt. Replace YYYY-MM-DD with your selected expiration.
“Convert this Cboe QQQ options CSV into Parallax’s GAMMA1 format for expiration YYYY-MM-DD.
Use this first-line format:
GAMMA1,QQQ,snapshotTimestampMs,expiryTimestampMs,stockPrice,100,totalSelectedOI,usableOI,strikeCount
Each following line must contain:
strike,callOI,callIV,putOI,putIV
Follow these rules:
- Use the underlying price and snapshot time from the original CSV header.
- Convert timestamps into Unix milliseconds, accounting for the correct New York timezone and daylight saving time.
- Use 4:00 p.m. New York on the selected expiration date as the model’s expiry cutoff. This is a modeling assumption.
- Include only the selected expiration and standard QQQ contracts with a 100-share multiplier. Stop if the contracts are unsupported.
- Create one row per strike, sorted from lowest to highest. Do not silently merge duplicate contracts.
- Express IV as a decimal: 25% becomes 0.25. Do not divide IV by 100 if it is already expressed as a decimal.
- Exclude contracts with missing, nonfinite, or nonpositive IV. For an excluded or zero-OI side, write 0 for both its OI and IV.
- Stop if a retained IV exceeds 10 or if open interest is negative or not a whole number.
- totalSelectedOI includes all open interest for the selected expiration before IV exclusions.
- usableOI includes only the retained contracts.
- Omit rows where both sides have zero usable OI.
- Count the remaining rows as strikeCount. Stop if there are more than 400.
- Verify that the number of rows and summed usable OI match the header.
- Verify that the expiry timestamp is later than the snapshot timestamp.
- Do not invent missing data or silently remove strikes to fit the limit.
Return the complete GAMMA1 text as plain text. If the source is incomplete or inconsistent, explain the problem instead of creating an import.”
AI-generated conversions can contain errors. Check the ticker, snapshot date, selected expiration, and source values before using the result. Passing the indicator’s formatting checks does not establish that every number was copied correctly.
Loading GAMMA1 into Parallax
1. Open Parallax → Settings → Inputs → Gamma model.
2. Enable “Enable in-chart gamma model.”
3. Paste the entire GAMMA1 result into “Compact options data,” including its first line.
4. Make sure the chart symbol matches the imported ticker.
5. Enable “Include gamma in dashboard.” Keep “Show dashboard” enabled under Dashboard.
6. Choose the Model reference.
Snapshot preview calculates using the imported price and snapshot time. Use it to inspect a fixed dataset or try the example below.
Chart price / current time uses the chart’s latest price and the current time when the script updates. Imported IV and open interest remain unchanged. This mode requires an unexpired dataset and does not turn the import into a live options feed.
To refresh the options inputs, download a new CSV, convert it, and replace the previous GAMMA1 text.
Adding existing gamma levels manually
If you already have a list of reference prices, you can display them without running the model.
Under Optional gamma lines:
1. Enable “Show supplied gamma levels.”
2. Enter the matching symbol under “Snapshot ticker.”
3. Paste prices into “Gamma prices and optional labels.”
Use commas or separate lines. Optional labels use the format `price|label`, such as:
```text
690|Reference 1
695|Reference 2
700|Reference 3
```
These are illustrative prices. This mode supports up to 15 unique prices and draws the values you supply. It does not calculate their rankings or automatically refresh or expire them.
One example approach to paper-test
A support-retest approach can combine the information manually:
1. Look for bullish EMA alignment on the timeframe relevant to your analysis.
2. Identify an already-confirmed bullish block. Note whether a gamma reference is nearby.
3. Wait for price to revisit the block and observe whether a completed candle closes back above its upper boundary.
4. Before considering an entry, identify an invalidation level below the block and a possible target near the next higher reference area.
5. Compare the potential reward with the risk. Skip the trade if the available room does not meet your predefined rules.
The bearish version reverses the conditions around a bearish block and a potential lower target.
This is an example to evaluate, not a tested profitability claim. Volume can provide activity context, but agreement between several indicators does not prove that a setup will succeed. Parallax does not automatically execute these steps.
Limitations
Parallax does not guarantee profits, predict every bounce, or prevent losses. Price can move through blocks and gamma references without reversing.
Blocks appear only after confirmation, even though their boxes extend back to earlier candles. Gamma calculations depend on the imported snapshot, selected expiration, usable contracts, and model assumptions. A concentration is not proof of support, resistance, or future dealer hedging.
The gamma model displays the latest calculated state; it is not a historical options-data backtest. Evaluate trading ideas separately, including failed setups, trading costs, and execution risk.
Example GAMMA1 input
The following is a dated demonstration dataset for QQQ. Its header identifies:
- Snapshot reference: November 1, 2026, at 1:28 p.m. New York time.
- Reference underlying price: 692.74.
- Modeled expiry cutoff: November 2, 2026, at 4:00 p.m. New York time.
- Strike rows: 142.
- Usable open interest: 185,573.
Its row count and usable-OI sum match the header. The original source values and their freshness have not been independently verified.
To try it, use a QQQ chart, select Snapshot preview, and paste everything inside the following example into Compact options data. The example does not update automatically.
```text
GAMMA1,QQQ,1793557680000,1793653200000,692.74,100,187833,185573,142
450,0,0,582,1.3733
455,0,0,595,1.3398
460,0,0,625,1.3067
465,0,0,1173,1.2739
470,0,0,2344,1.2414
475,0,0,2879,1.2092
480,0,0,3914,1.1773
485,0,0,1984,1.1458
490,0,0,470,1.1145
495,0,0,378,1.0835
500,0,0,108,1.0528
505,0,0,2100,1.0223
510,0,0,816,0.9921
515,0,0,734,0.9622
520,0,0,273,0.9325
525,0,0,22,0.9027
530,0,0,4269,0.95
535,0,0,138,0.9188
540,0,0,246,0.8878
545,0,0,54,0.8571
550,0,0,5184,0.8266
555,1,0.6874,7167,0.7963
560,0,0,16,0.7662
565,0,0,1402,0.7547
570,0,0,81,0.7244
575,0,0,1271,0.6942
580,0,0,4565,0.6642
585,0,0,345,0.6344
590,0,0,1302,0.6047
595,0,0,77,0.5872
600,0,0,823,0.5569
605,0,0,665,0.5272
610,0,0,364,0.5065
615,0,0,417,0.4765
620,0,0,36,0.447
625,1,0.397,250,0.4236
630,0,0,353,0.3991
635,0,0,786,0.374
640,0,0,949,0.3427
645,34,0.2689,853,0.3119
650,0,0,1005,0.2879
655,0,0,534,0.2619
660,0,0,1376,0.2426
665,0,0,4013,0.2273
670,51,0.2211,1826,0.2221
675,11,0.2157,4897,0.2172
680,24,0.2121,3472,0.2131
685,24,0.2098,4699,0.2117
690,33,0.2035,2736,0.2045
695,134,0.193,8691,0.1935
700,139,0.1879,4933,0.1858
701,13,0.1872,587,0.1848
702,55,0.1876,995,0.1853
703,24,0.1879,5367,0.1846
704,118,0.1882,400,0.1839
705,519,0.1879,1897,0.1842
706,84,0.1886,591,0.1841
707,393,0.1899,741,0.1842
708,574,0.191,637,0.1842
709,237,0.1916,735,0.1842
710,1373,0.1939,2211,0.1839
711,231,0.1954,611,0.1837
712,783,0.1988,737,0.1838
713,821,0.2002,1875,0.1867
714,826,0.2024,1447,0.1867
715,1611,0.2038,3259,0.2004
716,752,0.2054,0,0
717,649,0.2075,261,0.2008
718,987,0.2102,417,0.2006
719,330,0.2109,0,0
720,3057,0.2139,0,0
721,413,0.2166,438,0.2003
722,1273,0.2188,486,0.2841
723,587,0.22,312,0.2007
724,1747,0.2209,288,0.2061
725,9649,0.2266,456,0.2114
726,4016,0.2266,244,0.2249
727,753,0.2257,119,0.2531
728,509,0.2307,127,0.3638
729,624,0.2361,89,0.2715
730,3285,0.2329,45,0.3432
731,790,0.2381,1,0.2874
732,899,0.2433,1,0.2484
733,528,0.2422,9,0.2478
734,587,0.2406,2,0.3009
735,1104,0.2455,19,0.2969
736,1652,0.2504,0,0
737,649,0.2553,3,0.2743
738,315,0.2602,2,0.3166
739,869,0.265,0,0
740,9530,0.2698,0,0
741,984,0.2747,0,0
742,2943,0.2795,0,0
743,276,0.2843,0,0
744,290,0.2891,0,0
745,3268,0.2938,0,0
746,421,0.3071,0,0
747,466,0.3033,0,0
748,352,0.2968,0,0
749,441,0.3013,0,0
750,1963,0.3055,0,0
751,176,0.3104,0,0
752,711,0.315,0,0
753,208,0.3014,0,0
754,337,0.324,0,0
755,266,0.3285,0,0
756,311,0.333,0,0
757,64,0.3185,0,0
758,117,0.3419,0,0
759,186,0.3464,0,0
760,613,0.3508,0,0
761,63,0.3552,0,0
762,107,0.3597,0,0
763,270,0.3439,0,0
764,32,0.3685,0,0
765,362,0.3523,0,0
766,48,0.3772,0,0
767,49,0.3816,0,0
768,26,0.386,0,0
769,25,0.3903,0,0
770,180,0.373,0,0
771,9,0.399,0,0
772,60,0.4033,0,0
773,1,0.4076,0,0
774,2,0.4119,0,0
775,34,0.4162,0,0
780,422,0.4375,0,0
785,51,0.4586,0,0
790,10,0.4795,0,0
795,162,0.5001,0,0
800,211,0.4932,0,0
805,106,0.5126,0,0
810,97,0.5318,0,0
815,129,0.5508,0,0
820,269,0.5696,0,0
825,218,0.5883,0,0
830,13,0.6068,0,0
835,10,0.6251,0,0
840,40,0.6433,0,0
850,10,0.6793,0,0
855,197,0.697,0,0
860,98,0.7147,0,0
```

คำจำกัดสิทธิ์ความรับผิดชอบ
ข้อมูลและบทความไม่ได้มีวัตถุประสงค์เพื่อก่อให้เกิดกิจกรรมทางการเงิน, การลงทุน, การซื้อขาย, ข้อเสนอแนะ หรือคำแนะนำประเภทอื่น ๆ ที่ให้หรือรับรองโดย TradingView อ่านเพิ่มเติมใน ข้อกำหนดการใช้งาน
คำจำกัดสิทธิ์ความรับผิดชอบ
ข้อมูลและบทความไม่ได้มีวัตถุประสงค์เพื่อก่อให้เกิดกิจกรรมทางการเงิน, การลงทุน, การซื้อขาย, ข้อเสนอแนะ หรือคำแนะนำประเภทอื่น ๆ ที่ให้หรือรับรองโดย TradingView อ่านเพิ่มเติมใน ข้อกำหนดการใช้งาน