Patel Flow Analytics V1 - Futures Dashboard
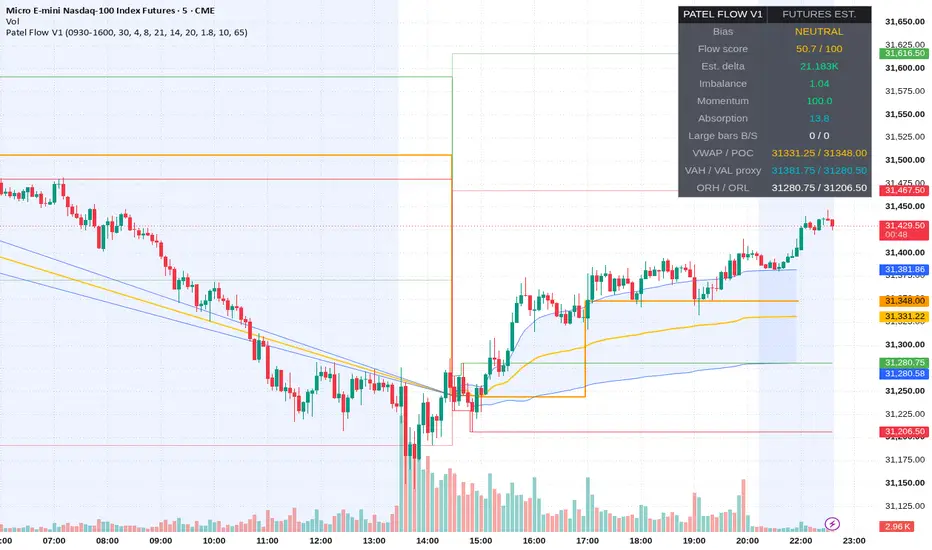
Patel Flow Analytics V1 is an intraday futures dashboard designed for NQ and MNQ. It combines price momentum, estimated directional volume, and session reference levels to show whether these measurements align. It uses the chart's OHLCV data and does not require an external options-flow feed.
HOW THE FLOW SCORE WORKS
The score ranges from -100 to +100. Its components are estimated session delta (35%), ATR-normalized fast/slow EMA separation (25%), ATR-normalized distance from session VWAP (25%), and the balance of recent large-volume up/down bars (15%). Combining these measurements places directional volume estimates in the context of trend and price location.
Estimated bar delta is volume multiplied by the close's relative position within the high-low range, mapped from -1 to +1. A zero-range bar contributes zero delta. Estimated buy/sell volume is derived from that calculation; it is not bid/ask execution data. Large-volume bars exceed a configurable multiple of average volume and are classified by candle direction.
DASHBOARD AND LEVELS
The dashboard shows bias, flow score, estimated session delta, estimated buy/sell imbalance, momentum, an absorption estimate, and recent large-volume bar counts. The absorption estimate combines relative volume with a narrow range relative to ATR; it does not confirm actual order absorption.
Chart levels include session VWAP, a developing POC proxy, VWAP plus/minus one volume-weighted standard deviation, opening-range high/low, and previous analysis-session high/low. The POC proxy assigns each bar's entire volume to a rounded typical-price bucket. It is not a true volume-at-price profile. The bands labeled VAH/VAL are standard-deviation proxies, not a conventional 70% volume-profile value area.
SETUP AND USE
Use standard intraday time-based candles with volume data. The illustrated chart is MNQ on 5 minutes. Keep electronic-session bars available so the script can detect transitions into and out of the chosen analysis session. Session calculations also depend on the history loaded on the chart.
The default analysis window is 09:30-16:00 in the symbol's EXCHANGE timezone, not the chart display timezone. Adjust it to your intended session. Other defaults are a 30-minute opening range, 8/21 EMAs, 14-bar ATR, 20-bar volume average, 1.8x large-volume threshold, 10-bar large-volume count window, and a flow threshold of 65. Rolling measurements can include bars outside the analysis window.
Within the selected session, scores of +65 or higher indicate bullish alignment and -65 or lower indicate bearish alignment. Outside the session, bias is neutral. Compare the score with price relative to VWAP, the opening range, and previous-session levels rather than treating one reading as an entry instruction.
SIGNALS AND ALERTS
Markers and alert conditions occur when the score crosses above the positive threshold or below the negative threshold during the analysis session. Values and crossings can change while a live candle is forming. Select Once Per Bar Close when creating alerts if you want signals evaluated at the close.
LIMITATIONS
This is an OHLCV-based analytical indicator. It does not measure genuine options flow, dealer positioning, gamma exposure, dark-pool transactions, or exchange-reported bid/ask delta. It does not place trades or include a strategy backtest. No profitability or predictive accuracy is claimed. Published open-source so users can inspect and adapt the calculations.
HOW THE FLOW SCORE WORKS
The score ranges from -100 to +100. Its components are estimated session delta (35%), ATR-normalized fast/slow EMA separation (25%), ATR-normalized distance from session VWAP (25%), and the balance of recent large-volume up/down bars (15%). Combining these measurements places directional volume estimates in the context of trend and price location.
Estimated bar delta is volume multiplied by the close's relative position within the high-low range, mapped from -1 to +1. A zero-range bar contributes zero delta. Estimated buy/sell volume is derived from that calculation; it is not bid/ask execution data. Large-volume bars exceed a configurable multiple of average volume and are classified by candle direction.
DASHBOARD AND LEVELS
The dashboard shows bias, flow score, estimated session delta, estimated buy/sell imbalance, momentum, an absorption estimate, and recent large-volume bar counts. The absorption estimate combines relative volume with a narrow range relative to ATR; it does not confirm actual order absorption.
Chart levels include session VWAP, a developing POC proxy, VWAP plus/minus one volume-weighted standard deviation, opening-range high/low, and previous analysis-session high/low. The POC proxy assigns each bar's entire volume to a rounded typical-price bucket. It is not a true volume-at-price profile. The bands labeled VAH/VAL are standard-deviation proxies, not a conventional 70% volume-profile value area.
SETUP AND USE
Use standard intraday time-based candles with volume data. The illustrated chart is MNQ on 5 minutes. Keep electronic-session bars available so the script can detect transitions into and out of the chosen analysis session. Session calculations also depend on the history loaded on the chart.
The default analysis window is 09:30-16:00 in the symbol's EXCHANGE timezone, not the chart display timezone. Adjust it to your intended session. Other defaults are a 30-minute opening range, 8/21 EMAs, 14-bar ATR, 20-bar volume average, 1.8x large-volume threshold, 10-bar large-volume count window, and a flow threshold of 65. Rolling measurements can include bars outside the analysis window.
Within the selected session, scores of +65 or higher indicate bullish alignment and -65 or lower indicate bearish alignment. Outside the session, bias is neutral. Compare the score with price relative to VWAP, the opening range, and previous-session levels rather than treating one reading as an entry instruction.
SIGNALS AND ALERTS
Markers and alert conditions occur when the score crosses above the positive threshold or below the negative threshold during the analysis session. Values and crossings can change while a live candle is forming. Select Once Per Bar Close when creating alerts if you want signals evaluated at the close.
LIMITATIONS
This is an OHLCV-based analytical indicator. It does not measure genuine options flow, dealer positioning, gamma exposure, dark-pool transactions, or exchange-reported bid/ask delta. It does not place trades or include a strategy backtest. No profitability or predictive accuracy is claimed. Published open-source so users can inspect and adapt the calculations.

คำจำกัดสิทธิ์ความรับผิดชอบ
ข้อมูลและบทความไม่ได้มีวัตถุประสงค์เพื่อก่อให้เกิดกิจกรรมทางการเงิน, การลงทุน, การซื้อขาย, ข้อเสนอแนะ หรือคำแนะนำประเภทอื่น ๆ ที่ให้หรือรับรองโดย TradingView อ่านเพิ่มเติมใน ข้อกำหนดการใช้งาน
คำจำกัดสิทธิ์ความรับผิดชอบ
ข้อมูลและบทความไม่ได้มีวัตถุประสงค์เพื่อก่อให้เกิดกิจกรรมทางการเงิน, การลงทุน, การซื้อขาย, ข้อเสนอแนะ หรือคำแนะนำประเภทอื่น ๆ ที่ให้หรือรับรองโดย TradingView อ่านเพิ่มเติมใน ข้อกำหนดการใช้งาน