OPEN-SOURCE SCRIPT
VWSR Zones By Acrofins
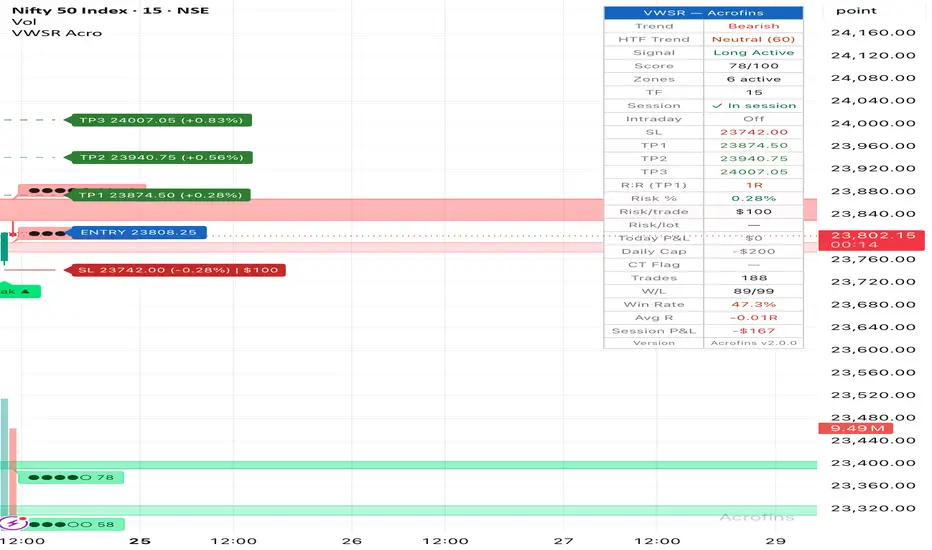
VWSR Zones — Acrofins Edition
A volume-weighted support/resistance engine with break/retest signals, a configurable risk-management overlay, and a session-aware money manager. Built to make discretionary price-action trading more structured and less reactive.
What this indicator does
Most "support and resistance" tools draw lines at every minor swing high or low and leave you to decide which ones matter. This indicator does the prioritization for you.
Every time price makes a pivot (a swing high or swing low), the indicator scores that pivot based on how much volume traded into it and how strongly price reacted after it formed. High-volume pivots with sharp reactions get high scores; thin-volume pivots with weak reactions get low scores. Nearby pivots get clustered into zones, and each re-touch of a zone strengthens it further. Zones decay in importance as they age, and the weakest ones get pruned so the chart stays clean.
The result is a small set of ranked, weighted S/R zones — typically 4–8 active at any time — instead of dozens of unprioritized lines. Zones are fully price-anchored and extend to the right of the chart so they move naturally with every scroll and pan.
On top of the zone engine sits a complete trade-management layer: break detection, retest detection, automatic SL/TP/break-even levels, a higher-timeframe trend filter, an intraday-only mode, a daily loss cap, and a real-time dashboard.
Key features at a glance
Zone engine
Volume-weighted pivot scoring (0–100 scale)
Adaptive zone clustering with ATR-padded merge
Touch counter (each retest reinforces the zone)
Age decay so old zones lose relevance gracefully
Auto-pruning when the active count exceeds your cap
Conviction scale displayed on each zone label (●●○○○ through ●●●●●)
Color intensity reflects conviction — bold solid fill for strong zones, soft transparent fill for weak zones
Signals
Break ▲ / Break ▼ detection with optional close-past-zone confirmation
Retest ▲ / Retest ▼ queue tracking up to 6 broken zones in parallel (most indicators only track the most recent)
Counter-trend tagging ⚠ when a signal fires against the higher-timeframe trend
Optional volume floor and volume cap filters (gap-day protection)
Optional momentum filter (×ATR candle range)
Risk management
Four built-in presets (Conservative, Balanced, Aggressive, Scalping) plus full Custom
ATR-based SL with optional zone-aware override
Three take-profit targets with R-multiple targeting
Break-even trail after TP1
Optional intraday-only mode that blocks late entries and force-closes positions
Money manager
Currency-symbol and number-notation configurable (works globally — Western K/M/B or Indian K/L/Cr)
Per-trade risk in your account currency
Daily loss cap that blocks new entries once hit
Lot-aware sizing for futures/options (configurable lot size)
Session and lifetime P&L tracking
Higher-timeframe context
Configurable HTF (default 1H) with fast/slow EMA classification
Trend direction (Bullish / Bearish / Neutral) shown in dashboard
Counter-trend signals flagged with ⚠ symbol
Optional hard-block of counter-trend entries
Operational
Instrument-type auto-detect (Index vs Single Stock) with adaptive filter defaults
Session filter with configurable timezone
Optional weekly expiry-day filter for derivatives traders (useful for NSE, CBOE)
Persistent statistics across input changes (W/L, Win Rate, Avg R, BE saves)
Theme-adaptive colors (light & dark) with WCAG AA contrast
JSON webhook format for alerts (for automation pipelines)
How it works under the hood
1. Pivot scoring
When a swing high (resistance pivot) or swing low (support pivot) confirms, three score components are computed:
Base score (10 points) — every pivot starts with a baseline
Volume score (0–40 points) — ratio of pivot-bar volume to recent average volume
Reaction score (0–30 points) — how far price moved away from the pivot in the next N bars, measured in ATR
Total raw score is capped at 100. Conviction is shown on each zone label as a dot scale:
Scale
Tier
Score range
●●○○○
Weak
< 30
●●●○○
Medium
30–60
●●●●○
Strong
60–85
●●●●●
Elite
85+
Zone fill color intensity matches the conviction tier — Elite zones are bold and opaque; Weak zones are soft and transparent. This lets you read zone importance at a glance without needing to check labels.
2. Zone clustering
If a new pivot is within Zone Merge Distance × ATR of an existing zone of the same type, it merges into that zone instead of creating a new one. The merge expands the zone bounds (with ATR padding maintained), increments the touch counter, and adds a fraction of the new pivot's score plus a touch bonus.
If no nearby zone exists, a new zone is created with ATR-padded bounds (±0.15 × ATR).
3. Decay and cleanup
Every confirmed bar, all zone scores decay slightly (rate controlled by Age Decay Rate). Zones are removed when they get too old, too weak, or have been broken without retest for too long. If the active zone count exceeds Max Active Zones, the weakest one is pruned.
4. Break detection
A bullish break fires when price closes above a resistance zone's top (optionally requiring close to exceed by X × ATR). A bearish break fires on the symmetric condition. Optional filters require minimum volume, maximum volume (gap protection), and minimum candle range.
When multiple zones break on the same bar, the higher-scored zone wins — so you get the most meaningful signal, not a random one.
5. Retest detection
After a break, the indicator watches for price to return and test the broken zone (which has flipped role — broken resistance becomes support and vice versa). A valid retest requires:
Price touched the zone within the configured retest window
Price bounced off the zone by at least Min Retest Reaction × ATR
Bounce close is on the right side of the zone
A queue tracks up to 6 broken zones in parallel — so retests of zones broken several signals ago aren't lost.
6. Trade lifecycle
When risk management is enabled and a signal fires (and no position is currently active), an entry is taken at the close of the signal bar. SL is placed using your configured preset (ATR-based or zone-aware). Three TPs are spaced at R-multiples of the SL distance.
The trade is tracked bar-by-bar:
Each TP fires once (first-touch latching)
After TP1, SL trails to break-even (configurable)
Trade closes when SL is hit, TP3 is hit, or (in intraday mode) the force-close time is reached
A 1/3 + 1/3 + 1/3 partition model computes realized R-multiple at close
Abbreviations explained
Abbrev
Meaning
S/R
Support / Resistance
VWSR
Volume-Weighted Support / Resistance
ATR
Average True Range — a volatility measure
EMA
Exponential Moving Average
HTF
Higher Timeframe (e.g., when chart is 5m, HTF might be 1H)
SL
Stop Loss — the price at which you accept the trade is wrong
TP
Take Profit (TP1, TP2, TP3 = three profit targets)
BE
Break-Even — SL moved to entry price after TP1
R
Risk unit — distance from entry to original SL
R:R
Risk-to-Reward ratio
W/L
Wins / Losses
CT
Counter-Trend (signal direction conflicts with HTF trend)
F&O
Futures & Options
CE / PE
Call / Put (Indian markets terminology)
OHLC
Open, High, Low, Close
Settings groups walkthrough
⚙️ Main Settings — Pivot Lookback, Max Active Zones, Zone Merge Distance, Min Score to Display.
🎯 Instrument Preset — Auto-detect (recommended) identifies Index vs Single Stock from the ticker. Indices use looser volume filters; single stocks get tighter defaults with gap-day protection.
📈 HTF Trend Filter — Two-EMA trend classifier on a higher timeframe. Counter-trend signals get tagged ⚠. Can flag or hard-block counter-trend entries.
🕒 Session & Expiry — Configurable session window (timezone-aware). Optional weekly expiry-day filter for derivatives traders.
🌙 Intraday-Only Mode — Entry cutoff time and force-close time. Useful for strict day-traders who want an automatic guardrail.
📦 Zone Detection — ATR length, volume lookback, reaction window, age decay, max zone age.
🔍 Filters — Volume floor, volume cap (gap protection), momentum filter, mitigation filter, close-past-zone filter.
🎯 Signals — Toggle Break/Retest signals, configure retest window, set minimum retest reaction.
🛡️ Risk Management — Choose preset or Custom. Presets:
Conservative: SL 2.5×ATR, TP 1R/2R/4R
Balanced (default): SL 1.5×ATR, TP 1R/2R/3R
Aggressive: SL 1.0×ATR, TP 1.5R/2.5R/4R
Scalping: SL 0.8×ATR, TP 0.8R/1.5R/2R
💰 Money Manager — Account capital, per-trade risk %, daily loss cap %, currency symbol, number notation, lot-aware sizing.
🎨 Visual — Theme, zone visibility, label visibility, watermark, font sizes.
📊 Dashboard — Toggle, position, stats display, reset counter.
🔔 Alerts — Toggle per-event alerts. JSON webhook format available for automation.
Visual elements on the chart
Zones — Price-anchored colored boxes extending to the right edge of the chart. Resistance zones in the bear color, support zones in the bull color. Fill opacity reflects conviction tier — ●●●●● Elite zones are bold and solid; ●●○○○ Weak zones are faint and transparent. Zones move naturally with the chart in all directions.
Zone labels — Dot-scale conviction badge, numeric score, touch count, and broken flag. Examples:
●●●○○ 45 — medium zone, score 45
●●●●● 91 ×3 — elite zone with 3 touches
●●●●○ 67 ✕ — strong zone that has been broken
Break ▲ / Break ▼ markers — Labels at the signal candle. Bullish breaks appear below the bar pointing up; bearish breaks above the bar pointing down. Counter-trend breaks tinted amber with ⚠.
Retest ▲ / Retest ▼ markers — Same style as breaks but for retest signals.
Force-close markers — ⏰ FORCE CLOSE on the bar where the intraday cutoff fired.
SL/TP/Entry lines — Five lines from the entry bar: Entry (dotted blue), SL (solid red, dims to translucent when BE active), TP1/TP2/TP3 (dashed green, turns solid cyan with ✓ on hit). Labels show price, % distance from entry, and optional money risk.
Dashboard — Live state table including zone trend, HTF trend, signal, score, active zone count, session status, live trade levels, risk metrics, daily P&L, and lifetime stats.
Recommended usage
Day-trading (5m–15m chart): Lookback 5–10, HTF 60 or 240, Intraday-only ON, Balanced or Scalping preset.
Swing trading (1H–4H chart): Lookback 10–15, HTF D, Intraday-only OFF, Conservative or Balanced preset.
Position trading (D chart): Lookback 15–25, HTF W, Intraday-only OFF, Conservative preset.
Indices (NIFTY, BankNIFTY, SPX, NDX etc.): Use Auto-detect or Index preset. Volume filters auto-relax. HTF filter is especially useful — indices respect macro trends more consistently than individual stocks.
Single stocks: Use Auto-detect or Single Stock preset. Gap-day protection on. Volume cap prevents false breaks on news spikes.
Alerts
All alerts are bar-close based (no intra-bar firing). Available events:
🟢 Break ▲ / 🔴 Break ▼
🟢 Retest ▲ / 🔴 Retest ▼
🛑 SL Hit / 🛡️ Break-Even Stop-Out
🎯 TP1 Hit / TP2 Hit / TP3 Hit
🛡️ Break-Even Activated
⏰ Intraday Force-Close
🚫 Daily Loss Cap Hit
⚠ Counter-Trend Signal
Toggle JSON webhook format for automation pipelines. Each break/retest alert includes ticker, price, score, SL, TP1/TP2/TP3, R:R, and counter-trend flag.
Notes on data assumptions
No repaint — signals confirm on bar close. HTF trend uses lookahead_off so the HTF reference never includes future data.
No backtest engine — the W/L stats are based on the indicator's own simulated entries. Useful for sanity-checking parameters, not for performance verification. Run a proper strategy backtest before sizing real money.
Money tracking is theoretical — P&L is computed as R-multiple × per-trade money risk. It does not model slippage, commissions, taxes, or option premium decay.
Disclaimer
This is a technical analysis tool, not financial advice. The signals and risk levels generated are based on historical price action and the indicator's own logic; they do not predict future results. Past performance of any signal pattern does not guarantee future performance. Trading involves substantial risk of loss. Use this tool to structure your own decisions, not to replace them. Always size positions according to your risk tolerance and verify levels independently before acting.
VWSR Zones — Acrofins Edition · v2.0.0 · Acrofins (Kiva Financial Services Pvt. Ltd.)
A volume-weighted support/resistance engine with break/retest signals, a configurable risk-management overlay, and a session-aware money manager. Built to make discretionary price-action trading more structured and less reactive.
What this indicator does
Most "support and resistance" tools draw lines at every minor swing high or low and leave you to decide which ones matter. This indicator does the prioritization for you.
Every time price makes a pivot (a swing high or swing low), the indicator scores that pivot based on how much volume traded into it and how strongly price reacted after it formed. High-volume pivots with sharp reactions get high scores; thin-volume pivots with weak reactions get low scores. Nearby pivots get clustered into zones, and each re-touch of a zone strengthens it further. Zones decay in importance as they age, and the weakest ones get pruned so the chart stays clean.
The result is a small set of ranked, weighted S/R zones — typically 4–8 active at any time — instead of dozens of unprioritized lines. Zones are fully price-anchored and extend to the right of the chart so they move naturally with every scroll and pan.
On top of the zone engine sits a complete trade-management layer: break detection, retest detection, automatic SL/TP/break-even levels, a higher-timeframe trend filter, an intraday-only mode, a daily loss cap, and a real-time dashboard.
Key features at a glance
Zone engine
Volume-weighted pivot scoring (0–100 scale)
Adaptive zone clustering with ATR-padded merge
Touch counter (each retest reinforces the zone)
Age decay so old zones lose relevance gracefully
Auto-pruning when the active count exceeds your cap
Conviction scale displayed on each zone label (●●○○○ through ●●●●●)
Color intensity reflects conviction — bold solid fill for strong zones, soft transparent fill for weak zones
Signals
Break ▲ / Break ▼ detection with optional close-past-zone confirmation
Retest ▲ / Retest ▼ queue tracking up to 6 broken zones in parallel (most indicators only track the most recent)
Counter-trend tagging ⚠ when a signal fires against the higher-timeframe trend
Optional volume floor and volume cap filters (gap-day protection)
Optional momentum filter (×ATR candle range)
Risk management
Four built-in presets (Conservative, Balanced, Aggressive, Scalping) plus full Custom
ATR-based SL with optional zone-aware override
Three take-profit targets with R-multiple targeting
Break-even trail after TP1
Optional intraday-only mode that blocks late entries and force-closes positions
Money manager
Currency-symbol and number-notation configurable (works globally — Western K/M/B or Indian K/L/Cr)
Per-trade risk in your account currency
Daily loss cap that blocks new entries once hit
Lot-aware sizing for futures/options (configurable lot size)
Session and lifetime P&L tracking
Higher-timeframe context
Configurable HTF (default 1H) with fast/slow EMA classification
Trend direction (Bullish / Bearish / Neutral) shown in dashboard
Counter-trend signals flagged with ⚠ symbol
Optional hard-block of counter-trend entries
Operational
Instrument-type auto-detect (Index vs Single Stock) with adaptive filter defaults
Session filter with configurable timezone
Optional weekly expiry-day filter for derivatives traders (useful for NSE, CBOE)
Persistent statistics across input changes (W/L, Win Rate, Avg R, BE saves)
Theme-adaptive colors (light & dark) with WCAG AA contrast
JSON webhook format for alerts (for automation pipelines)
How it works under the hood
1. Pivot scoring
When a swing high (resistance pivot) or swing low (support pivot) confirms, three score components are computed:
Base score (10 points) — every pivot starts with a baseline
Volume score (0–40 points) — ratio of pivot-bar volume to recent average volume
Reaction score (0–30 points) — how far price moved away from the pivot in the next N bars, measured in ATR
Total raw score is capped at 100. Conviction is shown on each zone label as a dot scale:
Scale
Tier
Score range
●●○○○
Weak
< 30
●●●○○
Medium
30–60
●●●●○
Strong
60–85
●●●●●
Elite
85+
Zone fill color intensity matches the conviction tier — Elite zones are bold and opaque; Weak zones are soft and transparent. This lets you read zone importance at a glance without needing to check labels.
2. Zone clustering
If a new pivot is within Zone Merge Distance × ATR of an existing zone of the same type, it merges into that zone instead of creating a new one. The merge expands the zone bounds (with ATR padding maintained), increments the touch counter, and adds a fraction of the new pivot's score plus a touch bonus.
If no nearby zone exists, a new zone is created with ATR-padded bounds (±0.15 × ATR).
3. Decay and cleanup
Every confirmed bar, all zone scores decay slightly (rate controlled by Age Decay Rate). Zones are removed when they get too old, too weak, or have been broken without retest for too long. If the active zone count exceeds Max Active Zones, the weakest one is pruned.
4. Break detection
A bullish break fires when price closes above a resistance zone's top (optionally requiring close to exceed by X × ATR). A bearish break fires on the symmetric condition. Optional filters require minimum volume, maximum volume (gap protection), and minimum candle range.
When multiple zones break on the same bar, the higher-scored zone wins — so you get the most meaningful signal, not a random one.
5. Retest detection
After a break, the indicator watches for price to return and test the broken zone (which has flipped role — broken resistance becomes support and vice versa). A valid retest requires:
Price touched the zone within the configured retest window
Price bounced off the zone by at least Min Retest Reaction × ATR
Bounce close is on the right side of the zone
A queue tracks up to 6 broken zones in parallel — so retests of zones broken several signals ago aren't lost.
6. Trade lifecycle
When risk management is enabled and a signal fires (and no position is currently active), an entry is taken at the close of the signal bar. SL is placed using your configured preset (ATR-based or zone-aware). Three TPs are spaced at R-multiples of the SL distance.
The trade is tracked bar-by-bar:
Each TP fires once (first-touch latching)
After TP1, SL trails to break-even (configurable)
Trade closes when SL is hit, TP3 is hit, or (in intraday mode) the force-close time is reached
A 1/3 + 1/3 + 1/3 partition model computes realized R-multiple at close
Abbreviations explained
Abbrev
Meaning
S/R
Support / Resistance
VWSR
Volume-Weighted Support / Resistance
ATR
Average True Range — a volatility measure
EMA
Exponential Moving Average
HTF
Higher Timeframe (e.g., when chart is 5m, HTF might be 1H)
SL
Stop Loss — the price at which you accept the trade is wrong
TP
Take Profit (TP1, TP2, TP3 = three profit targets)
BE
Break-Even — SL moved to entry price after TP1
R
Risk unit — distance from entry to original SL
R:R
Risk-to-Reward ratio
W/L
Wins / Losses
CT
Counter-Trend (signal direction conflicts with HTF trend)
F&O
Futures & Options
CE / PE
Call / Put (Indian markets terminology)
OHLC
Open, High, Low, Close
Settings groups walkthrough
⚙️ Main Settings — Pivot Lookback, Max Active Zones, Zone Merge Distance, Min Score to Display.
🎯 Instrument Preset — Auto-detect (recommended) identifies Index vs Single Stock from the ticker. Indices use looser volume filters; single stocks get tighter defaults with gap-day protection.
📈 HTF Trend Filter — Two-EMA trend classifier on a higher timeframe. Counter-trend signals get tagged ⚠. Can flag or hard-block counter-trend entries.
🕒 Session & Expiry — Configurable session window (timezone-aware). Optional weekly expiry-day filter for derivatives traders.
🌙 Intraday-Only Mode — Entry cutoff time and force-close time. Useful for strict day-traders who want an automatic guardrail.
📦 Zone Detection — ATR length, volume lookback, reaction window, age decay, max zone age.
🔍 Filters — Volume floor, volume cap (gap protection), momentum filter, mitigation filter, close-past-zone filter.
🎯 Signals — Toggle Break/Retest signals, configure retest window, set minimum retest reaction.
🛡️ Risk Management — Choose preset or Custom. Presets:
Conservative: SL 2.5×ATR, TP 1R/2R/4R
Balanced (default): SL 1.5×ATR, TP 1R/2R/3R
Aggressive: SL 1.0×ATR, TP 1.5R/2.5R/4R
Scalping: SL 0.8×ATR, TP 0.8R/1.5R/2R
💰 Money Manager — Account capital, per-trade risk %, daily loss cap %, currency symbol, number notation, lot-aware sizing.
🎨 Visual — Theme, zone visibility, label visibility, watermark, font sizes.
📊 Dashboard — Toggle, position, stats display, reset counter.
🔔 Alerts — Toggle per-event alerts. JSON webhook format available for automation.
Visual elements on the chart
Zones — Price-anchored colored boxes extending to the right edge of the chart. Resistance zones in the bear color, support zones in the bull color. Fill opacity reflects conviction tier — ●●●●● Elite zones are bold and solid; ●●○○○ Weak zones are faint and transparent. Zones move naturally with the chart in all directions.
Zone labels — Dot-scale conviction badge, numeric score, touch count, and broken flag. Examples:
●●●○○ 45 — medium zone, score 45
●●●●● 91 ×3 — elite zone with 3 touches
●●●●○ 67 ✕ — strong zone that has been broken
Break ▲ / Break ▼ markers — Labels at the signal candle. Bullish breaks appear below the bar pointing up; bearish breaks above the bar pointing down. Counter-trend breaks tinted amber with ⚠.
Retest ▲ / Retest ▼ markers — Same style as breaks but for retest signals.
Force-close markers — ⏰ FORCE CLOSE on the bar where the intraday cutoff fired.
SL/TP/Entry lines — Five lines from the entry bar: Entry (dotted blue), SL (solid red, dims to translucent when BE active), TP1/TP2/TP3 (dashed green, turns solid cyan with ✓ on hit). Labels show price, % distance from entry, and optional money risk.
Dashboard — Live state table including zone trend, HTF trend, signal, score, active zone count, session status, live trade levels, risk metrics, daily P&L, and lifetime stats.
Recommended usage
Day-trading (5m–15m chart): Lookback 5–10, HTF 60 or 240, Intraday-only ON, Balanced or Scalping preset.
Swing trading (1H–4H chart): Lookback 10–15, HTF D, Intraday-only OFF, Conservative or Balanced preset.
Position trading (D chart): Lookback 15–25, HTF W, Intraday-only OFF, Conservative preset.
Indices (NIFTY, BankNIFTY, SPX, NDX etc.): Use Auto-detect or Index preset. Volume filters auto-relax. HTF filter is especially useful — indices respect macro trends more consistently than individual stocks.
Single stocks: Use Auto-detect or Single Stock preset. Gap-day protection on. Volume cap prevents false breaks on news spikes.
Alerts
All alerts are bar-close based (no intra-bar firing). Available events:
🟢 Break ▲ / 🔴 Break ▼
🟢 Retest ▲ / 🔴 Retest ▼
🛑 SL Hit / 🛡️ Break-Even Stop-Out
🎯 TP1 Hit / TP2 Hit / TP3 Hit
🛡️ Break-Even Activated
⏰ Intraday Force-Close
🚫 Daily Loss Cap Hit
⚠ Counter-Trend Signal
Toggle JSON webhook format for automation pipelines. Each break/retest alert includes ticker, price, score, SL, TP1/TP2/TP3, R:R, and counter-trend flag.
Notes on data assumptions
No repaint — signals confirm on bar close. HTF trend uses lookahead_off so the HTF reference never includes future data.
No backtest engine — the W/L stats are based on the indicator's own simulated entries. Useful for sanity-checking parameters, not for performance verification. Run a proper strategy backtest before sizing real money.
Money tracking is theoretical — P&L is computed as R-multiple × per-trade money risk. It does not model slippage, commissions, taxes, or option premium decay.
Disclaimer
This is a technical analysis tool, not financial advice. The signals and risk levels generated are based on historical price action and the indicator's own logic; they do not predict future results. Past performance of any signal pattern does not guarantee future performance. Trading involves substantial risk of loss. Use this tool to structure your own decisions, not to replace them. Always size positions according to your risk tolerance and verify levels independently before acting.
VWSR Zones — Acrofins Edition · v2.0.0 · Acrofins (Kiva Financial Services Pvt. Ltd.)
สคริปต์โอเพนซอร์ซ
ด้วยเจตนารมณ์หลักของ TradingView ผู้สร้างสคริปต์นี้ได้ทำให้เป็นโอเพนซอร์ส เพื่อให้เทรดเดอร์สามารถตรวจสอบและยืนยันฟังก์ชันการทำงานของมันได้ ขอชื่นชมผู้เขียน! แม้ว่าคุณจะใช้งานได้ฟรี แต่โปรดจำไว้ว่าการเผยแพร่โค้ดซ้ำจะต้องเป็นไปตาม กฎระเบียบการใช้งาน ของเรา

คำจำกัดสิทธิ์ความรับผิดชอบ
ข้อมูลและบทความไม่ได้มีวัตถุประสงค์เพื่อก่อให้เกิดกิจกรรมทางการเงิน, การลงทุน, การซื้อขาย, ข้อเสนอแนะ หรือคำแนะนำประเภทอื่น ๆ ที่ให้หรือรับรองโดย TradingView อ่านเพิ่มเติมใน ข้อกำหนดการใช้งาน
สคริปต์โอเพนซอร์ซ
ด้วยเจตนารมณ์หลักของ TradingView ผู้สร้างสคริปต์นี้ได้ทำให้เป็นโอเพนซอร์ส เพื่อให้เทรดเดอร์สามารถตรวจสอบและยืนยันฟังก์ชันการทำงานของมันได้ ขอชื่นชมผู้เขียน! แม้ว่าคุณจะใช้งานได้ฟรี แต่โปรดจำไว้ว่าการเผยแพร่โค้ดซ้ำจะต้องเป็นไปตาม กฎระเบียบการใช้งาน ของเรา
คำจำกัดสิทธิ์ความรับผิดชอบ
ข้อมูลและบทความไม่ได้มีวัตถุประสงค์เพื่อก่อให้เกิดกิจกรรมทางการเงิน, การลงทุน, การซื้อขาย, ข้อเสนอแนะ หรือคำแนะนำประเภทอื่น ๆ ที่ให้หรือรับรองโดย TradingView อ่านเพิ่มเติมใน ข้อกำหนดการใช้งาน