OPEN-SOURCE SCRIPT
ที่อัปเดต: Oversold Master
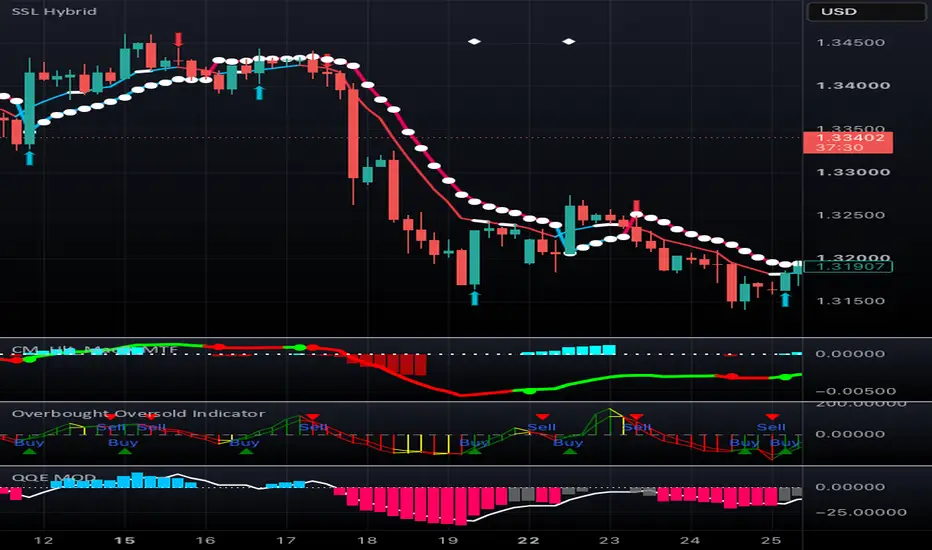
How it works, and how to tune it:
Gray line = neutral. Red = in overbought zone. Blue = in oversold zone.
A triangle signal only appears after price has confirmed its way back out of the zone (controlled by "Bars to Confirm Exit From Zone") — this is what prevents you from selling into a strong momentum spike that keeps climbing.
The bands themselves move (adaptive mode) — during high volatility they widen, so you don't get an overbought signal every 20 minutes; during quiet chop they tighten, so you still catch real extremes.
The trend filter checks a daily EMA by default — it will block sell signals while the daily trend is up, and block buy signals while the daily trend is down. This is the setting most responsible for avoiding "buying a dip that's actually the start of a crash."
Gray line = neutral. Red = in overbought zone. Blue = in oversold zone.
A triangle signal only appears after price has confirmed its way back out of the zone (controlled by "Bars to Confirm Exit From Zone") — this is what prevents you from selling into a strong momentum spike that keeps climbing.
The bands themselves move (adaptive mode) — during high volatility they widen, so you don't get an overbought signal every 20 minutes; during quiet chop they tighten, so you still catch real extremes.
The trend filter checks a daily EMA by default — it will block sell signals while the daily trend is up, and block buy signals while the daily trend is down. This is the setting most responsible for avoiding "buying a dip that's actually the start of a crash."
Release Note
How it works, and how to tune it:Gray line = neutral. Red = in overbought zone. Blue = in oversold zone.
A triangle signal only appears after price has confirmed its way back out of the zone (controlled by "Bars to Confirm Exit From Zone") — this is what prevents you from selling into a strong momentum spike that keeps climbing.
The bands themselves move (adaptive mode) — during high volatility they widen, so you don't get an overbought signal every 20 minutes; during quiet chop they tighten, so you still catch real extremes.
The trend filter checks a daily EMA by default — it will block sell signals while the daily trend is up, and block buy signals while the daily trend is down. This is the setting most responsible for avoiding "buying a dip that's actually the start of a crash."
สคริปต์แบบโอเพนซอร์ส
ด้วยเจตนารมณ์หลักของ TradingView ผู้สร้างสคริปต์นี้ได้ทำให้เป็นโอเพนซอร์ส เพื่อให้เทรดเดอร์สามารถตรวจสอบและยืนยันฟังก์ชันการทำงานของมันได้ ขอชื่นชมผู้เขียน! แม้ว่าคุณจะใช้งานได้ฟรี แต่โปรดจำไว้ว่าการเผยแพร่โค้ดซ้ำจะต้องเป็นไปตาม กฎระเบียบการใช้งาน ของเรา

คำจำกัดสิทธิ์ความรับผิดชอบ
ข้อมูลและบทความไม่ได้มีวัตถุประสงค์เพื่อก่อให้เกิดกิจกรรมทางการเงิน, การลงทุน, การซื้อขาย, ข้อเสนอแนะ หรือคำแนะนำประเภทอื่น ๆ ที่ให้หรือรับรองโดย TradingView อ่านเพิ่มเติมใน ข้อกำหนดการใช้งาน
สคริปต์แบบโอเพนซอร์ส
ด้วยเจตนารมณ์หลักของ TradingView ผู้สร้างสคริปต์นี้ได้ทำให้เป็นโอเพนซอร์ส เพื่อให้เทรดเดอร์สามารถตรวจสอบและยืนยันฟังก์ชันการทำงานของมันได้ ขอชื่นชมผู้เขียน! แม้ว่าคุณจะใช้งานได้ฟรี แต่โปรดจำไว้ว่าการเผยแพร่โค้ดซ้ำจะต้องเป็นไปตาม กฎระเบียบการใช้งาน ของเรา
คำจำกัดสิทธิ์ความรับผิดชอบ
ข้อมูลและบทความไม่ได้มีวัตถุประสงค์เพื่อก่อให้เกิดกิจกรรมทางการเงิน, การลงทุน, การซื้อขาย, ข้อเสนอแนะ หรือคำแนะนำประเภทอื่น ๆ ที่ให้หรือรับรองโดย TradingView อ่านเพิ่มเติมใน ข้อกำหนดการใช้งาน