OPEN-SOURCE SCRIPT
ที่อัปเดต: Price Action Scan: Pulse, Rhythm & Drift [TechnicalZen]
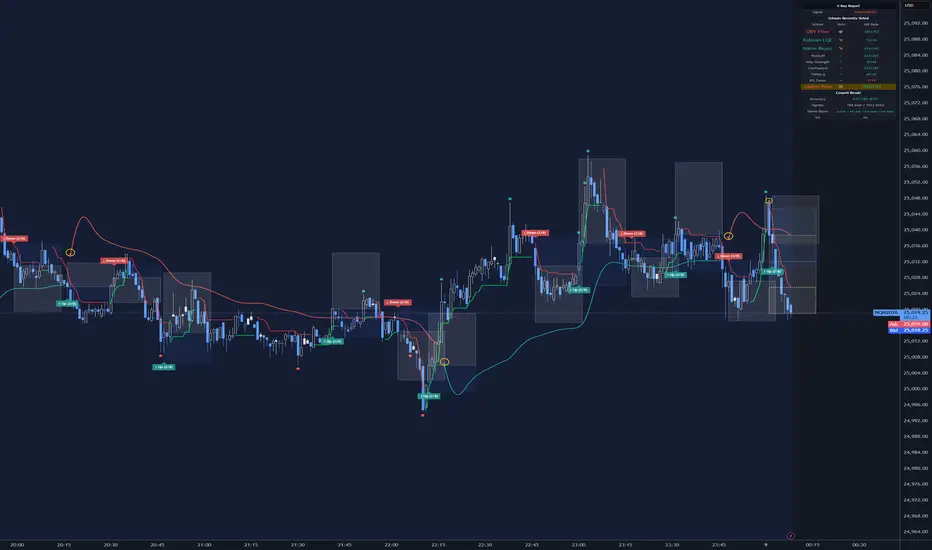
Visualize the nested cycles of impulse, swing and trend as professionals see them.
Every chart has three stories running at the same time. You just have to know where to listen.
There's the impulse — the fast, nervous heartbeat of bar-to-bar action. Is this candle a fake-out, or the start of something? There's the swing — the slower rhythm of regimes, the tide that carries a cluster of candles in one direction before it turns. And beneath both, there's the trend — the deep current that doesn't care what the last five bars did, the one that's still pointing north while everything on the surface looks like it's falling apart.
Most indicators hear one of these and talk over the other two. This one tries to listen to all three — separately, at their own natural pace — and show you where they agree and where they don't.
What it actually does on your chart:
Every school's accuracy is tracked live on your chart — not backtested on some ideal instrument, but measured in real time on yours, using Maximum Favorable Excursion over a 12-bar window. A dashboard shows each school's vote, its recent history, and its running hit-rate. You'll know within days which schools are earning their place on your symbol and which ones are just noise.
The real edge isn't any single layer — it's watching all three breathe together. A council impulse signal during a clean adaptive trend in the direction of the EVWAP drift is a very different animal from the same signal fighting the other two. The indicator doesn't force that observation on you. It just gives you the pieces. You'll start seeing the pattern yourself.
———
Builds on TrueMove: Council of 7 Schools — the original council, its voting engine, its dashboard, its VWAP structure — all unchanged and fully intact. What's new are two additions:
———
Addition 1 — An eighth school: RSI Zones
The council is now a vote of eight, not seven. The new voter is a classical RSI zone school with a directional bias — it casts a bullish or bearish vote when price closes inside a configurable zone and the move has momentum behind it. The idea was to give the council a "pure price memory" voice, since the other seven schools lean heavily on volume, structure, or learned features. RSI Zones balances the ensemble a little, and earns or loses its place on your instrument the same way every other school does — through its own running hit-rate in the dashboard.
You can turn it off in settings if you prefer the council at seven.
———
Addition 2 — A ninth school that doesn't vote: Adaptive Pivots
This is the bigger change, and the one that changes how the chart feels.
Adaptive Pivots is an adaptive SuperTrend overlay that runs completely independently of the eight council schools — its own ATR, its own Efficiency Ratio, its own quality index, its own state machine. It doesn't contribute to the council vote and the council doesn't feed into it. They simply share the chart.
It earns the name "school" only because it keeps its own running hit-rate and gets a row of its own in the dashboard — a yellow-highlighted row so you can see at a glance that it lives slightly outside the council. When the adaptive trend flips, you see:
Under the hood it's an adaptive SuperTrend whose band widths are modulated by a four-factor Trend Quality Index — a composite that blends directional efficiency, volume regime, structural position within range, and momentum persistence. The bands tighten asymmetrically on the active side of the trend and widen on the passive side, so the ratchet locks tight when quality is high and loosens gracefully when quality degrades. A character-flip mechanism catches regime collapse before price has to break the band, which is what gives it its earlier reaction on quality-driven reversals.
———
A small thing that might happen once you have it running
The council fires often — that's its job. The RSI zone school will vote, the Naive Bayes will vote, the Confluence will catch agreements, and labels will come and go on the chart like a heartbeat.
The adaptive line, on the other hand, sits quiet for long stretches and then flips.
And somewhere in the background, the same EVWAP line from the original is drifting along at its own slow pace, occasionally marking its own direction change with a quiet yellow-circled arrow.
Leave the chart open for a while and you'll start noticing something — the three tempos drift in and out of agreement. A council signal during a clean adaptive trend feels different from a council signal against the adaptive trend. An adaptive flip while EVWAP is still drifting the other way feels different from a flip that agrees with EVWAP. None of this is enforced by the script; it just happens, because the three things are measuring genuinely different properties of the same price series.
I don't want to over-describe it. It's the kind of thing you notice rather than read about, and I'd rather you notice it on your own instrument than take my word for how it behaves on mine.
———
Dashboard and transparency
The top-right panel is still there and still shows every school individually — current vote, recent vote history, running hit-rate tracked by Maximum Favorable Excursion over a 12-bar window. The new Adaptive Pivots row sits just below the eight council schools, highlighted in yellow so it's clear it's scored independently. The council accuracy, signal counts, Naive Bayes learning status, and volatility regime readouts are all unchanged from the 7 Schools version.
All nine schools can be toggled individually. The adaptive layer's ATR length, pivot length, quality influence, and character-flip sensitivity are all exposed in settings. Everything else uses well-tested defaults.
———
How to get something out of it
The honest advice is the same advice I'd give for the original: don't act on it for a while. Put it on a chart you already trade, in replay or live, and watch. See when the council and Adaptive Pivots agree. See when they don't. Notice which of the nine schools is earning its keep on your symbol and which ones are drifting. The dashboard is telling you the truth about your instrument, not about mine.
If you find a setting that works better for you than the defaults, keep it. If you find one that doesn't work at all, let me know — it's the kind of feedback I genuinely use.
———
Disclaimer
This indicator is a decision-support and analytical tool. It is not financial advice, a trading signal service, or a recommendation to buy or sell any instrument. The hit-rate figures displayed in the dashboard are measured from historical bars on your chart using Maximum Favorable Excursion over a fixed 12-bar window — they are a diagnostic of how each school has behaved on that specific chart up to the current bar, not a predictor of future performance, and not a claim of profitability. Past behavior of any indicator, including this one, does not guarantee or imply future results.
Markets involve substantial risk of loss. Any decision to act on information derived from this script is entirely your own. You are responsible for your own position sizing, risk management, and trade execution. The author accepts no liability for any loss, direct or indirect, arising from the use of this script.
Use it as a lens for reading charts, not as a crystal ball. Always trade within your own risk tolerance and regulatory environment.
Every chart has three stories running at the same time. You just have to know where to listen.
There's the impulse — the fast, nervous heartbeat of bar-to-bar action. Is this candle a fake-out, or the start of something? There's the swing — the slower rhythm of regimes, the tide that carries a cluster of candles in one direction before it turns. And beneath both, there's the trend — the deep current that doesn't care what the last five bars did, the one that's still pointing north while everything on the surface looks like it's falling apart.
Most indicators hear one of these and talk over the other two. This one tries to listen to all three — separately, at their own natural pace — and show you where they agree and where they don't.
What it actually does on your chart:
- Impulse layer — Eight analytical schools (OBV Flow, RSI Zones, Wyckoff, Amplitude, VWMA Delta, Kalman Filter, Naive Bayes, Confluence) each watch the tape through a different lens. When two or more vote the same direction within a few bars, a signal fires with auto-drawn SL and TP zones. Quick, frequent, surgical.
- Swing layer — An adaptive trend engine (Adaptive Pivots) tracks regime shifts independently. It sits quiet during trends and flips when the character of the move breaks down — drawing its own SL/TP zones in light yellow so you never confuse them with the council's. Slower, fewer signals, bigger picture.
- Trend layer — An exponential VWAP (EVWAP) drifts underneath everything, marking the deep structural direction with quiet yellow arrows when it finally turns. Slowest of the three. The gravity that the other two orbit around.
Every school's accuracy is tracked live on your chart — not backtested on some ideal instrument, but measured in real time on yours, using Maximum Favorable Excursion over a 12-bar window. A dashboard shows each school's vote, its recent history, and its running hit-rate. You'll know within days which schools are earning their place on your symbol and which ones are just noise.
The real edge isn't any single layer — it's watching all three breathe together. A council impulse signal during a clean adaptive trend in the direction of the EVWAP drift is a very different animal from the same signal fighting the other two. The indicator doesn't force that observation on you. It just gives you the pieces. You'll start seeing the pattern yourself.
———
Builds on TrueMove: Council of 7 Schools — the original council, its voting engine, its dashboard, its VWAP structure — all unchanged and fully intact. What's new are two additions:
———
Addition 1 — An eighth school: RSI Zones
The council is now a vote of eight, not seven. The new voter is a classical RSI zone school with a directional bias — it casts a bullish or bearish vote when price closes inside a configurable zone and the move has momentum behind it. The idea was to give the council a "pure price memory" voice, since the other seven schools lean heavily on volume, structure, or learned features. RSI Zones balances the ensemble a little, and earns or loses its place on your instrument the same way every other school does — through its own running hit-rate in the dashboard.
You can turn it off in settings if you prefer the council at seven.
———
Addition 2 — A ninth school that doesn't vote: Adaptive Pivots
This is the bigger change, and the one that changes how the chart feels.
Adaptive Pivots is an adaptive SuperTrend overlay that runs completely independently of the eight council schools — its own ATR, its own Efficiency Ratio, its own quality index, its own state machine. It doesn't contribute to the council vote and the council doesn't feed into it. They simply share the chart.
It earns the name "school" only because it keeps its own running hit-rate and gets a row of its own in the dashboard — a yellow-highlighted row so you can see at a glance that it lives slightly outside the council. When the adaptive trend flips, you see:
- a small yellow-ringed triangle at the flip point
- a continuous green or red line showing the current regime
- three stacked take-profit zones and a stop-loss zone, framed in light yellow dotted outlines so they're visibly distinct from the council's own risk visuals
Under the hood it's an adaptive SuperTrend whose band widths are modulated by a four-factor Trend Quality Index — a composite that blends directional efficiency, volume regime, structural position within range, and momentum persistence. The bands tighten asymmetrically on the active side of the trend and widen on the passive side, so the ratchet locks tight when quality is high and loosens gracefully when quality degrades. A character-flip mechanism catches regime collapse before price has to break the band, which is what gives it its earlier reaction on quality-driven reversals.
———
A small thing that might happen once you have it running
The council fires often — that's its job. The RSI zone school will vote, the Naive Bayes will vote, the Confluence will catch agreements, and labels will come and go on the chart like a heartbeat.
The adaptive line, on the other hand, sits quiet for long stretches and then flips.
And somewhere in the background, the same EVWAP line from the original is drifting along at its own slow pace, occasionally marking its own direction change with a quiet yellow-circled arrow.
Leave the chart open for a while and you'll start noticing something — the three tempos drift in and out of agreement. A council signal during a clean adaptive trend feels different from a council signal against the adaptive trend. An adaptive flip while EVWAP is still drifting the other way feels different from a flip that agrees with EVWAP. None of this is enforced by the script; it just happens, because the three things are measuring genuinely different properties of the same price series.
I don't want to over-describe it. It's the kind of thing you notice rather than read about, and I'd rather you notice it on your own instrument than take my word for how it behaves on mine.
———
Dashboard and transparency
The top-right panel is still there and still shows every school individually — current vote, recent vote history, running hit-rate tracked by Maximum Favorable Excursion over a 12-bar window. The new Adaptive Pivots row sits just below the eight council schools, highlighted in yellow so it's clear it's scored independently. The council accuracy, signal counts, Naive Bayes learning status, and volatility regime readouts are all unchanged from the 7 Schools version.
All nine schools can be toggled individually. The adaptive layer's ATR length, pivot length, quality influence, and character-flip sensitivity are all exposed in settings. Everything else uses well-tested defaults.
———
How to get something out of it
The honest advice is the same advice I'd give for the original: don't act on it for a while. Put it on a chart you already trade, in replay or live, and watch. See when the council and Adaptive Pivots agree. See when they don't. Notice which of the nine schools is earning its keep on your symbol and which ones are drifting. The dashboard is telling you the truth about your instrument, not about mine.
If you find a setting that works better for you than the defaults, keep it. If you find one that doesn't work at all, let me know — it's the kind of feedback I genuinely use.
———
Disclaimer
This indicator is a decision-support and analytical tool. It is not financial advice, a trading signal service, or a recommendation to buy or sell any instrument. The hit-rate figures displayed in the dashboard are measured from historical bars on your chart using Maximum Favorable Excursion over a fixed 12-bar window — they are a diagnostic of how each school has behaved on that specific chart up to the current bar, not a predictor of future performance, and not a claim of profitability. Past behavior of any indicator, including this one, does not guarantee or imply future results.
Markets involve substantial risk of loss. Any decision to act on information derived from this script is entirely your own. You are responsible for your own position sizing, risk management, and trade execution. The author accepts no liability for any loss, direct or indirect, arising from the use of this script.
Use it as a lens for reading charts, not as a crystal ball. Always trade within your own risk tolerance and regulatory environment.
Release Note
Comment Added. สคริปต์แบบโอเพนซอร์ส
ด้วยเจตนารมณ์หลักของ TradingView ผู้สร้างสคริปต์นี้ได้ทำให้เป็นโอเพนซอร์ส เพื่อให้เทรดเดอร์สามารถตรวจสอบและยืนยันฟังก์ชันการทำงานของมันได้ ขอชื่นชมผู้เขียน! แม้ว่าคุณจะใช้งานได้ฟรี แต่โปรดจำไว้ว่าการเผยแพร่โค้ดซ้ำจะต้องเป็นไปตาม กฎระเบียบการใช้งาน ของเรา

คำจำกัดสิทธิ์ความรับผิดชอบ
ข้อมูลและบทความไม่ได้มีวัตถุประสงค์เพื่อก่อให้เกิดกิจกรรมทางการเงิน, การลงทุน, การซื้อขาย, ข้อเสนอแนะ หรือคำแนะนำประเภทอื่น ๆ ที่ให้หรือรับรองโดย TradingView อ่านเพิ่มเติมใน ข้อกำหนดการใช้งาน
สคริปต์แบบโอเพนซอร์ส
ด้วยเจตนารมณ์หลักของ TradingView ผู้สร้างสคริปต์นี้ได้ทำให้เป็นโอเพนซอร์ส เพื่อให้เทรดเดอร์สามารถตรวจสอบและยืนยันฟังก์ชันการทำงานของมันได้ ขอชื่นชมผู้เขียน! แม้ว่าคุณจะใช้งานได้ฟรี แต่โปรดจำไว้ว่าการเผยแพร่โค้ดซ้ำจะต้องเป็นไปตาม กฎระเบียบการใช้งาน ของเรา
คำจำกัดสิทธิ์ความรับผิดชอบ
ข้อมูลและบทความไม่ได้มีวัตถุประสงค์เพื่อก่อให้เกิดกิจกรรมทางการเงิน, การลงทุน, การซื้อขาย, ข้อเสนอแนะ หรือคำแนะนำประเภทอื่น ๆ ที่ให้หรือรับรองโดย TradingView อ่านเพิ่มเติมใน ข้อกำหนดการใช้งาน