OPEN-SOURCE SCRIPT
SyncroFlow RSI [Trend & Momentum]
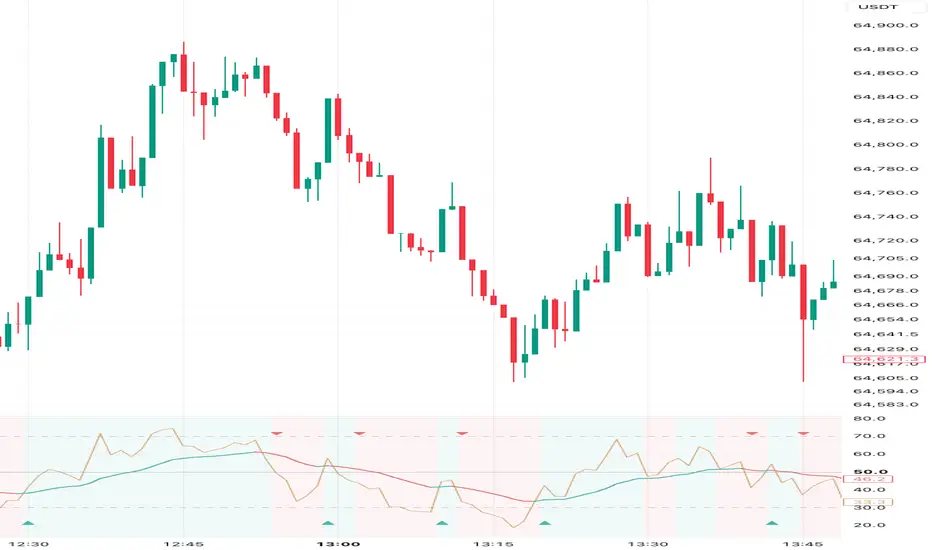
Title: SyncroFlow RSI [Trend & Momentum]
Description:
SyncroFlow RSI is a modern, visually clean indicator designed to help traders objectively identify points of confluence between macro trend direction and short-term momentum.
By combining the structural trend analysis of the SuperTrend with the momentum dynamics of the RSI and its EMA, this tool provides a clear, noise-free visualization of market flow. It is built with a calming, pastel-based color palette to reduce eye strain during long charting sessions, allowing for calm and rational market analysis.
🌟 Core Concepts
Macro Trend (Background Color):
The indicator calculates a short-term SuperTrend (default 10, 1.0) and projects its direction as a subtle background color. A Teal background indicates a bullish overarching trend, while a Rose Red background indicates a bearish trend.
Momentum Flow (RSI & EMA):
Instead of just looking at overbought/oversold levels, this script focuses on the trajectory of the RSI. It plots the RSI alongside a smoothing EMA. The EMA changes color (Teal/Red) based on its slope, giving you an immediate read on whether short-term momentum is accelerating or decelerating.
SyncroFlow Signals (Triangles):
The true edge of this indicator lies in its "Sync" logic. When the overarching trend (SuperTrend Background) and the short-term momentum (RSI's EMA slope) align in the same direction, the indicator plots a triangle signal. This highlights the exact moment the market regains its directional harmony.
⚙️ Key Features
Alternating Signal Filter: To prevent signal spam during choppy consolidations or complex pullbacks, the script includes a strict alternating filter. It will only print a bullish signal if the previous signal was bearish (and vice versa), ensuring you only see the most significant structural shifts.
Calm & Minimalist Aesthetics: Designed with custom Earth and Pastel tones to keep your charts looking professional and easy on the eyes.
Highly Customizable: Everything is neatly grouped in the settings panel. You can easily adjust the RSI length, SuperTrend sensitivity, toggle visuals (hide background or signals), and fully customize the colors/transparency to match your dark or light chart theme.
💡 How to Interpret the Data
Trend Continuation (Pullbacks): During a strong Teal background (Bullish SuperTrend), wait for the RSI's EMA to briefly turn red (pullback), and then look for the Bullish Sync Triangle (alignment) as a potential objective area to rejoin the trend.
Objective Environment Assessment: If the background is Teal but the EMA line is consistently Red, it visually warns you that the macro trend and micro momentum are fighting each other (consolidation/chop).
Disclaimer: This script is designed for educational and objective environmental analysis purposes only. It is not a standalone mechanical trading system. Always use it in conjunction with your own price action analysis and risk management rules.
Description:
SyncroFlow RSI is a modern, visually clean indicator designed to help traders objectively identify points of confluence between macro trend direction and short-term momentum.
By combining the structural trend analysis of the SuperTrend with the momentum dynamics of the RSI and its EMA, this tool provides a clear, noise-free visualization of market flow. It is built with a calming, pastel-based color palette to reduce eye strain during long charting sessions, allowing for calm and rational market analysis.
🌟 Core Concepts
Macro Trend (Background Color):
The indicator calculates a short-term SuperTrend (default 10, 1.0) and projects its direction as a subtle background color. A Teal background indicates a bullish overarching trend, while a Rose Red background indicates a bearish trend.
Momentum Flow (RSI & EMA):
Instead of just looking at overbought/oversold levels, this script focuses on the trajectory of the RSI. It plots the RSI alongside a smoothing EMA. The EMA changes color (Teal/Red) based on its slope, giving you an immediate read on whether short-term momentum is accelerating or decelerating.
SyncroFlow Signals (Triangles):
The true edge of this indicator lies in its "Sync" logic. When the overarching trend (SuperTrend Background) and the short-term momentum (RSI's EMA slope) align in the same direction, the indicator plots a triangle signal. This highlights the exact moment the market regains its directional harmony.
⚙️ Key Features
Alternating Signal Filter: To prevent signal spam during choppy consolidations or complex pullbacks, the script includes a strict alternating filter. It will only print a bullish signal if the previous signal was bearish (and vice versa), ensuring you only see the most significant structural shifts.
Calm & Minimalist Aesthetics: Designed with custom Earth and Pastel tones to keep your charts looking professional and easy on the eyes.
Highly Customizable: Everything is neatly grouped in the settings panel. You can easily adjust the RSI length, SuperTrend sensitivity, toggle visuals (hide background or signals), and fully customize the colors/transparency to match your dark or light chart theme.
💡 How to Interpret the Data
Trend Continuation (Pullbacks): During a strong Teal background (Bullish SuperTrend), wait for the RSI's EMA to briefly turn red (pullback), and then look for the Bullish Sync Triangle (alignment) as a potential objective area to rejoin the trend.
Objective Environment Assessment: If the background is Teal but the EMA line is consistently Red, it visually warns you that the macro trend and micro momentum are fighting each other (consolidation/chop).
Disclaimer: This script is designed for educational and objective environmental analysis purposes only. It is not a standalone mechanical trading system. Always use it in conjunction with your own price action analysis and risk management rules.
สคริปต์โอเพนซอร์ซ
ด้วยเจตนารมณ์หลักของ TradingView ผู้สร้างสคริปต์นี้ได้ทำให้เป็นโอเพนซอร์ส เพื่อให้เทรดเดอร์สามารถตรวจสอบและยืนยันฟังก์ชันการทำงานของมันได้ ขอชื่นชมผู้เขียน! แม้ว่าคุณจะใช้งานได้ฟรี แต่โปรดจำไว้ว่าการเผยแพร่โค้ดซ้ำจะต้องเป็นไปตาม กฎระเบียบการใช้งาน ของเรา

คำจำกัดสิทธิ์ความรับผิดชอบ
ข้อมูลและบทความไม่ได้มีวัตถุประสงค์เพื่อก่อให้เกิดกิจกรรมทางการเงิน, การลงทุน, การซื้อขาย, ข้อเสนอแนะ หรือคำแนะนำประเภทอื่น ๆ ที่ให้หรือรับรองโดย TradingView อ่านเพิ่มเติมใน ข้อกำหนดการใช้งาน
สคริปต์โอเพนซอร์ซ
ด้วยเจตนารมณ์หลักของ TradingView ผู้สร้างสคริปต์นี้ได้ทำให้เป็นโอเพนซอร์ส เพื่อให้เทรดเดอร์สามารถตรวจสอบและยืนยันฟังก์ชันการทำงานของมันได้ ขอชื่นชมผู้เขียน! แม้ว่าคุณจะใช้งานได้ฟรี แต่โปรดจำไว้ว่าการเผยแพร่โค้ดซ้ำจะต้องเป็นไปตาม กฎระเบียบการใช้งาน ของเรา
คำจำกัดสิทธิ์ความรับผิดชอบ
ข้อมูลและบทความไม่ได้มีวัตถุประสงค์เพื่อก่อให้เกิดกิจกรรมทางการเงิน, การลงทุน, การซื้อขาย, ข้อเสนอแนะ หรือคำแนะนำประเภทอื่น ๆ ที่ให้หรือรับรองโดย TradingView อ่านเพิ่มเติมใน ข้อกำหนดการใช้งาน