Quantum Flow Scanner
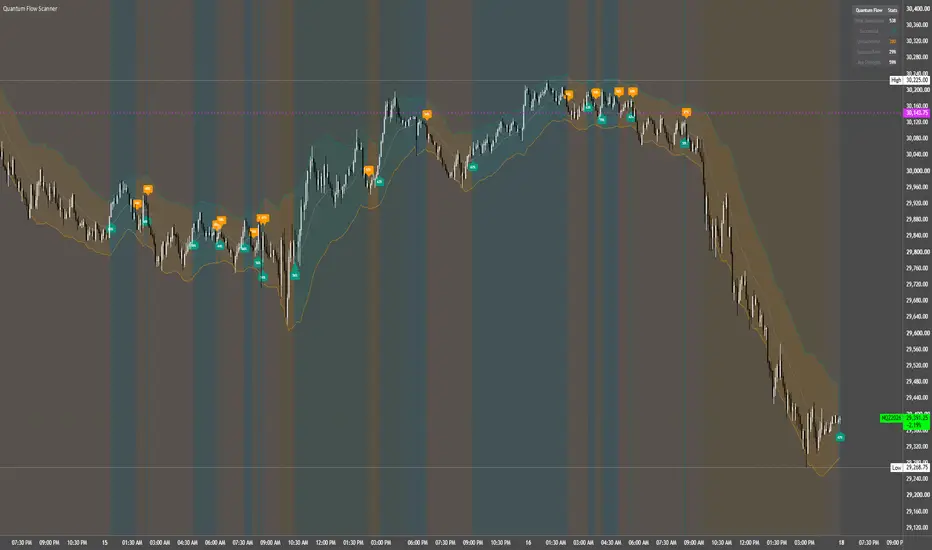
Quantum Flow Scanner combines EMA crossover detections, an ATR-based price channel, a multi-factor strength score, and a historical outcome table in one chart overlay.
The indicator is designed to help users evaluate trend transitions, volatility, and directional context using a transparent set of calculations.
Despite its name, this is a single-symbol chart indicator—not a multi-symbol scanner. It uses price, ATR, and chart volume data, not order flow, bid/ask data, or institutional positioning.
TREND AND DETECTION ENGINE
The indicator uses two exponential moving averages:
A bullish detection occurs when the fast EMA crosses above the slow EMA and price closes above the channel midline.
A bearish detection occurs when the fast EMA crosses below the slow EMA and price closes below the channel midline.
The channel fill and optional background shading follow the relationship between the fast and slow EMAs. They show the current EMA trend state, not necessarily a new detection.
Strength scores and higher-timeframe alignment do not filter detections. They provide additional context for signals generated by the crossover and midline conditions.
DYNAMIC ATR CHANNEL
The channel consists of:
HLC3 is the average of the high, low, and close.
Default settings use a 14-period ATR and a 2.5 distance multiplier. The bands expand and contract as ATR changes.
The midline, upper band, lower band, channel fill, and trend background can be toggled independently.
These bands provide volatility context. They are not guaranteed support, resistance, or reversal levels.
DETECTION STRENGTH SCORE
Each detection can display a percentage derived from eight equally weighted factors:
The combined score is scaled to a theoretical 25–92 range and displayed with a percent sign.
This percentage is a heuristic score—not a probability of success, accuracy rating, or statistically calibrated forecast.
Several factors are direction-neutral. For example, a larger candle body contributes regardless of candle direction, and distance from the midline uses an absolute value.
The trend-duration factor normally starts at zero on a fresh crossover, including the detection bar.
Although the settings include “Pattern Recognition Length,” the implementation does not recognize named chart patterns or use machine learning. This length affects recent swing context and trend-duration normalization. A separate directional-consistency calculation exists in the code but is not included in the final strength score.
The volume component is relative volume, not a volume profile. Instruments without usable volume data may not produce valid strength readings.
REFERENCE TIMEFRAME CONTEXT
The reference timeframe compares the fast and slow EMAs and contributes one component to the strength score. It does not block signals that disagree with that timeframe.
Users can select a timeframe manually or leave the setting blank for automatic selection:
The automatic selection is not always higher than the chart timeframe. On minute-based intervals above 240 minutes, the cap selects a lower interval. On monthly charts, the selected monthly interval is the same timeframe.
Check this setting against your chart interval before interpreting the alignment component.
HISTORICAL OUTCOME TABLE
The table summarizes detections using user-defined stop and target distances in price points.
Default distances:
Each detection records its reference entry at the detection bar’s closing price. Beginning on subsequent bars, the script checks whether price reaches the associated stop or target.
The table displays:
Unresolved detections remain pending and are excluded from the success-rate denominator. Multiple detections can remain active simultaneously, including opposing detections. A new signal does not close an earlier one.
Stop and target inputs are absolute price distances—not ticks, percentages, or dollar-risk amounts.
WHAT THE TABLE DOES NOT MEASURE
This is an indicator-based outcome tracker, not TradingView’s Strategy Tester.
The calculations do not model:
Results depend on the symbol, timeframe, settings, and available chart history. Changing stop and target distances also changes the meaning of the displayed success rate.
The table should not be presented as verified trading performance or evidence of future profitability.
ALERTS AND DISPLAY OPTIONS
The script includes separate bullish and bearish detection alerts.
Users can customize:
Hiding markers or strength labels does not disable detection calculations, alerts, or outcome tracking.
SUGGESTED WORKFLOW
LIVE-BAR BEHAVIOR AND LIMITATIONS
Signals are not explicitly restricted to closed candles. Detections, labels, scores, and table readings can change while the current candle develops.
For close-based notifications, select “Once Per Bar Close” when creating an alert.
Reference-timeframe calculations use developing data and may change before those candles close. The indicator should not be described as non-repainting.
EMA crossovers are lagging and may generate repeated signals during sideways conditions. No setting guarantees reliable signals across all instruments or timeframes.
DISCLAIMER
For educational and analytical use only. This indicator does not provide personalized financial advice or guarantee trading results. Users are responsible for their own analysis, risk management, position sizing, and execution decisions.
The indicator is designed to help users evaluate trend transitions, volatility, and directional context using a transparent set of calculations.
Despite its name, this is a single-symbol chart indicator—not a multi-symbol scanner. It uses price, ATR, and chart volume data, not order flow, bid/ask data, or institutional positioning.
TREND AND DETECTION ENGINE
The indicator uses two exponential moving averages:
- Fast EMA: Default length of 9.
- Slow EMA: Default length of 21.
A bullish detection occurs when the fast EMA crosses above the slow EMA and price closes above the channel midline.
A bearish detection occurs when the fast EMA crosses below the slow EMA and price closes below the channel midline.
The channel fill and optional background shading follow the relationship between the fast and slow EMAs. They show the current EMA trend state, not necessarily a new detection.
Strength scores and higher-timeframe alignment do not filter detections. They provide additional context for signals generated by the crossover and midline conditions.
DYNAMIC ATR CHANNEL
The channel consists of:
- Midline: An EMA of HLC3, using the slow-period setting.
- Upper band: Midline + ATR × Distance Multiplier.
- Lower band: Midline − ATR × Distance Multiplier.
HLC3 is the average of the high, low, and close.
Default settings use a 14-period ATR and a 2.5 distance multiplier. The bands expand and contract as ATR changes.
The midline, upper band, lower band, channel fill, and trend background can be toggled independently.
These bands provide volatility context. They are not guaranteed support, resistance, or reversal levels.
DETECTION STRENGTH SCORE
Each detection can display a percentage derived from eight equally weighted factors:
- ATR relative to its 50-period average.
- The proportion of recent bars with a rising fast EMA, inverted for bearish scoring.
- Absolute price distance from the channel midline, normalized by channel width.
- Time elapsed since the relevant EMA crossover.
- EMA alignment on the selected reference timeframe.
- Current volume relative to its 20-period average.
- Candle body size relative to its full range.
- Closing-price position within the recent high-low range.
The combined score is scaled to a theoretical 25–92 range and displayed with a percent sign.
This percentage is a heuristic score—not a probability of success, accuracy rating, or statistically calibrated forecast.
Several factors are direction-neutral. For example, a larger candle body contributes regardless of candle direction, and distance from the midline uses an absolute value.
The trend-duration factor normally starts at zero on a fresh crossover, including the detection bar.
Although the settings include “Pattern Recognition Length,” the implementation does not recognize named chart patterns or use machine learning. This length affects recent swing context and trend-duration normalization. A separate directional-consistency calculation exists in the code but is not included in the final strength score.
The volume component is relative volume, not a volume profile. Instruments without usable volume data may not produce valid strength readings.
REFERENCE TIMEFRAME CONTEXT
The reference timeframe compares the fast and slow EMAs and contributes one component to the strength score. It does not block signals that disagree with that timeframe.
Users can select a timeframe manually or leave the setting blank for automatic selection:
- Seconds charts: 5 minutes.
- Minute-based charts: Four times the chart interval, capped at 240 minutes.
- Daily charts: Weekly.
- Other chart types: Monthly.
The automatic selection is not always higher than the chart timeframe. On minute-based intervals above 240 minutes, the cap selects a lower interval. On monthly charts, the selected monthly interval is the same timeframe.
Check this setting against your chart interval before interpreting the alignment component.
HISTORICAL OUTCOME TABLE
The table summarizes detections using user-defined stop and target distances in price points.
Default distances:
- Stop: 10 price points.
- Target: 20 price points.
Each detection records its reference entry at the detection bar’s closing price. Beginning on subsequent bars, the script checks whether price reaches the associated stop or target.
- Successful: The target is reached before the stop under the script’s bar-based rules.
- Unsuccessful: The stop is reached first.
- Same-bar conflict: If a later candle touches both levels, the detection is counted as unsuccessful because the stop check has priority.
The table displays:
- Total detections.
- Successful detections.
- Unsuccessful detections.
- Success rate among resolved detections.
- Average strength across all recorded detections.
Unresolved detections remain pending and are excluded from the success-rate denominator. Multiple detections can remain active simultaneously, including opposing detections. A new signal does not close an earlier one.
Stop and target inputs are absolute price distances—not ticks, percentages, or dollar-risk amounts.
WHAT THE TABLE DOES NOT MEASURE
This is an indicator-based outcome tracker, not TradingView’s Strategy Tester.
The calculations do not model:
- Position sizing or account equity.
- Commissions, spreads, slippage, or realistic order fills.
- Portfolio exposure or limits on simultaneous positions.
- Intrabar price sequence beyond the stop-first rule.
- Net profit, drawdown, or risk-adjusted returns.
Results depend on the symbol, timeframe, settings, and available chart history. Changing stop and target distances also changes the meaning of the displayed success rate.
The table should not be presented as verified trading performance or evidence of future profitability.
ALERTS AND DISPLAY OPTIONS
The script includes separate bullish and bearish detection alerts.
Users can customize:
- Fast and slow EMA periods.
- Pattern recognition length and momentum cluster size.
- ATR period and channel distance multiplier.
- Reference timeframe.
- Bullish and bearish colors.
- Detection markers and strength labels.
- Channel elements and background shading.
- Outcome-tracking stop and target distances.
- Performance table visibility.
Hiding markers or strength labels does not disable detection calculations, alerts, or outcome tracking.
SUGGESTED WORKFLOW
- Review the channel and background for the current EMA trend context.
- Check that the reference timeframe suits your chart interval.
- Evaluate new crossover detections alongside market structure and your own analysis.
- Use strength labels as relative context—not as win probabilities.
- Review the outcome table with its stop-first assumptions and unresolved detections in mind.
LIVE-BAR BEHAVIOR AND LIMITATIONS
Signals are not explicitly restricted to closed candles. Detections, labels, scores, and table readings can change while the current candle develops.
For close-based notifications, select “Once Per Bar Close” when creating an alert.
Reference-timeframe calculations use developing data and may change before those candles close. The indicator should not be described as non-repainting.
EMA crossovers are lagging and may generate repeated signals during sideways conditions. No setting guarantees reliable signals across all instruments or timeframes.
DISCLAIMER
For educational and analytical use only. This indicator does not provide personalized financial advice or guarantee trading results. Users are responsible for their own analysis, risk management, position sizing, and execution decisions.

คำจำกัดสิทธิ์ความรับผิดชอบ
ข้อมูลและบทความไม่ได้มีวัตถุประสงค์เพื่อก่อให้เกิดกิจกรรมทางการเงิน, การลงทุน, การซื้อขาย, ข้อเสนอแนะ หรือคำแนะนำประเภทอื่น ๆ ที่ให้หรือรับรองโดย TradingView อ่านเพิ่มเติมใน ข้อกำหนดการใช้งาน
คำจำกัดสิทธิ์ความรับผิดชอบ
ข้อมูลและบทความไม่ได้มีวัตถุประสงค์เพื่อก่อให้เกิดกิจกรรมทางการเงิน, การลงทุน, การซื้อขาย, ข้อเสนอแนะ หรือคำแนะนำประเภทอื่น ๆ ที่ให้หรือรับรองโดย TradingView อ่านเพิ่มเติมใน ข้อกำหนดการใช้งาน