ที่อัปเดต:
LTW XAUUSD Session References
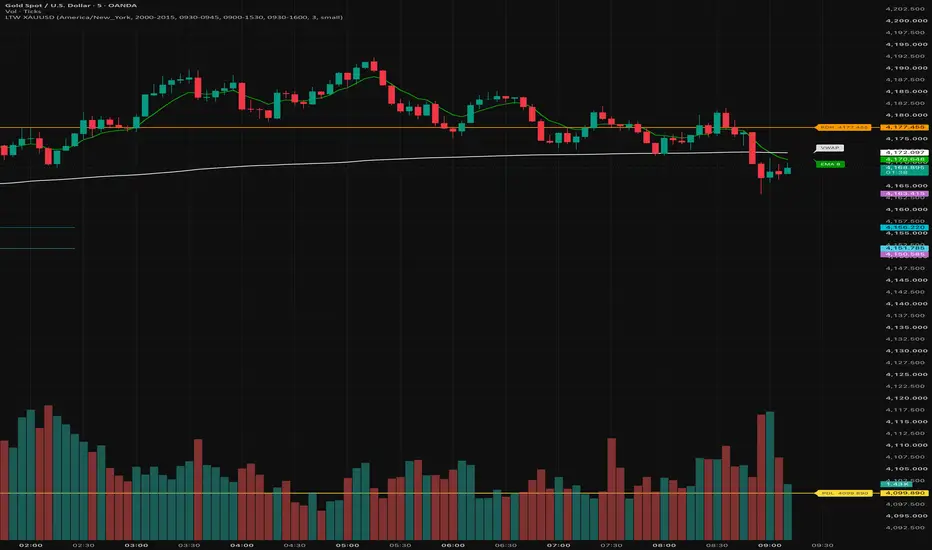
LTW XAUUSD Session References is a chart overlay for reviewing spot gold during the Tokyo and New York sessions. LTW means Lubana Trading World; XAUUSD denotes gold quoted in US dollars. It brings together a short-term average, the feed's session volume-weighted average, completed 15-minute opening ranges, and up to four completed daily high/low pairs.
Purpose and how to use the combination
The workflow is to compare the current session's activity with both its opening range and the preceding daily ranges. EMA 8 provides a responsive reference for recent closing prices. Session VWAP supplies a separate, volume-weighted reference for the current broker session. Tokyo/NY opening-range highs and lows mark the extremes of a precisely defined initial interval. The daily pairs show where those intraday references sit relative to recent completed broker days. These references answer different questions; agreement between them does not establish a trade signal or profitable setup.
For example, on a standard 5-minute XAUUSD chart during New York, first wait for the 09:30-09:45 New York range to finish. Compare subsequent candles with NY ORH/ORL and VWAP, then use EMA 8 and the daily pairs to inspect the surrounding price context. A move through a range boundary followed by a return can be inspected visually, but this script does not detect, score or alert on breakouts or retests. It does not select entries, stops or profit targets. Setups and execution decisions require a separate method.
What the implementation adds
EMA and VWAP use standard calculations; no new formula or predictive edge is claimed. The custom behavior coordinates exact completed-range coverage, session-specific display, daily-reference drawings, and matching labels. It prevents a range from being presented as complete when its source window is partial or has missing bars. Source-timeframe selection preserves more usable history for standard windows while excluding a candle's prices outside the specified 15 minutes. Tokyo and NY ranges disappear outside their own display windows, while historical segments remain within those windows. Reusable daily lines show the current reference set without joining successive days with diagonal or stepped lines. These behaviors address timing, stale-level and chart-reading problems in the stated gold-session workflow.
Calculations and defaults
EMA 8 is the exponential moving average of closing prices over eight chart bars, shown in green. Its length is fixed at eight; changing the chart interval changes the time represented by those bars.
The white Session VWAP weights each chart bar's typical price, (high + low + close) / 3, by the volume supplied by the selected feed. Accumulation resets when the symbol's daily period changes. It uses the chart timeframe, no deviation bands and no plot offset. VWAP is hidden on daily and higher charts. Its broker-defined daily boundary is separate from the opening-range reset described below.
The default opening-range calculation windows are 20:00-20:15 for Tokyo and 09:30-09:45 for New York, both expressed in America/New_York. Each range is the highest high and lowest low of that complete 15-minute interval. It is withheld until the interval has closed and the chart has received its result. A chart bar that straddles the ending time does not contribute prices beyond that time. Standard windows use exact 15-minute source candles; custom windows aligned to five minutes use 5-minute candles; other custom starts use 1-minute candles. Coverage must be contiguous and match the specified start and end. Keep edited calculation windows exactly 15 minutes long. Missing history or invalid/incomplete coverage leaves the affected range blank.
Opening-range state resets at 18:00 America/New_York. Each range also has an independent display window: Tokyo 09:00-15:30 Asia/Tokyo and NY 09:30-16:00 America/New_York by default. A completed range is visible only on intraday intervals below one hour and only during its own display window. Its label disappears with it. These are display choices, not statements that spot gold closes at those times. Both calculation and display windows can be edited.
The Tokyo calculation is fixed to New York time by default, so its Tokyo equivalent changes with US daylight saving: 20:00 New York is 09:00 Tokyo the following day during US daylight time and 10:00 during US standard time. The Tokyo display window remains in Tokyo local time. Review these inputs when matching another session convention. There is no London range in this version.
PDH and PDL are the high and low of the immediately previous completed broker daily candle, including its overnight trading, and are enabled by default. Independent options add the second, third and fourth previous completed daily candles, labeled PD2H/PD2L through PD4H/PD4L. Non-trading days are skipped. Daily highs default to orange and lows to yellow. The first pair is solid; older pairs are thin and dashed. These levels appear on intraday and daily charts and are hidden above daily.
Timing, drawings and limitations
EMA and VWAP can move while a chart candle develops. A completed opening range stays fixed for its gold day, subject to vendor data corrections. Daily values use only completed candles: the daily high/low expressions are offset by one to four daily bars before being carried forward. The developing daily candle is excluded. The source uses lookahead_on for those already-offset daily values; opening-range requests use lookahead_off.
Daily horizontal lines extend left and right across the visible chart. They represent the latest live or Bar Replay day's reference set, not the levels that were known at every earlier candle crossed by the lines. Their backward extension must not be read as historical signal evidence. Pane labels sit beside the latest values; their horizontal offset moves labels only and does not predict future prices. Label visibility, offset and size are configurable. Line colors are configurable, including independent NY high/low colors.
Use standard time-based candles, preferably 2-minute or 5-minute XAUUSD, with full-session history. Synthetic chart types have not been validated. Gold feeds differ in daily boundaries, prices and volume; spot-gold volume may represent tick activity rather than centralized exchange volume. VWAP and daily levels can consequently differ between brokers. A first loaded session with incomplete history can also have an incomplete VWAP accumulation. Platform history limits particularly affect custom lower-timeframe ranges. Blank ranges are not trading signals.
This is an open-source reference overlay, not a strategy backtest or order system. It contains no trade alerts and makes no claim about profitability, accuracy or future results.
Purpose and how to use the combination
The workflow is to compare the current session's activity with both its opening range and the preceding daily ranges. EMA 8 provides a responsive reference for recent closing prices. Session VWAP supplies a separate, volume-weighted reference for the current broker session. Tokyo/NY opening-range highs and lows mark the extremes of a precisely defined initial interval. The daily pairs show where those intraday references sit relative to recent completed broker days. These references answer different questions; agreement between them does not establish a trade signal or profitable setup.
For example, on a standard 5-minute XAUUSD chart during New York, first wait for the 09:30-09:45 New York range to finish. Compare subsequent candles with NY ORH/ORL and VWAP, then use EMA 8 and the daily pairs to inspect the surrounding price context. A move through a range boundary followed by a return can be inspected visually, but this script does not detect, score or alert on breakouts or retests. It does not select entries, stops or profit targets. Setups and execution decisions require a separate method.
What the implementation adds
EMA and VWAP use standard calculations; no new formula or predictive edge is claimed. The custom behavior coordinates exact completed-range coverage, session-specific display, daily-reference drawings, and matching labels. It prevents a range from being presented as complete when its source window is partial or has missing bars. Source-timeframe selection preserves more usable history for standard windows while excluding a candle's prices outside the specified 15 minutes. Tokyo and NY ranges disappear outside their own display windows, while historical segments remain within those windows. Reusable daily lines show the current reference set without joining successive days with diagonal or stepped lines. These behaviors address timing, stale-level and chart-reading problems in the stated gold-session workflow.
Calculations and defaults
EMA 8 is the exponential moving average of closing prices over eight chart bars, shown in green. Its length is fixed at eight; changing the chart interval changes the time represented by those bars.
The white Session VWAP weights each chart bar's typical price, (high + low + close) / 3, by the volume supplied by the selected feed. Accumulation resets when the symbol's daily period changes. It uses the chart timeframe, no deviation bands and no plot offset. VWAP is hidden on daily and higher charts. Its broker-defined daily boundary is separate from the opening-range reset described below.
The default opening-range calculation windows are 20:00-20:15 for Tokyo and 09:30-09:45 for New York, both expressed in America/New_York. Each range is the highest high and lowest low of that complete 15-minute interval. It is withheld until the interval has closed and the chart has received its result. A chart bar that straddles the ending time does not contribute prices beyond that time. Standard windows use exact 15-minute source candles; custom windows aligned to five minutes use 5-minute candles; other custom starts use 1-minute candles. Coverage must be contiguous and match the specified start and end. Keep edited calculation windows exactly 15 minutes long. Missing history or invalid/incomplete coverage leaves the affected range blank.
Opening-range state resets at 18:00 America/New_York. Each range also has an independent display window: Tokyo 09:00-15:30 Asia/Tokyo and NY 09:30-16:00 America/New_York by default. A completed range is visible only on intraday intervals below one hour and only during its own display window. Its label disappears with it. These are display choices, not statements that spot gold closes at those times. Both calculation and display windows can be edited.
The Tokyo calculation is fixed to New York time by default, so its Tokyo equivalent changes with US daylight saving: 20:00 New York is 09:00 Tokyo the following day during US daylight time and 10:00 during US standard time. The Tokyo display window remains in Tokyo local time. Review these inputs when matching another session convention. There is no London range in this version.
PDH and PDL are the high and low of the immediately previous completed broker daily candle, including its overnight trading, and are enabled by default. Independent options add the second, third and fourth previous completed daily candles, labeled PD2H/PD2L through PD4H/PD4L. Non-trading days are skipped. Daily highs default to orange and lows to yellow. The first pair is solid; older pairs are thin and dashed. These levels appear on intraday and daily charts and are hidden above daily.
Timing, drawings and limitations
EMA and VWAP can move while a chart candle develops. A completed opening range stays fixed for its gold day, subject to vendor data corrections. Daily values use only completed candles: the daily high/low expressions are offset by one to four daily bars before being carried forward. The developing daily candle is excluded. The source uses lookahead_on for those already-offset daily values; opening-range requests use lookahead_off.
Daily horizontal lines extend left and right across the visible chart. They represent the latest live or Bar Replay day's reference set, not the levels that were known at every earlier candle crossed by the lines. Their backward extension must not be read as historical signal evidence. Pane labels sit beside the latest values; their horizontal offset moves labels only and does not predict future prices. Label visibility, offset and size are configurable. Line colors are configurable, including independent NY high/low colors.
Use standard time-based candles, preferably 2-minute or 5-minute XAUUSD, with full-session history. Synthetic chart types have not been validated. Gold feeds differ in daily boundaries, prices and volume; spot-gold volume may represent tick activity rather than centralized exchange volume. VWAP and daily levels can consequently differ between brokers. A first loaded session with incomplete history can also have an incomplete VWAP accumulation. Platform history limits particularly affect custom lower-timeframe ranges. Blank ranges are not trading signals.
This is an open-source reference overlay, not a strategy backtest or order system. It contains no trade alerts and makes no claim about profitability, accuracy or future results.
Release Note
Added P4H High and P4H Low: the high and low of the broker's 4-hour candle immediately before the current live candle. The pair stays fixed throughout the current 4H candle and updates when the next 4H candle begins. It is enabled by default under Previous 4H candle, with an on/off switch and independent high/low colors.The dotted horizontal references, price-scale values and pane labels are visible on chart timeframes up to and including 4H. Bar Replay uses the previous completed 4H candle at the replay point. Candle boundaries follow the selected symbol's data feed. Lines extend across the view as current references; the left extension does not represent historical signals.

คำจำกัดสิทธิ์ความรับผิดชอบ
ข้อมูลและบทความไม่ได้มีวัตถุประสงค์เพื่อก่อให้เกิดกิจกรรมทางการเงิน, การลงทุน, การซื้อขาย, ข้อเสนอแนะ หรือคำแนะนำประเภทอื่น ๆ ที่ให้หรือรับรองโดย TradingView อ่านเพิ่มเติมใน ข้อกำหนดการใช้งาน
คำจำกัดสิทธิ์ความรับผิดชอบ
ข้อมูลและบทความไม่ได้มีวัตถุประสงค์เพื่อก่อให้เกิดกิจกรรมทางการเงิน, การลงทุน, การซื้อขาย, ข้อเสนอแนะ หรือคำแนะนำประเภทอื่น ๆ ที่ให้หรือรับรองโดย TradingView อ่านเพิ่มเติมใน ข้อกำหนดการใช้งาน