Momentum Oscillator Modified
# Momentum Oscillator Modified
## Overview
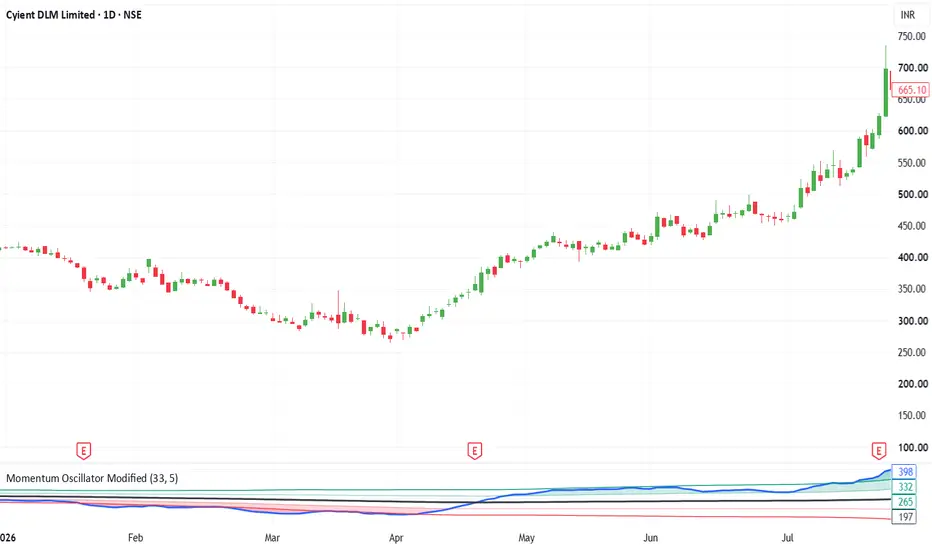
Momentum Oscillator Modified is a volatility-adjusted momentum oscillator that combines two price-based components:
1. A lookback price-change component that compares the current close with the close from a selected number of bars ago.
2. A True Range-adjusted component that compares the current close with a smoothed True Range measure.
The average of these components is smoothed with an EMA to reduce short-term noise. Bollinger-style bands are then calculated around the oscillator to provide a dynamic reference for unusually strong or weak momentum readings.
This indicator uses price and True Range only. It does not use volume, bid/ask data, order flow, market breadth, or external timeframe data.
## How the oscillator is calculated
The script first calculates True Range from the current high, low, and previous close. It then applies an EMA to True Range using the selected Length.
The lookback price component is:
Price Change = Current Close - Close from Length bars ago
The volatility-adjusted component is:
Price Delta = Current Close - EMA of True Range
The raw oscillator is the average of Price Change and Price Delta. The final oscillator is an EMA-smoothed version of that average using the selected Smoothing Factor.
The oscillator is not normalized to a fixed 0-100 scale. Its absolute values can vary between symbols and timeframes.
## Dynamic bands
The script calculates Bollinger-style bands on the oscillator using a lookback of Length multiplied by five.
- The inner upper and lower bands use one standard deviation.
- The expanded upper and lower bands use two standard deviations.
- The black Dynamic Mean is the midpoint of the expanded bands and represents the oscillator's moving average baseline.
The green and red fills highlight periods when the oscillator moves beyond the corresponding bands.
## Inputs
### Length
Controls the price-change lookback, the True Range EMA length, and the base period used to calculate the oscillator bands.
Higher values generally create a slower and smoother context. Lower values generally make the oscillator more responsive but can increase noise.
### Smoothing Factor
Controls the EMA smoothing applied to the raw oscillator.
Lower values respond more quickly to price changes. Higher values reduce noise but can delay momentum shifts.
## How to use
Use the oscillator as a momentum and market-context tool together with price action and risk management.
- Values above the Dynamic Mean indicate that the oscillator is above its moving baseline.
- Values below the Dynamic Mean indicate that the oscillator is below its moving baseline.
- A move above the inner upper band indicates stronger-than-usual upside momentum relative to the recent oscillator range.
- A move below the inner lower band indicates stronger-than-usual downside momentum.
- A move beyond an expanded band indicates an unusually extreme oscillator reading and may represent strong momentum, possible continuation, or possible exhaustion depending on the surrounding price structure.
Users may compare band breaks with breakouts, support and resistance, trend direction, and candle-close confirmation. A band break is not a standalone buy or sell signal.
For mean-reversion analysis, users may monitor whether an extreme oscillator reading returns inside its band. This should not be interpreted as a guaranteed reversal without independent price confirmation.
## Limitations
This indicator is based only on OHLC price data and True Range. It does not measure actual buying and selling pressure, volume imbalance, bid/ask delta, or order flow.
The oscillator is not normalized, so its numerical values are not directly comparable across all symbols and timeframes.
Band excursions may occur during strong trends and do not necessarily indicate an immediate reversal. Signals can be delayed by smoothing and can produce false readings in sideways, low-liquidity, or highly volatile markets.
The current candle can change the oscillator and band values before the candle closes. Users should consider candle-close confirmation when interpreting live readings.
This script does not intentionally use future data, historical plot offsets, or external timeframe data. It does not guarantee signal accuracy, profitability, or future performance.
## Attribution
Original-source attribution:
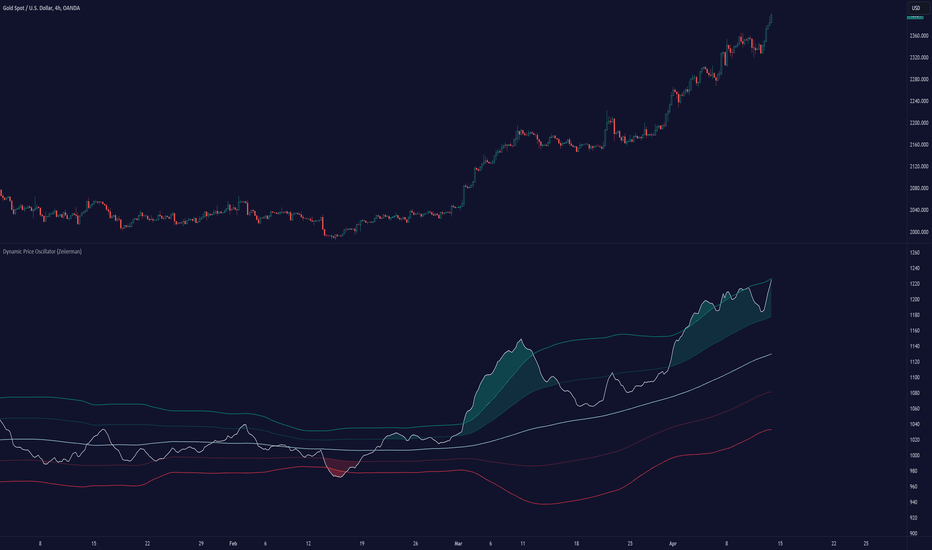
The core Dynamic Price Oscillator calculation in this script is derived from the open-source “Dynamic Price Oscillator” by Zeiierman:
This indicator is provided for educational and analytical purposes only. It is not investment advice.
## Overview
Momentum Oscillator Modified is a volatility-adjusted momentum oscillator that combines two price-based components:
1. A lookback price-change component that compares the current close with the close from a selected number of bars ago.
2. A True Range-adjusted component that compares the current close with a smoothed True Range measure.
The average of these components is smoothed with an EMA to reduce short-term noise. Bollinger-style bands are then calculated around the oscillator to provide a dynamic reference for unusually strong or weak momentum readings.
This indicator uses price and True Range only. It does not use volume, bid/ask data, order flow, market breadth, or external timeframe data.
## How the oscillator is calculated
The script first calculates True Range from the current high, low, and previous close. It then applies an EMA to True Range using the selected Length.
The lookback price component is:
Price Change = Current Close - Close from Length bars ago
The volatility-adjusted component is:
Price Delta = Current Close - EMA of True Range
The raw oscillator is the average of Price Change and Price Delta. The final oscillator is an EMA-smoothed version of that average using the selected Smoothing Factor.
The oscillator is not normalized to a fixed 0-100 scale. Its absolute values can vary between symbols and timeframes.
## Dynamic bands
The script calculates Bollinger-style bands on the oscillator using a lookback of Length multiplied by five.
- The inner upper and lower bands use one standard deviation.
- The expanded upper and lower bands use two standard deviations.
- The black Dynamic Mean is the midpoint of the expanded bands and represents the oscillator's moving average baseline.
The green and red fills highlight periods when the oscillator moves beyond the corresponding bands.
## Inputs
### Length
Controls the price-change lookback, the True Range EMA length, and the base period used to calculate the oscillator bands.
Higher values generally create a slower and smoother context. Lower values generally make the oscillator more responsive but can increase noise.
### Smoothing Factor
Controls the EMA smoothing applied to the raw oscillator.
Lower values respond more quickly to price changes. Higher values reduce noise but can delay momentum shifts.
## How to use
Use the oscillator as a momentum and market-context tool together with price action and risk management.
- Values above the Dynamic Mean indicate that the oscillator is above its moving baseline.
- Values below the Dynamic Mean indicate that the oscillator is below its moving baseline.
- A move above the inner upper band indicates stronger-than-usual upside momentum relative to the recent oscillator range.
- A move below the inner lower band indicates stronger-than-usual downside momentum.
- A move beyond an expanded band indicates an unusually extreme oscillator reading and may represent strong momentum, possible continuation, or possible exhaustion depending on the surrounding price structure.
Users may compare band breaks with breakouts, support and resistance, trend direction, and candle-close confirmation. A band break is not a standalone buy or sell signal.
For mean-reversion analysis, users may monitor whether an extreme oscillator reading returns inside its band. This should not be interpreted as a guaranteed reversal without independent price confirmation.
## Limitations
This indicator is based only on OHLC price data and True Range. It does not measure actual buying and selling pressure, volume imbalance, bid/ask delta, or order flow.
The oscillator is not normalized, so its numerical values are not directly comparable across all symbols and timeframes.
Band excursions may occur during strong trends and do not necessarily indicate an immediate reversal. Signals can be delayed by smoothing and can produce false readings in sideways, low-liquidity, or highly volatile markets.
The current candle can change the oscillator and band values before the candle closes. Users should consider candle-close confirmation when interpreting live readings.
This script does not intentionally use future data, historical plot offsets, or external timeframe data. It does not guarantee signal accuracy, profitability, or future performance.
## Attribution
Original-source attribution:
The core Dynamic Price Oscillator calculation in this script is derived from the open-source “Dynamic Price Oscillator” by Zeiierman:
This indicator is provided for educational and analytical purposes only. It is not investment advice.

คำจำกัดสิทธิ์ความรับผิดชอบ
ข้อมูลและบทความไม่ได้มีวัตถุประสงค์เพื่อก่อให้เกิดกิจกรรมทางการเงิน, การลงทุน, การซื้อขาย, ข้อเสนอแนะ หรือคำแนะนำประเภทอื่น ๆ ที่ให้หรือรับรองโดย TradingView อ่านเพิ่มเติมใน ข้อกำหนดการใช้งาน
คำจำกัดสิทธิ์ความรับผิดชอบ
ข้อมูลและบทความไม่ได้มีวัตถุประสงค์เพื่อก่อให้เกิดกิจกรรมทางการเงิน, การลงทุน, การซื้อขาย, ข้อเสนอแนะ หรือคำแนะนำประเภทอื่น ๆ ที่ให้หรือรับรองโดย TradingView อ่านเพิ่มเติมใน ข้อกำหนดการใช้งาน