ที่อัปเดต:
Sloped Support & Resistance (No REPAINT)
🛡️ NO REPAINTING
One of the core strengths of this script is its non-repainting nature.
The slope of support and resistance is calculated at the moment a pivot high or pivot low is confirmed and is NEVER recalculated.
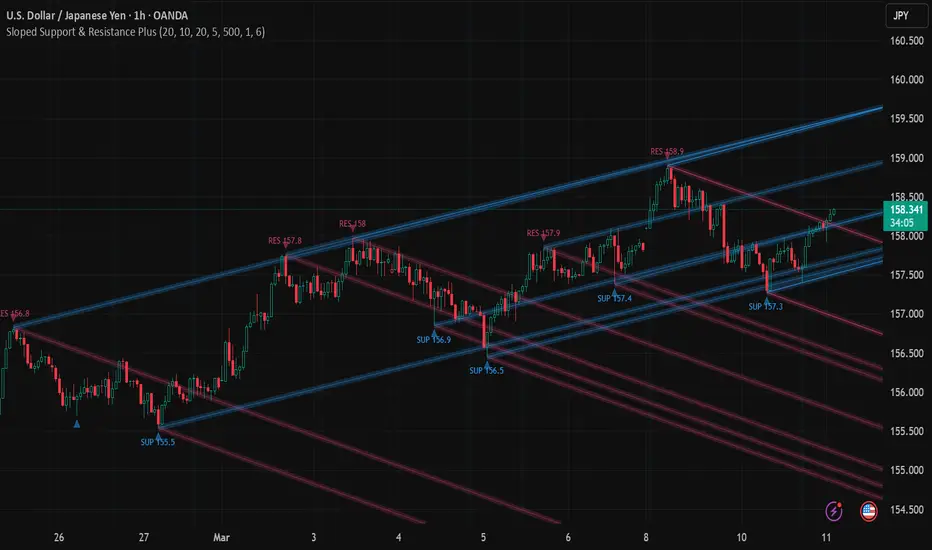
▶Sloped Support & Resistance with Dynamic Projection
This indicator identifies key pivot points and projects Sloped Support and Resistance lines based on the average historical price movement. Unlike static horizontal levels, this script accounts for the current trend's trajectory to provide more dynamic price targets and zones.
▶Key Features
Smart Slope Calculation: Instead of simple horizontal lines, it calculates the average slope between recent pivot highs/lows.
Auto-Fading History: Older levels automatically dim and labels are cleaned up to keep your chart organized and focused on the most relevant data.
Fully Customizable: Adjust the calculation window, pivot sensitivity (Left/Right bars), and visual styles to match your trading timeframe.
▶How it Works
Pivot Detection: The script identifies Pivot Highs (Resistance) and Pivot Lows (Support) based on your chosen lookback periods.
Average Slope: It measures the price difference between consecutive pivots and calculates an average slope over a specified "Calculation Window."
Projection: Lines are projected into the future (500 bars by default) using the calculated slope, helping you anticipate where the next interaction might occur.
▶Input Settings
Left/Right Bars: Controls the sensitivity of pivot detection.
Calculation Window: The number of previous slopes to average.
Max History: Limits the number of active lines displayed on the chart.
Projection Length: How far into the future the lines extend.
Glow/Line Width: Aesthetic controls for visual clarity.
▶Usage Tip
These sloped lines are particularly useful for identifying descending resistance in downtrends and ascending support in uptrends. Use them to spot potential breakout points or trend exhaustion zones.
Disclaimer:
This indicator is for educational and informational purposes only and does not constitute financial advice.
Release Note
Key Updates1. Inverse Slope Projection
Added an option to project slopes based on the opposite trend from Pivot Highs (PH) and Pivot Lows (PL).
From PH (Resistance): Displays both the standard bearish slope and a bullish slope (Blue) based on PL.
From PL (Support): Displays both the standard bullish slope and a bearish slope (Red) based on PH.
Toggle: Enable/disable via Show Inverse Slopes... in settings.
Release Note
This update introduces advanced filtering and visual customization to improve chart clarity and analysis precision.🚀 New Features
1. ATR-Based Pivot Filtering
Eliminate market noise by filtering out minor price pivots.
Mechanism: Pivots are only validated if their price movement exceeds a specific threshold (ATR × Multiplier).
Benefit: Displays only significant support and resistance levels, reducing chart clutter.
2. Enhanced Color Customization
Fully customize the indicator's look to match your chart theme.
Theme Colors: Select primary colors for Bull and Bear levels.
Auto-Styling: Glow effects and faded historical lines are automatically calculated based on your chosen colors.
3. Granular Transparency Control
Adjust visibility across four distinct stages:
Main Line: Transparency of the active levels.
Dim Line: Transparency of historical levels.
Glow Line: Intensity of the "glow" effect on active levels.
Dim Glow: Intensity of the "glow" on historical levels.

คำจำกัดสิทธิ์ความรับผิดชอบ
ข้อมูลและบทความไม่ได้มีวัตถุประสงค์เพื่อก่อให้เกิดกิจกรรมทางการเงิน, การลงทุน, การซื้อขาย, ข้อเสนอแนะ หรือคำแนะนำประเภทอื่น ๆ ที่ให้หรือรับรองโดย TradingView อ่านเพิ่มเติมใน ข้อกำหนดการใช้งาน
คำจำกัดสิทธิ์ความรับผิดชอบ
ข้อมูลและบทความไม่ได้มีวัตถุประสงค์เพื่อก่อให้เกิดกิจกรรมทางการเงิน, การลงทุน, การซื้อขาย, ข้อเสนอแนะ หรือคำแนะนำประเภทอื่น ๆ ที่ให้หรือรับรองโดย TradingView อ่านเพิ่มเติมใน ข้อกำหนดการใช้งาน