EMA Cross Trend Entries [5 TP + SL + Key Levels]
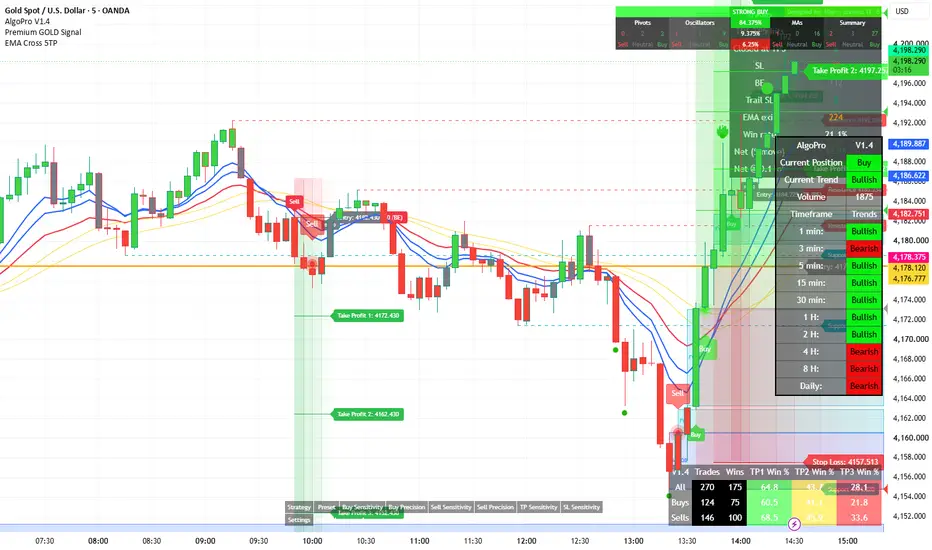
EMA Cross Trend Entries combines a filtered EMA crossover with a complete, on-chart trade plan: entry, stop loss, five take-profit levels, breakeven, and key market levels — so every signal shows exactly where you're risking and where you're targeting.
Built and tested for XAUUSD on the 5-minute chart, but fully configurable for any symbol and timeframe.
━━━━━━━━━━━━━━━━━━━━
HOW IT WORKS
━━━━━━━━━━━━━━━━━━━━
The script plots four lines:
- EMA 13 (blue) and EMA 21 (red)
- A 14-period EMA smoothing of each (yellow) — these act as a slower trend filter
BUY signal
1. EMA 13 crosses above EMA 21
2. Within the next few candles (default 3), a candle CLOSES above all four lines
3. Entry is plotted at the open of the following candle
SELL signal — the exact mirror.
Requiring a close beyond both the fast EMAs and their smoothed versions filters out many of the weak, choppy crosses a plain 2-EMA crossover produces. Each cross can only produce one trade, and only one trade is tracked at a time.
Signals are confirmed on candle close and entries are drawn on the next candle's open, so signals do not repaint.
━━━━━━━━━━━━━━━━━━━━
TRADE MANAGEMENT
━━━━━━━━━━━━━━━━━━━━
- Stop Loss — placed at the low (buy) or high (sell) of the 5th candle back, with optional buffer
- Take Profit 1–5 — fixed distances from entry (default $10 / $20 / $30 / $40 / $50), each marked with a ✓ when reached
- Breakeven — stop moves to entry once price moves a set amount in your favour (default $5)
- Optional trailing — TP1 hit → SL to breakeven, TP2 hit → SL to TP1, and so on
- Early exit — closes the trade if a candle closes back across the EMAs (choose EMA 13, EMA 13 & 21, or all 4 lines)
Every trade is drawn as a shaded risk/reward zone with right-side price tags for Entry, Stop Loss and each Take Profit, plus a label showing how the trade ended (TP, SL, BE, Trail SL or EMA Exit).
━━━━━━━━━━━━━━━━━━━━
KEY LEVELS
━━━━━━━━━━━━━━━━━━━━
- Previous Day High (PDH) and Previous Day Low (PDL)
- Automatic support and resistance from confirmed swing pivots (latest 3 each side by default)
Use these to judge whether a signal has room to reach its targets or is running straight into a level.
━━━━━━━━━━━━━━━━━━━━
STATS PANEL
━━━━━━━━━━━━━━━━━━━━
Shows how the rules performed on the loaded chart history: number of trades, hits per TP level, exits by type (SL / BE / Trail / EMA), win rate and net result in price and in account currency for a chosen lot size.
━━━━━━━━━━━━━━━━━━━━
SETTINGS
━━━━━━━━━━━━━━━━━━━━
All parameters are adjustable: EMA lengths, cross window, SL candle and buffer, number and distance of TPs, breakeven trigger, trailing, exit mode, number of past trades shown, zone colours, PDH/PDL and pivot sensitivity.
ALERTS
"EMA 13/21 BUY" and "EMA 13/21 SELL" alerts fire when a signal candle closes.
━━━━━━━━━━━━━━━━━━━━
NOTES
━━━━━━━━━━━━━━━━━━━━
- The stats are a simplified simulation on chart data: one full position per trade, no spread, commission or slippage. When a candle touches both SL and TP, the SL is assumed to hit first. Results are for evaluating the rules only.
- Pivot support/resistance is confirmed after the "right bars" setting, so new levels appear with that delay.
- This indicator is a tool for analysis and education, not financial advice. Past performance does not guarantee future results. Always test on a demo account and use proper risk management.
Built and tested for XAUUSD on the 5-minute chart, but fully configurable for any symbol and timeframe.
━━━━━━━━━━━━━━━━━━━━
HOW IT WORKS
━━━━━━━━━━━━━━━━━━━━
The script plots four lines:
- EMA 13 (blue) and EMA 21 (red)
- A 14-period EMA smoothing of each (yellow) — these act as a slower trend filter
BUY signal
1. EMA 13 crosses above EMA 21
2. Within the next few candles (default 3), a candle CLOSES above all four lines
3. Entry is plotted at the open of the following candle
SELL signal — the exact mirror.
Requiring a close beyond both the fast EMAs and their smoothed versions filters out many of the weak, choppy crosses a plain 2-EMA crossover produces. Each cross can only produce one trade, and only one trade is tracked at a time.
Signals are confirmed on candle close and entries are drawn on the next candle's open, so signals do not repaint.
━━━━━━━━━━━━━━━━━━━━
TRADE MANAGEMENT
━━━━━━━━━━━━━━━━━━━━
- Stop Loss — placed at the low (buy) or high (sell) of the 5th candle back, with optional buffer
- Take Profit 1–5 — fixed distances from entry (default $10 / $20 / $30 / $40 / $50), each marked with a ✓ when reached
- Breakeven — stop moves to entry once price moves a set amount in your favour (default $5)
- Optional trailing — TP1 hit → SL to breakeven, TP2 hit → SL to TP1, and so on
- Early exit — closes the trade if a candle closes back across the EMAs (choose EMA 13, EMA 13 & 21, or all 4 lines)
Every trade is drawn as a shaded risk/reward zone with right-side price tags for Entry, Stop Loss and each Take Profit, plus a label showing how the trade ended (TP, SL, BE, Trail SL or EMA Exit).
━━━━━━━━━━━━━━━━━━━━
KEY LEVELS
━━━━━━━━━━━━━━━━━━━━
- Previous Day High (PDH) and Previous Day Low (PDL)
- Automatic support and resistance from confirmed swing pivots (latest 3 each side by default)
Use these to judge whether a signal has room to reach its targets or is running straight into a level.
━━━━━━━━━━━━━━━━━━━━
STATS PANEL
━━━━━━━━━━━━━━━━━━━━
Shows how the rules performed on the loaded chart history: number of trades, hits per TP level, exits by type (SL / BE / Trail / EMA), win rate and net result in price and in account currency for a chosen lot size.
━━━━━━━━━━━━━━━━━━━━
SETTINGS
━━━━━━━━━━━━━━━━━━━━
All parameters are adjustable: EMA lengths, cross window, SL candle and buffer, number and distance of TPs, breakeven trigger, trailing, exit mode, number of past trades shown, zone colours, PDH/PDL and pivot sensitivity.
ALERTS
"EMA 13/21 BUY" and "EMA 13/21 SELL" alerts fire when a signal candle closes.
━━━━━━━━━━━━━━━━━━━━
NOTES
━━━━━━━━━━━━━━━━━━━━
- The stats are a simplified simulation on chart data: one full position per trade, no spread, commission or slippage. When a candle touches both SL and TP, the SL is assumed to hit first. Results are for evaluating the rules only.
- Pivot support/resistance is confirmed after the "right bars" setting, so new levels appear with that delay.
- This indicator is a tool for analysis and education, not financial advice. Past performance does not guarantee future results. Always test on a demo account and use proper risk management.

Waseem Mohammad
คำจำกัดสิทธิ์ความรับผิดชอบ
ข้อมูลและบทความไม่ได้มีวัตถุประสงค์เพื่อก่อให้เกิดกิจกรรมทางการเงิน, การลงทุน, การซื้อขาย, ข้อเสนอแนะ หรือคำแนะนำประเภทอื่น ๆ ที่ให้หรือรับรองโดย TradingView อ่านเพิ่มเติมใน ข้อกำหนดการใช้งาน
Waseem Mohammad
คำจำกัดสิทธิ์ความรับผิดชอบ
ข้อมูลและบทความไม่ได้มีวัตถุประสงค์เพื่อก่อให้เกิดกิจกรรมทางการเงิน, การลงทุน, การซื้อขาย, ข้อเสนอแนะ หรือคำแนะนำประเภทอื่น ๆ ที่ให้หรือรับรองโดย TradingView อ่านเพิ่มเติมใน ข้อกำหนดการใช้งาน