OPEN-SOURCE SCRIPT
ที่อัปเดต: Vol Regime Compass [N4]
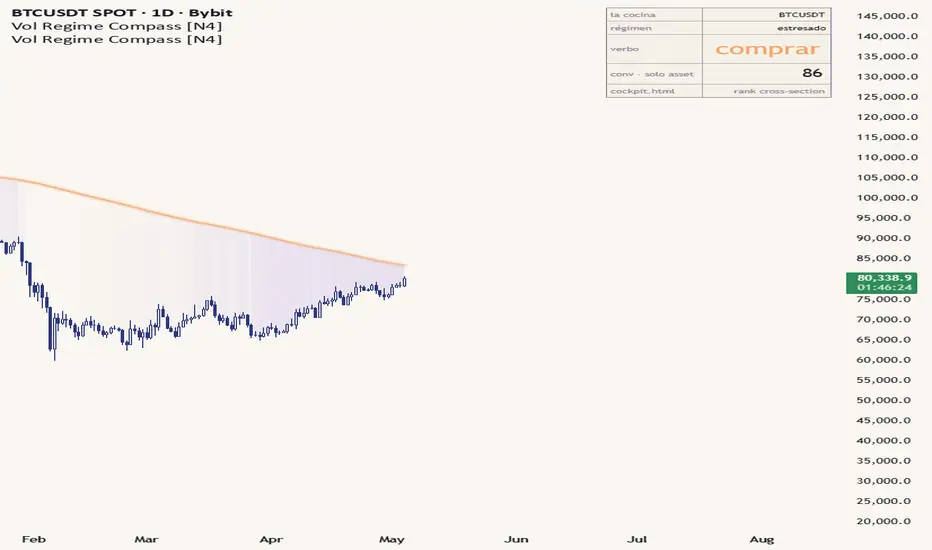
Vol Regime Compass [N4]
verb · size · regime — three words a week
A volatility-regime indicator for swing and position traders that converts each asset's own 252-day vol distribution into a verb (BUY+/BUY/REDUCE/WAIT/OBSERVE) and a sizing % (25-200%) — so DCA execution becomes a 5-second decision, not an open question.

The 5-second HUD
Every Monday morning you open the chart. You see three words:
[code]Verb buy
Size 125%
Regime NORMAL[/code]
Verb = the action. Do it.
Size % = what fraction of your base DCA this week.
Regime = why the verb says what it says.
Everything else is diagnostic, off by default.
Five verbs. Five size bands. No dissonance.
Why WAIT and never SKIP — Taleb's rule: in markets with asymmetric upside, never go to zero. Size down, don't size zero.

What makes it different
1. Asset-relative percentile, not fixed thresholds. BTC, NASDAQ, gold, copper — completely different vol distributions. A "vol > 2.0" threshold works on one asset and fails on another. Vol Regime Compass uses percentile rank against the asset's own 252-day vol history. Scale-free, transferable across assets without re-tuning.
2. Critical Slowing Down detection (Scheffer et al., Nature 2009). Before a regime change, three things rise together: variance, autocorrelation, and vol-of-vol. Sum z-scores; when sum > 2, the system is at a phase-transition boundary, and the indicator dampens sizing toward 1×. Real statistical physics.
3. Multi-timeframe coupling. The score combines vol percent-rank across D, W, M timeframes. Coherence or hesitation — the indicator decides.
4. Theta extremal-index (Beirlant 2004 EVT). Counts clusters of extreme returns, not individual events. θ→1 = independent (coherent). θ→0 = clustered (stressed). Amplification θ^ν with ν=3 validated in parameter sweep.
5. 2×2 regime overlay (trend × vol). bull-quiet, bull-noisy, bear-quiet, bear-noisy — each multiplies sizing. Bull-quiet accumulates. Bear-noisy survives.
6. Gold anchor. XAU / XAUT / GOLD get +15% conviction to activate.

7. The cloud IS the math. Cloud between price and SMA200 has direction (color) and density (alpha). High conviction = dense. Low = ghost. User-editable colors (default coral #F4A261 + lilac #E5DCEF).
Honest backtest data
Single-asset BTC walk-forward, 8.5 years (3,107 daily bars):
[code]Strategy Sharpe Per-$ Max DD
Buy & Hold (lump) 0.33 15.76× -76.6%
Naive DCA 1.08 4.300× -74.4%
v7 vol-adjusted 1.02 4.305× -74.6%[/code]
Per-dollar edge over naive DCA: +0.13% — statistically zero. The backtest tells the truth. This is NOT an alpha engine on a single asset.
What it DOES deliver (single-asset):
Where the multi-asset V6c production strategy DOES show edge
22-asset rotation, purged combinatorial cross-validation (CPCV 15/15) + Deflated Sharpe Ratio correction (Bailey & López de Prado 2014) for K=130 research runs:
[code]OOS Sharpe: 1.964
DSR_ann: +0.524
Bootstrap CI lo: +0.806
COVID 2020 stress: -0.894 (clears -1.0 floor)
2026 H1 OOS: +0.81
μ / σ annual: 24.01% / 12.24%[/code]

Stress windows the system still fails (transparent)
The system tells the truth about its limits. You operate knowing them.
How to read in 3 steps
For whom
Solo operator running weekly/monthly DCA on a handful of assets. Bilingual ES/EN. Wants discipline over magic. Reads statistical physics + ergodicity economics (Peters 2019 Nature Physics) without panic.
NOT for whom
Looking for directional buy/sell signals (this isn't a signal generator). Want discretionary alpha without work (the verb augments judgment, doesn't replace). Intraday trader (this is daily horizon).
Frequently Asked
Is this a trading signal indicator? No. Regime + sizing only. It tells you what regime an asset is in and what fraction of your DCA to deploy.
Does it work on stocks, crypto, forex, metals, indices? Yes — by design. Asset-relative percentile makes regime classification scale-free. Validated on BTC, ETH, XAUT, NAS100, UK100, GER40, FRA40, gold, silver, platinum, copper, equities.
What's the best timeframe? Daily. Weekly works for slower operators. Sub-daily out of scope.
Does it predict price direction? No. Regime classification only.
How was it validated? Walk-forward backtest with purged combinatorial cross-validation, 130 research runs, Deflated Sharpe Ratio correction, three stress-window evaluations.
How is it different from typical vol regime indicators? Most use ATR z-score or percentile. This adds Critical Slowing Down detection (Scheffer 2009 statistical physics) + extremal-index theta + multi-timeframe coupling + 5 verbs with size bands. Classifies + orients.
Methodology references
Disclaimer
Educational content. NOT financial advice. Past performance does not guarantee future results. The operator is responsible for decisions, sizing, and risk. The indicator gives multipliers — you decide the amount. Test on demo first.
Author
N — psychologist + HR Transformation specialist. Personal V6c system 2025-2026, walk-forward validated 130 runs with deflated Sharpe correction. Pine v6 native. Bilingual ES/EN.
Following González over Kundera: the scar is carried legibly.
verb · size · regime — three words a week
A volatility-regime indicator for swing and position traders that converts each asset's own 252-day vol distribution into a verb (BUY+/BUY/REDUCE/WAIT/OBSERVE) and a sizing % (25-200%) — so DCA execution becomes a 5-second decision, not an open question.
The 5-second HUD
Every Monday morning you open the chart. You see three words:
[code]Verb buy
Size 125%
Regime NORMAL[/code]
Verb = the action. Do it.
Size % = what fraction of your base DCA this week.
Regime = why the verb says what it says.
Everything else is diagnostic, off by default.
Five verbs. Five size bands. No dissonance.
- BUY+ (125-200%): low vol or post-crash exit
- BUY (75-125%): normal vol
- REDUCE (50-100%): elevated vol
- WAIT (25-50%): extreme vol or Critical Slowing detected
- OBSERVE (0%): insufficient data
Why WAIT and never SKIP — Taleb's rule: in markets with asymmetric upside, never go to zero. Size down, don't size zero.
What makes it different
1. Asset-relative percentile, not fixed thresholds. BTC, NASDAQ, gold, copper — completely different vol distributions. A "vol > 2.0" threshold works on one asset and fails on another. Vol Regime Compass uses percentile rank against the asset's own 252-day vol history. Scale-free, transferable across assets without re-tuning.
2. Critical Slowing Down detection (Scheffer et al., Nature 2009). Before a regime change, three things rise together: variance, autocorrelation, and vol-of-vol. Sum z-scores; when sum > 2, the system is at a phase-transition boundary, and the indicator dampens sizing toward 1×. Real statistical physics.
3. Multi-timeframe coupling. The score combines vol percent-rank across D, W, M timeframes. Coherence or hesitation — the indicator decides.
4. Theta extremal-index (Beirlant 2004 EVT). Counts clusters of extreme returns, not individual events. θ→1 = independent (coherent). θ→0 = clustered (stressed). Amplification θ^ν with ν=3 validated in parameter sweep.
5. 2×2 regime overlay (trend × vol). bull-quiet, bull-noisy, bear-quiet, bear-noisy — each multiplies sizing. Bull-quiet accumulates. Bear-noisy survives.
6. Gold anchor. XAU / XAUT / GOLD get +15% conviction to activate.
7. The cloud IS the math. Cloud between price and SMA200 has direction (color) and density (alpha). High conviction = dense. Low = ghost. User-editable colors (default coral #F4A261 + lilac #E5DCEF).
Honest backtest data
Single-asset BTC walk-forward, 8.5 years (3,107 daily bars):
[code]Strategy Sharpe Per-$ Max DD
Buy & Hold (lump) 0.33 15.76× -76.6%
Naive DCA 1.08 4.300× -74.4%
v7 vol-adjusted 1.02 4.305× -74.6%[/code]
Per-dollar edge over naive DCA: +0.13% — statistically zero. The backtest tells the truth. This is NOT an alpha engine on a single asset.
What it DOES deliver (single-asset):
- Behavioral discipline — the verb removes weekly indecision
- Capital efficiency on a fixed budget — distributes XX/WEEK toward low-vol weeks
- Regime awareness — you know when not to discretionarily increase
Where the multi-asset V6c production strategy DOES show edge
22-asset rotation, purged combinatorial cross-validation (CPCV 15/15) + Deflated Sharpe Ratio correction (Bailey & López de Prado 2014) for K=130 research runs:
[code]OOS Sharpe: 1.964
DSR_ann: +0.524
Bootstrap CI lo: +0.806
COVID 2020 stress: -0.894 (clears -1.0 floor)
2026 H1 OOS: +0.81
μ / σ annual: 24.01% / 12.24%[/code]
Stress windows the system still fails (transparent)
- COVID 2020: Sharpe -0.894 (clears -1.0 by 0.11, single observation, brittle)
- Crypto Winter 2022: Sharpe +0.09 (extended crypto bear flips negative)
- Gold-reversal: a 20%+ XAUT drawdown in live OOS turns the 85% neutral floor into a concentration killer
The system tells the truth about its limits. You operate knowing them.
How to read in 3 steps
- Verb first. Do what it says.
- Size second. Multiply your base DCA by the %.
- Everything else is diagnostic — open the drawer only if you want to understand WHY.
For whom
Solo operator running weekly/monthly DCA on a handful of assets. Bilingual ES/EN. Wants discipline over magic. Reads statistical physics + ergodicity economics (Peters 2019 Nature Physics) without panic.
NOT for whom
Looking for directional buy/sell signals (this isn't a signal generator). Want discretionary alpha without work (the verb augments judgment, doesn't replace). Intraday trader (this is daily horizon).
Frequently Asked
Is this a trading signal indicator? No. Regime + sizing only. It tells you what regime an asset is in and what fraction of your DCA to deploy.
Does it work on stocks, crypto, forex, metals, indices? Yes — by design. Asset-relative percentile makes regime classification scale-free. Validated on BTC, ETH, XAUT, NAS100, UK100, GER40, FRA40, gold, silver, platinum, copper, equities.
What's the best timeframe? Daily. Weekly works for slower operators. Sub-daily out of scope.
Does it predict price direction? No. Regime classification only.
How was it validated? Walk-forward backtest with purged combinatorial cross-validation, 130 research runs, Deflated Sharpe Ratio correction, three stress-window evaluations.
How is it different from typical vol regime indicators? Most use ATR z-score or percentile. This adds Critical Slowing Down detection (Scheffer 2009 statistical physics) + extremal-index theta + multi-timeframe coupling + 5 verbs with size bands. Classifies + orients.
Methodology references
- Critical Slowing Down: Scheffer M. et al. Nature 461, 53-59 (2009)
- Ergodicity: Peters O. Nature Physics 15, 1216-1221 (2019)
- Extremal index: Beirlant J. et al. Statistics of Extremes, Wiley (2004)
- Asymmetric upside: Taleb N.N. Antifragile (2012)
- Walk-forward + DSR: Bailey D., López de Prado M. JPM 40(5) 2014
- Purged combinatorial cross-validation: López de Prado, Advances in Financial ML (2018)
- Covariance shrinkage: Ledoit O., Wolf M. JMA 88(2) 2004
Disclaimer
Educational content. NOT financial advice. Past performance does not guarantee future results. The operator is responsible for decisions, sizing, and risk. The indicator gives multipliers — you decide the amount. Test on demo first.
Author
N — psychologist + HR Transformation specialist. Personal V6c system 2025-2026, walk-forward validated 130 runs with deflated Sharpe correction. Pine v6 native. Bilingual ES/EN.
Following González over Kundera: the scar is carried legibly.
Release Note
v11 fixes the realtime-bar repaint on the multi-timeframe regime reading. The D/W/M security calls now lock to the closed bar via [1] offset + lookahead_on (PineCoders canonical idiom). The 252-bar percentile windows switched from linear interpolation to nearest-rank, which is the recommended algorithm above ~100 lookback per Pine v6 profiling guidance.New input: Idioma / Language (es | en). Deck labels and verb display toggle. ES default preserves prior behavior. EN now reads "regime / verb / kitchen" instead of the Spanish set.
Open source. Educational. NFA.
สคริปต์แบบโอเพนซอร์ส
ด้วยเจตนารมณ์หลักของ TradingView ผู้สร้างสคริปต์นี้ได้ทำให้เป็นโอเพนซอร์ส เพื่อให้เทรดเดอร์สามารถตรวจสอบและยืนยันฟังก์ชันการทำงานของมันได้ ขอชื่นชมผู้เขียน! แม้ว่าคุณจะใช้งานได้ฟรี แต่โปรดจำไว้ว่าการเผยแพร่โค้ดซ้ำจะต้องเป็นไปตาม กฎระเบียบการใช้งาน ของเรา

คำจำกัดสิทธิ์ความรับผิดชอบ
ข้อมูลและบทความไม่ได้มีวัตถุประสงค์เพื่อก่อให้เกิดกิจกรรมทางการเงิน, การลงทุน, การซื้อขาย, ข้อเสนอแนะ หรือคำแนะนำประเภทอื่น ๆ ที่ให้หรือรับรองโดย TradingView อ่านเพิ่มเติมใน ข้อกำหนดการใช้งาน
สคริปต์แบบโอเพนซอร์ส
ด้วยเจตนารมณ์หลักของ TradingView ผู้สร้างสคริปต์นี้ได้ทำให้เป็นโอเพนซอร์ส เพื่อให้เทรดเดอร์สามารถตรวจสอบและยืนยันฟังก์ชันการทำงานของมันได้ ขอชื่นชมผู้เขียน! แม้ว่าคุณจะใช้งานได้ฟรี แต่โปรดจำไว้ว่าการเผยแพร่โค้ดซ้ำจะต้องเป็นไปตาม กฎระเบียบการใช้งาน ของเรา
คำจำกัดสิทธิ์ความรับผิดชอบ
ข้อมูลและบทความไม่ได้มีวัตถุประสงค์เพื่อก่อให้เกิดกิจกรรมทางการเงิน, การลงทุน, การซื้อขาย, ข้อเสนอแนะ หรือคำแนะนำประเภทอื่น ๆ ที่ให้หรือรับรองโดย TradingView อ่านเพิ่มเติมใน ข้อกำหนดการใช้งาน