Kill Zone Range Forecast [PhenLabs]
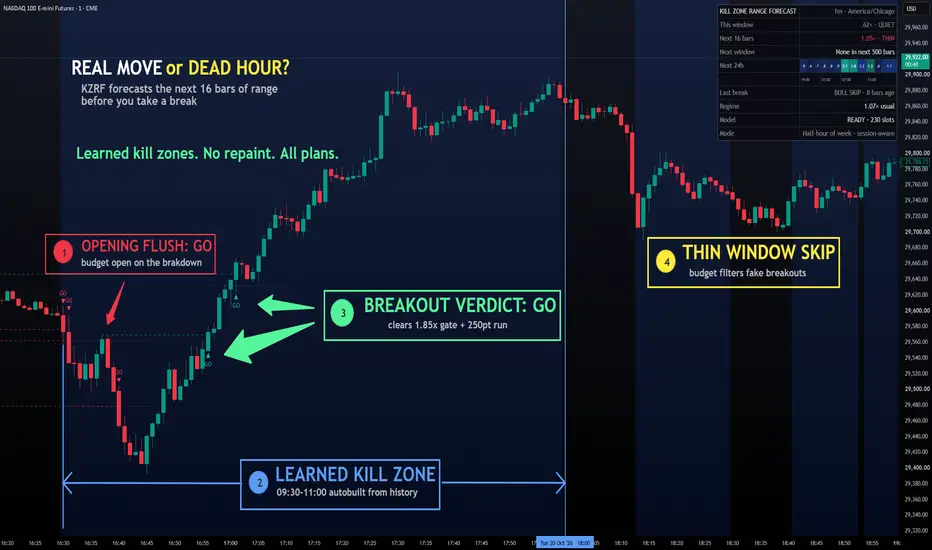
📊 Kill Zone Range Forecast [PhenLabs]
Version: PineScript™ v6
📌 Description
Most break-of-structure tools treat every break the same, whether it prints into the New York open or into a dead Sunday hour. Kill Zone Range Forecast learns when this specific chart actually moves. It builds a half-hour-of-week activity profile from the chart’s own history, then forecasts how much range the next few hours are likely to deliver before you take the trade.
A break of structure prints GO only when the forecast range budget for the next N bars clears your gate. Breaks into thin, low-activity windows are skipped, and the dashboard tells you when the next active window opens. The question it answers is simple: is now a good time to trade this break, or should you wait?
It does not predict direction. It forecasts how much the market is likely to move in the time you have. All logic runs on closed bars, with no request calls, so every plan gets the full tool.
🚀 Points of Innovation
🔧 Core Components
🔥 Key Features
🎨 Visualization
📖 Usage Guidelines
Structure
Forecast
Visuals
Dashboard
✅ Best Use Cases
⚠️ Limitations
💡 What Makes This Unique
⚙️ Under the Hood
🔬 How It Works
Version: PineScript™ v6
📌 Description
Most break-of-structure tools treat every break the same, whether it prints into the New York open or into a dead Sunday hour. Kill Zone Range Forecast learns when this specific chart actually moves. It builds a half-hour-of-week activity profile from the chart’s own history, then forecasts how much range the next few hours are likely to deliver before you take the trade.
A break of structure prints GO only when the forecast range budget for the next N bars clears your gate. Breaks into thin, low-activity windows are skipped, and the dashboard tells you when the next active window opens. The question it answers is simple: is now a good time to trade this break, or should you wait?
It does not predict direction. It forecasts how much the market is likely to move in the time you have. All logic runs on closed bars, with no request calls, so every plan gets the full tool.
🚀 Points of Innovation
- Learned kill zones: a 336-slot half-hour-of-week profile replaces fixed session boxes, so London, New York and Asia windows are discovered from the chart rather than assumed
- Forward range budget: the next N bars are projected with session-aware future timestamps and priced by the profile, giving a range forecast shaped by time of day
- Regime scaling: the seasonal shape is multiplied by how active the market has been recently versus what the profile expected
- Break-of-structure gate: a break becomes GO only when the forecast budget is at least your gate times a typical horizon
- Next-window projection: a single box drawn in the empty future area shows when the next learned active window starts and ends
🔧 Core Components
- Activity profile: each half-hour slot of the week stores an exponentially weighted average of bar range divided by a slow range level, so the profile is scale-free and keeps adapting
- Regime factor: the realized range of the last 20 bars divided by the range the profile expected for those bars, clamped between 0.5 and 2
- Range budget: the sum of the profile across the next N future bars, times the regime, divided by a typical N-bar horizon
- Structure engine: confirmed swing highs and lows are stored, and a closed bar beyond the most recent unbroken swing is a break; every swing the close passes through is consumed
- Window scanner: on the last bar it walks up to one day (500 bars max) ahead to find the current or next run of slots above the Active threshold
🔥 Key Features
- GO / SKIP decision on every break of structure, with bull and bear alerts
- Optional skipped-break markers so you can see what the filter removed
- Dashed broken-level line and a short dotted ray to the nearest unbroken opposing swing (the liquidity draw)
- Soft background shading on learned active windows
- Model readiness readout (LEARNING % / READY), so early-history signals are never presented as trained
- Pine Screener columns for the signal, the range budget, the current window ratio and the regime
🎨 Visualization
- Shaded bands: half-hour windows whose learned range is at least the Active threshold times the average slot
- GO triangles: small markers below or above the break bar, kept clear of the candles
- Next active window box: a translucent box in the future area with the window’s time range and expected activity multiple
- Next 24h heat strip: 12 cells of 2 hours each, colored by expected activity and labeled with the ratio (1.0 = typical) and a time axis in the exchange time zone. Teal cells are at or above the Active threshold; a dot means the market is closed or that slot is not learned yet. On 4h and higher it switches to the next 12 bars.
- Dashboard rows: This window, Next N bars budget (OPEN / THIN), Next window, Next 24h strip, Last break, Regime, Model, Mode
📖 Usage Guidelines
Structure
- Swing Length — Default: 5 — Range: 2-20 — Bars on each side that confirm a swing. Higher values give fewer, more significant breaks.
Forecast
- Forecast Horizon (bars) — Default: 16 — Range: 4-100 — How far ahead the range budget looks. Match it to your holding time: 16 bars on 15m is 4 hours, 8 bars on 1h is 8 hours.
- GO Gate (× typical) — Default: 1.0 — Range: 0.5-2.5 — Minimum forecast budget for a GO. 1.0 means at least an average horizon; raise it to trade only the most active windows.
- Learning Speed — Default: Normal — Options: Slow, Normal, Fast — How quickly each slot forgets older weeks.
- Active Window Threshold — Default: 1.3 — Range: 1.05-3.0 — How much busier than average a slot must be to count as an active window.
Visuals
- Shade Learned Active Windows — Default: On — Background shading for active slots; Zone Color appears when enabled.
- Project Next Active Window — Default: On — The single future box.
- Show Break Level + Liquidity Draw — Default: On — Lines for GO signals only, capped at 5 each.
- Show Skipped Breaks — Default: Off — Gray crosses for breaks the gate rejected.
- Bull / Bear Color — Default: teal / rose.
Dashboard
- Show Dashboard — Default: On.
- Table Size — Default: Normal — Options: Small, Normal, Large.
✅ Best Use Cases
- Intraday crypto, forex, index futures and gold on 5m to 1h, where activity has a strong time-of-day shape
- Filtering break-of-structure entries that would otherwise sit through a dead session
- Planning when to be at the screen: the next window and the 24h heat strip show when activity is expected to arrive
- Choosing a timeframe and horizon: if the budget is always THIN, the horizon is too short for your target
- Screening many symbols for those entering an active window now
⚠️ Limitations
- It forecasts range, not direction. GO means the market is expected to move enough, not that the break will follow through. Offline, break outcomes averaged about −0.05R with or without the gate.
- The profile needs history: the dashboard shows LEARNING until 300 confirmed bars and 80% of seen slots have at least 3 observations.
- Daylight-saving shifts and holidays move real activity by an hour or a day; the profile re-learns over the following weeks.
- Weekly and monthly charts, and non-time-based charts (Renko, Range, Kagi, Line Break, P&F, tick), switch seasonality off and use the regime only. The Mode row says so.
- Daily charts reduce to a weekday profile, which is much weaker than the intraday one.
💡 What Makes This Unique
- Learned, not fixed, kill zones: windows come from the chart’s own measured range, so a quiet London open on a given symbol is not treated as a kill zone just because a clock says so
- Forward-looking: the budget prices the bars that have not printed yet, using their real expected timestamps, so a break 30 minutes before the US open scores differently from one 30 minutes after the close
- Measured, not asserted: on Binance.US BTC and ETH data (15m: Jul 29 – Oct 20 2026; 1h: Nov 21 2025 – Oct 20 2026), the forecast explained more of the next-horizon range than a recent-average baseline (correlation² 0.66 vs 0.54 BTC 15m; 0.61 vs 0.54 ETH 15m; 0.64 vs 0.40 BTC 1h; 0.62 vs 0.41 ETH 1h) and cut log error by 13–24%
- Honest gate: GO breaks reached the nearest opposing swing within the horizon about 50% of the time vs about 43% for skipped breaks across the four datasets (1,780 breaks). This is about timing, not edge.
⚙️ Under the Hood
- time() with negative bars_back: time(timeframe.period, bars_back = -j) returns the expected opening timestamp of the bar j bars ahead and respects the symbol’s session. That lets the script price future bars by their real slot of the week, which a fixed bar-count offset cannot do across weekends and session gaps.
- 336-slot array profile: two var arrays (float profile, int count) indexed by half-hour of week in the exchange time zone, updated only on confirmed bars. Unlearned slots fall back to the mean profile.
- Scale-free EWMA: ranges are divided by a slow range level (about one week of bars, clamped 200–5000) before entering the profile, so the shape survives volatility regime changes and the regime factor rescales it.
- math.sum regime: running sums of realized vs expected range over 20 bars, called on every bar in global scope.
- Session-aware projection: the next-window box uses xloc.bar_time so it can sit in the empty future area beyond the last bar.
- Data mode / plan note: no plan-gated features and no request.*() calls, so every plan gets the full tool. The Mode row shows Half-hour of week, Weekday profile (Daily), or Seasonality OFF.
- Screener & alerts: the first plots are Signal (+1 Bull GO / −1 Bear GO), Next-H Range Budget, Current Window and Activity Regime, all exposed to the Data Window and Pine Screener. Alerts: KZRF Bull GO, KZRF Bear GO, KZRF Active Window Opens.
🔬 How It Works
- Every closed bar updates its half-hour slot with range divided by the slow level, so the profile only ever uses completed bars and never repaints.
- The script compares the last 20 bars’ realized range with what the profile expected, giving the regime factor.
- It projects the next N bars with session-aware timestamps, sums their slot values, multiplies by the regime and divides by a typical horizon to get the range budget.
- A close beyond the most recent unbroken swing is a break of structure. If the model is READY and the budget is at least the gate, it prints GO and fires the alert; otherwise it is a SKIP. A bar that breaks both sides gives no signal.
- On the last bar the scanner finds the current or next active window, draws the future box and fills the next-24h heat strip in the dashboard.
💡 Note:
Start with the defaults on a liquid intraday chart and let the Model row reach READY before reading signals. Match Forecast Horizon to how long you actually hold a trade, then use the gate as a timing filter on top of your own entry and risk rules. Kill Zone Range Forecast is an analytical aid for timing and context, not a signal service and not financial advice.

TradingView Charting w/ Crypto Systems: phenlabs.com
Join our growing community: discord.gg/phen
All content provided by PhenLabs is for informational & educational purposes only. Past performance does not guarantee future results.
Join our growing community: discord.gg/phen
All content provided by PhenLabs is for informational & educational purposes only. Past performance does not guarantee future results.
คำจำกัดสิทธิ์ความรับผิดชอบ
ข้อมูลและบทความไม่ได้มีวัตถุประสงค์เพื่อก่อให้เกิดกิจกรรมทางการเงิน, การลงทุน, การซื้อขาย, ข้อเสนอแนะ หรือคำแนะนำประเภทอื่น ๆ ที่ให้หรือรับรองโดย TradingView อ่านเพิ่มเติมใน ข้อกำหนดการใช้งาน
TradingView Charting w/ Crypto Systems: phenlabs.com
Join our growing community: discord.gg/phen
All content provided by PhenLabs is for informational & educational purposes only. Past performance does not guarantee future results.
Join our growing community: discord.gg/phen
All content provided by PhenLabs is for informational & educational purposes only. Past performance does not guarantee future results.
คำจำกัดสิทธิ์ความรับผิดชอบ
ข้อมูลและบทความไม่ได้มีวัตถุประสงค์เพื่อก่อให้เกิดกิจกรรมทางการเงิน, การลงทุน, การซื้อขาย, ข้อเสนอแนะ หรือคำแนะนำประเภทอื่น ๆ ที่ให้หรือรับรองโดย TradingView อ่านเพิ่มเติมใน ข้อกำหนดการใช้งาน