OPEN-SOURCE SCRIPT
ที่อัปเดต: Adaptive MA Fibonacci Zones MTF
# Adaptive MA Fibonacci Zones MTF
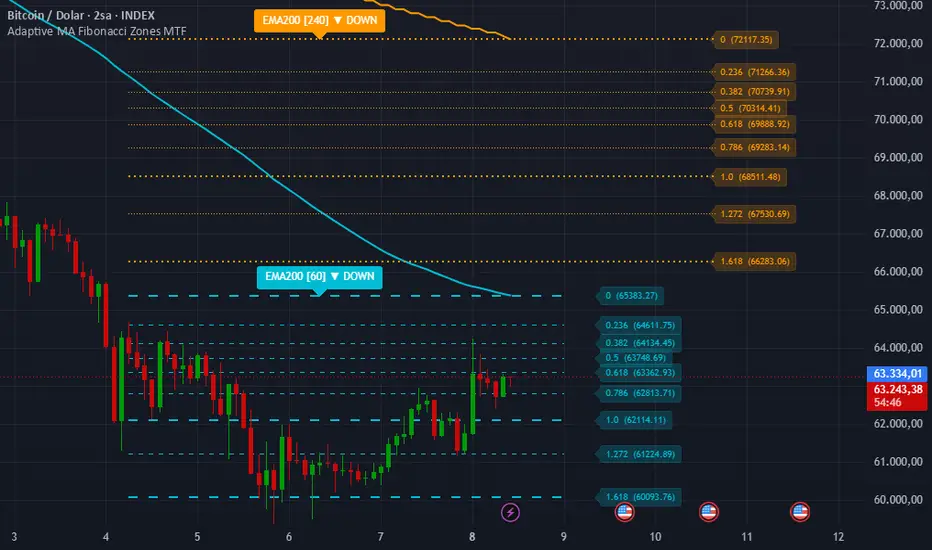
Adaptive MA Fibonacci Zones MTF is a multi-timeframe technical analysis tool that projects Fibonacci-based price levels around a selected moving average.
The indicator allows traders to choose from multiple moving average types, including EMA, SMA, WMA, SMMA, DEMA, TEMA, HMA, VWMA, ALMA, and KAMA. Two independent higher timeframes can be analyzed simultaneously, making it easier to compare trend structure and potential reaction zones across different market perspectives.
### Features
• Supports multiple moving average calculation methods
• Displays two configurable higher timeframes on a single chart
• Automatically generates Fibonacci-based projection levels around each moving average
• Dynamic bullish and bearish level calculation depending on price position relative to the selected moving average
• Optional Fibonacci level labels
• Visual trend direction labels for each timeframe
• Useful for identifying potential support, resistance, pullback, and expansion areas
### How It Works
The script calculates a selected moving average on two user-defined timeframes. A customizable percentage range is then applied around each moving average, and Fibonacci ratios are projected within that range. When price is above the moving average, levels are projected upward. When price is below the moving average, levels are projected downward.
### Notes
This indicator is designed as a visual analysis tool and should not be considered financial advice. Fibonacci levels and moving averages are analytical references that may be used alongside other forms of technical analysis and risk management techniques.
Adaptive MA Fibonacci Zones MTF is a multi-timeframe technical analysis tool that projects Fibonacci-based price levels around a selected moving average.
The indicator allows traders to choose from multiple moving average types, including EMA, SMA, WMA, SMMA, DEMA, TEMA, HMA, VWMA, ALMA, and KAMA. Two independent higher timeframes can be analyzed simultaneously, making it easier to compare trend structure and potential reaction zones across different market perspectives.
### Features
• Supports multiple moving average calculation methods
• Displays two configurable higher timeframes on a single chart
• Automatically generates Fibonacci-based projection levels around each moving average
• Dynamic bullish and bearish level calculation depending on price position relative to the selected moving average
• Optional Fibonacci level labels
• Visual trend direction labels for each timeframe
• Useful for identifying potential support, resistance, pullback, and expansion areas
### How It Works
The script calculates a selected moving average on two user-defined timeframes. A customizable percentage range is then applied around each moving average, and Fibonacci ratios are projected within that range. When price is above the moving average, levels are projected upward. When price is below the moving average, levels are projected downward.
### Notes
This indicator is designed as a visual analysis tool and should not be considered financial advice. Fibonacci levels and moving averages are analytical references that may be used alongside other forms of technical analysis and risk management techniques.
Release Note
### How It Works — Technical DetailsThis indicator calculates a selected moving average on two independent
user-defined timeframes using Pine Script's request.security() function
with lookahead disabled to prevent repainting.
The moving average is computed via a unified get_ma() function that
supports ten different calculation methods:
— EMA: Exponential Moving Average using ta.ema()
— SMA: Simple Moving Average using ta.sma()
— WMA: Weighted Moving Average using ta.wma()
— SMMA: Smoothed Moving Average using ta.rma()
— DEMA: Double EMA calculated as 2×EMA − EMA(EMA)
— TEMA: Triple EMA calculated as 3×EMA1 − 3×EMA2 + EMA3
— HMA: Hull Moving Average using ta.wma(2×wma(n/2) − wma(n), √n)
— VWMA: Volume Weighted Moving Average using ta.vwma()
— ALMA: Arnaud Legoux Moving Average using ta.alma() with offset 0.85
and sigma 6
— KAMA: Kaufman Adaptive Moving Average computed via an Efficiency
Ratio (ER) that measures directional movement against total
volatility over the period, producing a smoothing constant (SC)
that adapts the MA speed to market conditions
Once the moving average value is established for each timeframe, a
Fibonacci range is constructed using a user-defined percentage of the
MA value itself. Nine standard Fibonacci ratios are applied within
this range: 0, 0.236, 0.382, 0.5, 0.618, 0.786, 1.0, 1.272, and 1.618.
The direction of projection is determined by comparing the current
closing price to the moving average on each timeframe independently:
— If close ≥ MA: levels are projected upward from the MA (bullish bias)
— If close < MA: levels are projected downward from the MA (bearish bias)
This means the Fibonacci zone always expands away from the MA in the
direction of the prevailing trend on that timeframe, making the 0 level
always the MA itself and higher ratios representing potential extension
or pullback targets depending on market direction.
### How To Use
1. Select your two timeframes — recommended approach is one intermediate
and one higher timeframe (e.g. 1H + 4H, or 4H + 1D)
2. Choose the MA type that suits your strategy:
— Trend following: EMA or KAMA (adapts to volatility)
— Smooth structure: HMA or TEMA (reduced lag)
— Volume-weighted: VWMA (incorporates volume context)
3. Set MA Period — 200 is a widely used structural reference,
50 or 100 suit shorter-term analysis
4. Fibonacci Range (%): controls how wide the projected zone is
— Crypto: 3–8% suits volatile price swings
— Forex: 0.5–2% recommended
— Equities: 1–4% recommended
5. When price is above the MA, use upper Fibonacci levels
(0.618, 1.0, 1.272, 1.618) as potential resistance or
extension targets
6. When price is below the MA, the same levels act as
potential support or downside targets
7. Look for confluence where TF1 and TF2 Fibonacci levels
overlap — these areas carry greater analytical significance
### Originality
This script is an original work combining multi-timeframe moving average
analysis with dynamically directional Fibonacci zone projection. The key
distinction from standard Fibonacci tools is that the range origin and
projection direction adapt automatically to the trend state on each
timeframe independently. The integration of ten MA types within a single
unified function, combined with percentage-based range scaling and
dual-timeframe simultaneous display, represents the author's own
สคริปต์แบบโอเพนซอร์ส
ด้วยเจตนารมณ์หลักของ TradingView ผู้สร้างสคริปต์นี้ได้ทำให้เป็นโอเพนซอร์ส เพื่อให้เทรดเดอร์สามารถตรวจสอบและยืนยันฟังก์ชันการทำงานของมันได้ ขอชื่นชมผู้เขียน! แม้ว่าคุณจะใช้งานได้ฟรี แต่โปรดจำไว้ว่าการเผยแพร่โค้ดซ้ำจะต้องเป็นไปตาม กฎระเบียบการใช้งาน ของเรา

คำจำกัดสิทธิ์ความรับผิดชอบ
ข้อมูลและบทความไม่ได้มีวัตถุประสงค์เพื่อก่อให้เกิดกิจกรรมทางการเงิน, การลงทุน, การซื้อขาย, ข้อเสนอแนะ หรือคำแนะนำประเภทอื่น ๆ ที่ให้หรือรับรองโดย TradingView อ่านเพิ่มเติมใน ข้อกำหนดการใช้งาน
สคริปต์แบบโอเพนซอร์ส
ด้วยเจตนารมณ์หลักของ TradingView ผู้สร้างสคริปต์นี้ได้ทำให้เป็นโอเพนซอร์ส เพื่อให้เทรดเดอร์สามารถตรวจสอบและยืนยันฟังก์ชันการทำงานของมันได้ ขอชื่นชมผู้เขียน! แม้ว่าคุณจะใช้งานได้ฟรี แต่โปรดจำไว้ว่าการเผยแพร่โค้ดซ้ำจะต้องเป็นไปตาม กฎระเบียบการใช้งาน ของเรา
คำจำกัดสิทธิ์ความรับผิดชอบ
ข้อมูลและบทความไม่ได้มีวัตถุประสงค์เพื่อก่อให้เกิดกิจกรรมทางการเงิน, การลงทุน, การซื้อขาย, ข้อเสนอแนะ หรือคำแนะนำประเภทอื่น ๆ ที่ให้หรือรับรองโดย TradingView อ่านเพิ่มเติมใน ข้อกำหนดการใช้งาน