Candle Volume Profile MTF + Close Predictor
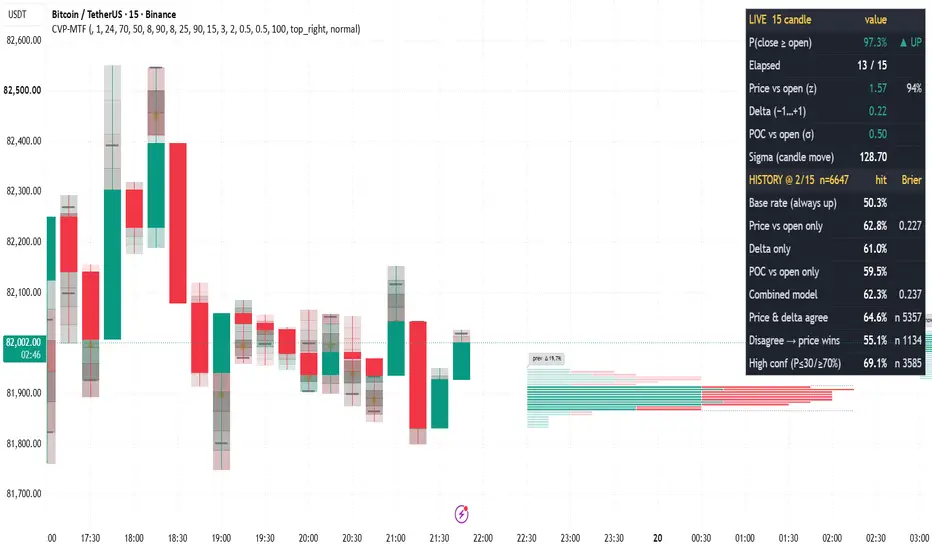
This indicator builds a full volume profile for every individual candle, using lower-timeframe data. It also estimates, live, the probability that the current candle will close at or above its open. It works on any symbol and any timeframe: a 5-minute candle profiled from 1-minute data, a 1-hour candle from 1-minute data, a daily candle from 15-minute data, and so on.
Standard volume profiles show where volume traded over a range of bars. This script answers a narrower question: inside a single candle, where did volume trade, who was in control (buyers or sellers), and is the candle likely to close as a buy or a sell candle?
HOW IT WORKS
1) Per-candle volume profile
- For each candle on the "Profile timeframe", the script requests the lower-timeframe candles inside it .
- The candle's high-low range is split into price rows.
- Each lower-timeframe candle's volume is spread across the rows its range covers, in proportion to the overlap.
- Volume is split into buy and sell parts by where each lower-timeframe candle closed within its own range. Close at the high = all buy, close at the low = all sell.
- From the rows it computes:
- POC - the price row with the most volume
- Value Area - the rows around the POC holding the chosen % of volume (default 70%), expanded toward the heavier neighbour, as in a classic volume profile
- Delta - buy volume minus sell volume, as a % of total
2) Display modes (picked automatically)
- Chart timeframe LOWER than the profile timeframe (e.g. 1m chart, 15m profile): a horizontal profile is drawn across the chart bars of each profile candle, with POC, VAH/VAL and a delta label. This is the clearest view. Use it to study the internal structure of higher-timeframe candles.
- Chart timeframe EQUAL to the profile timeframe: each candle gets a heatmap of its volume rows (darker = more volume, colour = buy/sell balance), plus a POC dot and VAH/VAL ticks. Full profiles of the live and previous candles are drawn to the right of the last bar.
- Pick a candle: enable it and drag the time marker onto any candle. Its full profile is drawn to the right of the last bar, labelled with its date and time.
3) Close predictor
While a candle is forming, three forces are measured from its lower-timeframe data:
- z (price vs open): (current price - candle open) / (sigma x sqrt(fraction of candle remaining)). sigma is the standard deviation of open-to-close moves over recent candles. This measures how hard it would be for price to cross back over the open in the time left.
- Delta (-1..+1): who has been pushing inside the candle so far.
- POC vs open (in sigma): whether the volume-accepted price sits above or below the open.
They combine into a probability:
P(close >= open) = Phi(z + wDelta x delta + wPOC x POCbias)
where Phi is the standard normal CDF. With both weights at 0 this is a pure random-walk estimate. The weights let you test whether order flow adds information beyond price.
4) Built-in calibration (history test)
At a fixed checkpoint (e.g. after 2 of the 5 lower-timeframe candles), every finished candle in the loaded history is scored. Only data available at that moment inside the candle is used, so there is no lookahead. The table reports:
- Base rate (how often candles close up)
- Hit rate of each force alone: price, delta, POC
- Hit rate and Brier score of the combined model (lower Brier = better-calibrated probabilities)
- When price and delta agree: hit rate
- When they disagree: how often price wins
- High-confidence calls (P <= 30% or >= 70%): hit rate and count
This lets you check, on your own symbol and timeframe, whether volume flow really helps before you rely on it.
HOW TO USE
1. Add the indicator. Set "Source timeframe" lower than the chart (1m for intraday charts; 15S/10S if your plan has seconds data; 15m or 1h for daily candles).
2. Leave "Profile timeframe" empty to profile every chart candle, or set a higher timeframe (e.g. 15m on a 1m chart) to see each higher-timeframe candle's profile drawn across its bars.
3. Read the profile:
- POC near the candle's high with positive delta: buyers accepted higher prices. A strong, healthy up candle.
- POC near the low with negative delta: sellers in control.
- Price far from the POC with delta against the move: thin, poorly accepted move. Watch for a fade.
- Large opposite-colour volume at a candle's extreme: absorption, a possible reversal level.
4. Close predictor:
- The live table shows P(close >= open), time elapsed in the candle, and the value of each force.
- Set the "Calibration checkpoint" to the point in the candle where you usually decide.
- Compare "combined" with "price vs open only" in the history table. Adjust the delta and POC weights, and keep a change only if the combined Brier score improves on price-only.
- The high-confidence row shows how reliable strong readings were in the past.
5. Alerts: "POC at candle low" and "POC at candle high" fire on candle close when the POC is in the bottom or top 25% of the candle's range.
SETTINGS
- Rows: price resolution of each profile. Note TradingView's limit of 500 boxes (rows x 2 x candles drawn).
- Value area %: default 70.
- Draw last N profile candles: how many higher-timeframe candles keep their drawn profile.
- Heatmap rows / transparency: in-candle view when chart TF = profile TF.
- Weights (delta, POC), sigma lookback, table position: predictor settings.
NOTES AND LIMITATIONS
- Buy/sell volume is estimated from lower-timeframe candle structure. It is not true bid/ask (tick) data. Finer source data (seconds) gives more accurate profiles and delta.
- Lower-timeframe history is limited by TradingView, so very old candles may have no profile.
- Few lower-timeframe candles per candle (e.g. 5 x 1m inside a 5m candle) gives a coarse profile. Use finer source data where possible.
- The probability is a statistical estimate, not a signal or a guarantee. Always check the calibration table on your own market and timeframe.
This script is for educational and analytical purposes only and is not financial advice.

คำจำกัดสิทธิ์ความรับผิดชอบ
ข้อมูลและบทความไม่ได้มีวัตถุประสงค์เพื่อก่อให้เกิดกิจกรรมทางการเงิน, การลงทุน, การซื้อขาย, ข้อเสนอแนะ หรือคำแนะนำประเภทอื่น ๆ ที่ให้หรือรับรองโดย TradingView อ่านเพิ่มเติมใน ข้อกำหนดการใช้งาน
คำจำกัดสิทธิ์ความรับผิดชอบ
ข้อมูลและบทความไม่ได้มีวัตถุประสงค์เพื่อก่อให้เกิดกิจกรรมทางการเงิน, การลงทุน, การซื้อขาย, ข้อเสนอแนะ หรือคำแนะนำประเภทอื่น ๆ ที่ให้หรือรับรองโดย TradingView อ่านเพิ่มเติมใน ข้อกำหนดการใช้งาน