Low-Pass Bands [ChartPrime]
More exclusive indicators from ChartPrime
Subscribe to ChartPrime Plus for $117.00/month to get exclusive indicators by this author. You pay right on TradingView and can use them on your charts straight away.
Explore ChartPrime Plus⯁ OVERVIEW
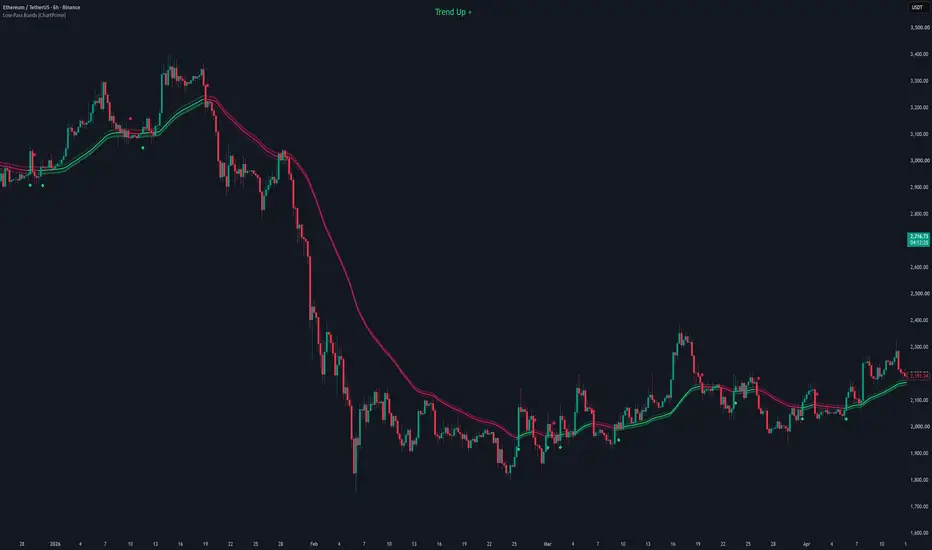
The Low-Pass Bands [ChartPrime] indicator employs a low-pass filter to smooth market noise and highlight trend direction. It consists of an upper band, a lower band, and a central line. The bands are calculated based on a user-defined percentage distance from the smoothed central line, derived using a low-pass filter. The indicator also features dynamic color-coding and bar coloring to help traders quickly identify potential trend shifts and momentum.
⯁ KEY FEATURES & HOW TO USE
⯌ Low-Pass Filtered Bands:
The indicator utilizes a low-pass filter to smooth the input source (e.g., hlc3) over a specified length. It then calculates upper and lower bands as a percentage distance from this smoothed value. The central line and the bands adapt to market movements, filtering out short-term noise and focusing on the overall trend.
Pine Script®
Use: Traders can use these bands to identify the general trend direction. The price oscillating between the bands indicates consolidation, while crossing the bands signifies potential trend shifts.

⯌ Trend Detection and Signals:
The indicator detects trend changes by identifying crossovers between the price and the upper or lower bands. When the price crosses above the upper band, it signals a potential upward trend. Conversely, crossing below the lower band signals a potential downward trend. Diamond markers are plotted on the chart to highlight these trend changes.
Use: Traders can use these crossover signals to identify entry and exit points, taking long positions on bullish crossovers and short positions on bearish crossovers.


⯌ Dynamic Color-Coding:
The bands and central line are dynamically color-coded based on the price’s relation to them. If the price is above the lower band, the color changes to indicate a positive trend, while being below changes it to a negative trend color. This color-coding extends to the candlesticks when the bar coloring option is enabled.
Use: The color-coding provides an immediate visual representation of the trend's current state, allowing traders to quickly assess market conditions.
⯌ Trend Information Display:
The indicator displays trend information in text format on the chart, indicating whether the current trend is "Trend Up" or "Trend Down." Additionally, the indicator denotes momentum by adding a "+" for strong trends. The color of the trend text changes to match the trend direction.
Use: This trend display offers a clear and concise summary of the market's direction and momentum, aiding traders in making informed trading decisions.
Trend Losing momentum:


Trends with Strong Momentum:


⯁ USER INPUTS
⯁ CONCLUSION
The Low-Pass Bands [ChartPrime] indicator provides a robust way to visualize market trends and potential shifts by filtering out short-term noise using a low-pass filter. Its dynamic bands, trend detection signals, and color-coded visual cues make it a versatile tool for identifying trend direction and momentum. The addition of trend information directly on the chart further enhances its utility, offering traders a clear and concise overview of the market's current state.
The Low-Pass Bands [ChartPrime] indicator employs a low-pass filter to smooth market noise and highlight trend direction. It consists of an upper band, a lower band, and a central line. The bands are calculated based on a user-defined percentage distance from the smoothed central line, derived using a low-pass filter. The indicator also features dynamic color-coding and bar coloring to help traders quickly identify potential trend shifts and momentum.
⯁ KEY FEATURES & HOW TO USE
⯌ Low-Pass Filtered Bands:
The indicator utilizes a low-pass filter to smooth the input source (e.g., hlc3) over a specified length. It then calculates upper and lower bands as a percentage distance from this smoothed value. The central line and the bands adapt to market movements, filtering out short-term noise and focusing on the overall trend.
Use: Traders can use these bands to identify the general trend direction. The price oscillating between the bands indicates consolidation, while crossing the bands signifies potential trend shifts.
⯌ Trend Detection and Signals:
The indicator detects trend changes by identifying crossovers between the price and the upper or lower bands. When the price crosses above the upper band, it signals a potential upward trend. Conversely, crossing below the lower band signals a potential downward trend. Diamond markers are plotted on the chart to highlight these trend changes.
Use: Traders can use these crossover signals to identify entry and exit points, taking long positions on bullish crossovers and short positions on bearish crossovers.
⯌ Dynamic Color-Coding:
The bands and central line are dynamically color-coded based on the price’s relation to them. If the price is above the lower band, the color changes to indicate a positive trend, while being below changes it to a negative trend color. This color-coding extends to the candlesticks when the bar coloring option is enabled.
Use: The color-coding provides an immediate visual representation of the trend's current state, allowing traders to quickly assess market conditions.
⯌ Trend Information Display:
The indicator displays trend information in text format on the chart, indicating whether the current trend is "Trend Up" or "Trend Down." Additionally, the indicator denotes momentum by adding a "+" for strong trends. The color of the trend text changes to match the trend direction.
Use: This trend display offers a clear and concise summary of the market's direction and momentum, aiding traders in making informed trading decisions.
Trend Losing momentum:
Trends with Strong Momentum:
⯁ USER INPUTS
- Length: Sets the length for the low-pass filter, determining the degree of smoothing.
- % Distance: Defines the percentage distance from the central line for the upper and lower bands.
- Source: Selects the data source for calculations (default: hlc3).
- Color + / -: Choose colors for positive and negative trends.
- Bars Color: Toggle for coloring bars according to the trend.
⯁ CONCLUSION
The Low-Pass Bands [ChartPrime] indicator provides a robust way to visualize market trends and potential shifts by filtering out short-term noise using a low-pass filter. Its dynamic bands, trend detection signals, and color-coded visual cues make it a versatile tool for identifying trend direction and momentum. The addition of trend information directly on the chart further enhances its utility, offering traders a clear and concise overview of the market's current state.

คำจำกัดสิทธิ์ความรับผิดชอบ
ข้อมูลและบทความไม่ได้มีวัตถุประสงค์เพื่อก่อให้เกิดกิจกรรมทางการเงิน, การลงทุน, การซื้อขาย, ข้อเสนอแนะ หรือคำแนะนำประเภทอื่น ๆ ที่ให้หรือรับรองโดย TradingView อ่านเพิ่มเติมใน ข้อกำหนดการใช้งาน
คำจำกัดสิทธิ์ความรับผิดชอบ
ข้อมูลและบทความไม่ได้มีวัตถุประสงค์เพื่อก่อให้เกิดกิจกรรมทางการเงิน, การลงทุน, การซื้อขาย, ข้อเสนอแนะ หรือคำแนะนำประเภทอื่น ๆ ที่ให้หรือรับรองโดย TradingView อ่านเพิ่มเติมใน ข้อกำหนดการใช้งาน