ที่อัปเดต:
[blackcat] L1 Dynamic Volatility Indicator
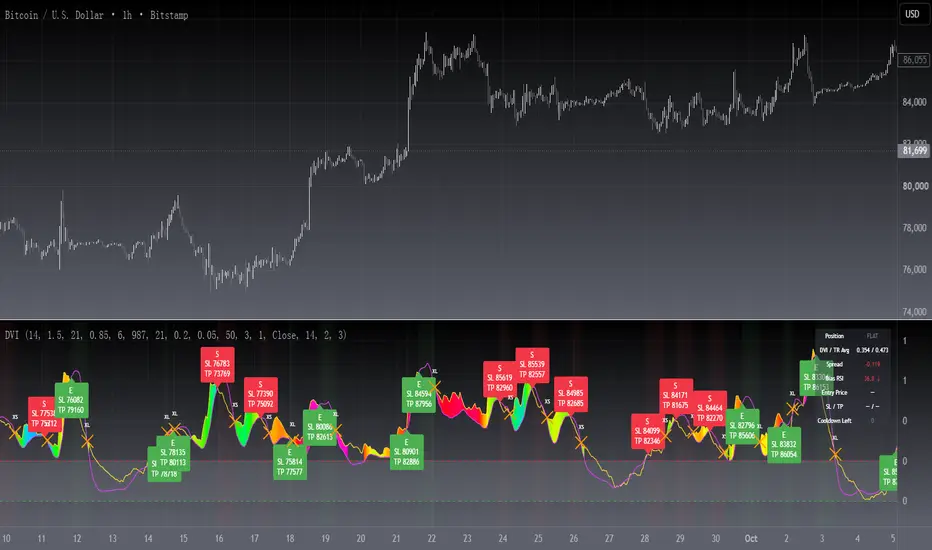
The volatility indicator (Volatility) is used to measure the magnitude and instability of price changes in financial markets or a specific asset. This thing is usually used to assess how risky the market is. The higher the volatility, the greater the fluctuation in asset prices, but brother, the risk is also relatively high! Here are some related terms and explanations:
- Historical Volatility: The actual volatility of asset prices over a certain period of time in the past. This thing is measured by calculating historical data.
- Implied Volatility: The volatility inferred from option market prices, used to measure market expectations for future price fluctuations.
- VIX Index (Volatility Index): Often referred to as the "fear index," it predicts the volatility of the US stock market within 30 days in advance. This is one of the most famous volatility indicators in global financial markets.
Volatility indicators are very important for investors and traders because they can help them understand how unstable and risky the market is, thereby making wiser investment decisions.
Today I want to introduce a volatility indicator that I have privately held for many years. It can use colors to judge sharp rises and falls! Of course, if you are smart enough, you can also predict some potential sharp rises and falls by looking at the trend!
In the financial field, volatility indicators measure the magnitude and instability of price changes in different assets. They are usually used to assess the level of market risk. The higher the volatility, the greater the fluctuation in asset prices and therefore higher risk. Historical Volatility refers to the actual volatility of asset prices over a certain period of time in the past, which can be measured by calculating historical data; while Implied Volatility is derived from option market prices and used to measure market expectations for future price fluctuations. In addition, VIX Index is commonly known as "fear index" and is used to predict volatility in the US stock market within 30 days. It is one of the most famous volatility indicators in global financial markets.
Volatility indicators are very important for investors and traders because they help them understand market uncertainty and risk, enabling them to make wiser investment decisions. The L1 Dynamic Volatility Indicator that I am introducing today is an indicator that measures volatility and can also judge sharp rises and falls through colors!
This indicator combines two technical indicators: Dynamic Volatility (DV) and ATR (Average True Range), displaying warnings about sharp rises or falls through color coding. DV has a slow but relatively smooth response, while ATR has a fast but more oscillating response. By utilizing their complementary characteristics, it is possible to construct a structure similar to MACD's fast-slow line structure. Of course, in order to achieve fast-slow lines for DV and ATR, first we need to unify their coordinate axes by normalizing them. Then whenever ATR's yellow line exceeds DV's purple line with both curves rapidly breaking through the threshold of 0.2, sharp rises or falls are imminent.
However, it is important to note that relying solely on the height and direction of these two lines is not enough to determine the direction of sharp rises or falls! Because they only judge the trend of volatility and cannot determine bull or bear markets! But it's okay, I have already considered this issue early on and added a magical gradient color band. When the color band gradually turns warm, it indicates a sharp rise; conversely, when the color band tends towards cool colors, it indicates a sharp fall! Of course, you won't see the color band in sideways consolidation areas, which avoids your involvement in unnecessary trades that would only waste your funds! This indicator is really practical and with it you can better assess market risks and opportunities!
- Historical Volatility: The actual volatility of asset prices over a certain period of time in the past. This thing is measured by calculating historical data.
- Implied Volatility: The volatility inferred from option market prices, used to measure market expectations for future price fluctuations.
- VIX Index (Volatility Index): Often referred to as the "fear index," it predicts the volatility of the US stock market within 30 days in advance. This is one of the most famous volatility indicators in global financial markets.
Volatility indicators are very important for investors and traders because they can help them understand how unstable and risky the market is, thereby making wiser investment decisions.
Today I want to introduce a volatility indicator that I have privately held for many years. It can use colors to judge sharp rises and falls! Of course, if you are smart enough, you can also predict some potential sharp rises and falls by looking at the trend!
In the financial field, volatility indicators measure the magnitude and instability of price changes in different assets. They are usually used to assess the level of market risk. The higher the volatility, the greater the fluctuation in asset prices and therefore higher risk. Historical Volatility refers to the actual volatility of asset prices over a certain period of time in the past, which can be measured by calculating historical data; while Implied Volatility is derived from option market prices and used to measure market expectations for future price fluctuations. In addition, VIX Index is commonly known as "fear index" and is used to predict volatility in the US stock market within 30 days. It is one of the most famous volatility indicators in global financial markets.
Volatility indicators are very important for investors and traders because they help them understand market uncertainty and risk, enabling them to make wiser investment decisions. The L1 Dynamic Volatility Indicator that I am introducing today is an indicator that measures volatility and can also judge sharp rises and falls through colors!
This indicator combines two technical indicators: Dynamic Volatility (DV) and ATR (Average True Range), displaying warnings about sharp rises or falls through color coding. DV has a slow but relatively smooth response, while ATR has a fast but more oscillating response. By utilizing their complementary characteristics, it is possible to construct a structure similar to MACD's fast-slow line structure. Of course, in order to achieve fast-slow lines for DV and ATR, first we need to unify their coordinate axes by normalizing them. Then whenever ATR's yellow line exceeds DV's purple line with both curves rapidly breaking through the threshold of 0.2, sharp rises or falls are imminent.
However, it is important to note that relying solely on the height and direction of these two lines is not enough to determine the direction of sharp rises or falls! Because they only judge the trend of volatility and cannot determine bull or bear markets! But it's okay, I have already considered this issue early on and added a magical gradient color band. When the color band gradually turns warm, it indicates a sharp rise; conversely, when the color band tends towards cool colors, it indicates a sharp fall! Of course, you won't see the color band in sideways consolidation areas, which avoids your involvement in unnecessary trades that would only waste your funds! This indicator is really practical and with it you can better assess market risks and opportunities!
Release Note
correct the color definiation a little bitRelease Note
OVERVIEWThe [blackcat] L1 Dynamic Volatility Indicator provides a visual representation of market volatility using a combination of True Range (TR) and Average True Range (ATR). This indicator normalizes these values to create a dynamic volatility index that adapts to changing market conditions. With customizable parameters and gradient coloring, it offers traders a clear view of volatility trends 📉💹.
FEATURES
Calculates True Range (TR) based on high, low, and closing prices.
Computes the Average True Range (ATR) over a specified period:
Length: Number of bars considered in ATR calculation.
Multiplier: Factor applied to scale the ATR value.
Normalizes TR and ATR values for better comparison across different assets and timeframes.
Plots two lines representing normalized true range average and DVI value with distinct colors:
Normalized True Range Average: Yellow line.
Dynamic Volatility Index (DVI): Fuchsia line.
Uses gradient coloring to visually represent changes in RSI-based volatility levels 🌈
Includes horizontal thresholds at key levels (0.2 and 0.0) for additional context.
HOW TO USE
Add the indicator to your TradingView chart by selecting it from the indicators list.
Adjust the length parameter to define how many bars are included in the calculations.
Set the desired multiplier to scale the ATR value according to your preferences ⚙️.
Monitor the plotted lines and gradient fill areas to observe volatility trends.
Use the thresholds as reference points for identifying periods of high or low volatility.
LIMITATIONS
The indicator may not capture all nuances of market volatility due to its reliance on historical data.
Users should combine this indicator with other forms of analysis for more reliable trading decisions.
The effectiveness of the indicator may vary depending on the asset and timeframe being analyzed.
NOTES
Ensure that you have sufficient historical data available for accurate calculations.
Test the indicator thoroughly on demo accounts before applying it to live trading 🔍.
Experiment with various settings to find optimal parameters for your specific needs.
Release Note
█ OVERVIEWDVI puts smoothed volatility and realized volatility on one 0-1 scale, then turns their crossings into long, short and exit signals with ATR-based stops and targets. It catches the moment volatility expands out of a squeeze, and closes the trade when that expansion collapses.
█ CONCEPTS
Two normalized curves live in the pane:
• DVI (fuchsia): an ALMA-smoothed true-range average, scaled to 0-1 over a long lookback. Smoothed and amplified by the Multiplier, it leads.
• True Range Average (yellow): an RMA of true range, scaled the same way. It lags, tracking delivered volatility.
Key principles:
• Expansion: DVI crossing above the True Range Average means smoothed volatility runs ahead of delivered volatility — the squeeze break.
• Direction: the ALMA of close, read through RSI, decides whether an expansion is long or short.
• Collapse: DVI back under the average, or under the exit level, ends the regime and the position.
█ HOW TO USE
1 — Add the indicator to any chart; it opens in its own pane, no overlay needed.
2 — Keep the defaults and tune only the two levels: Expansion Entry Level (0.2) rejects breakouts born in dead volatility, Volatility Collapse Exit Level (0.05) closes trades when the regime dies.
3 — Read the labels: E long entry, S short entry, XL / XS exit, RL / RS re-entry; entry labels print the ATR stop and target.
4 — Create alerts from the eight alertcondition channels, or use the built-in dynamic alerts, which already carry price, SL and TP.
Input Parameters
• Core: Length, Multiplier, ALMA Length / Offset / Sigma, Normalization Lookback, RSI Length.
• Signal Governance: Enable Long / Short Signals, Expansion Entry Level, Volatility Collapse Exit Level, Require ALMA-RSI Direction Bias, Bias Midpoint, Same-bar Entry/Exit Exclusivity, Cooldown Bars.
• Re-entry: Enable Re-entry, Anchor Window Around Exit Bar, Breakout Source.
• Risk: Compute ATR TP/SL Levels, ATR Length, Stop Loss (xATR), Take Profit (xATR).
• Visual: Show Signal Labels, Show Position Background, Show Dashboard.
█ FEATURES
• Bidirectional signals governed by a position state machine, same-bar exclusivity and a cooldown, so signals never fire twice or contradict each other.
• ATR-based stop and target for every trade, exposed in the data window and printed on the entry label.
• Optional re-entry: the extreme around the exit bar becomes an anchor; a close beyond it re-arms the trade.
• Gradient fill between the two curves (a 101-step ramp driven by ALMA-RSI) shows regime strength at a glance.
• Dashboard table: position, both curves, spread, bias, entry price, SL/TP, cooldown.
• Eight alertcondition channels plus close-confirmed dynamic alerts.
█ SIGNALS
Visual Elements
• E (green, below the curve): long entry on volatility expansion with bullish bias.
• S (red, above the curve): short entry on volatility expansion with bearish bias.
• XL / XS (orange cross): exit — DVI back under the average or below the exit level.
• RL / RS (teal / maroon): re-entry after a break of the exit anchor, off by default.
• Background tint: green while long, red while short.
█ IMPLEMENTATION NOTES
Open source under MPL 2.0. Built on ta.tr, ta.rma, ta.alma, ta.rsi, ta.lowest / ta.highest normalization, ta.atr for risk levels and ta.crossover / ta.crossunder for regime edges. Signals are confirmed at bar close and alerts use freq_once_per_bar_close, so nothing repaints. The normalizer guards a zero range; the color index is clamped to the palette.
█ LIMITATIONS
• The 987-bar normalization window needs long history; no signals fire until both curves are defined.
• Values are relative to each instrument's own volatility history, so 0.4 is not comparable across symbols.
• Volatility expansion is not a direction forecast; the bias filter helps, but range markets still produce false breaks.
• This is an indicator, not a strategy: no fills and no equity curve. Backtest before sizing anything.
█ NOTES
• V2 adds signals, risk levels, alerts and a dashboard on top of the original oscillator; every addition is switchable.
• Credit: original DVI idea by blackcat1402.
═════════════════════════════════════════════════════════════════════════
For questions or feedback, use comments section below.
Feel free to use and modify — attribution appreciated.

Don't miss out! The first and most important thing to do is to join my Discord chat now! Click here to start your adventure: discord.com/invite/ZTGpQJq My new github for more pine development soon: github.com/wxt-coder
คำจำกัดสิทธิ์ความรับผิดชอบ
ข้อมูลและบทความไม่ได้มีวัตถุประสงค์เพื่อก่อให้เกิดกิจกรรมทางการเงิน, การลงทุน, การซื้อขาย, ข้อเสนอแนะ หรือคำแนะนำประเภทอื่น ๆ ที่ให้หรือรับรองโดย TradingView อ่านเพิ่มเติมใน ข้อกำหนดการใช้งาน
Don't miss out! The first and most important thing to do is to join my Discord chat now! Click here to start your adventure: discord.com/invite/ZTGpQJq My new github for more pine development soon: github.com/wxt-coder
คำจำกัดสิทธิ์ความรับผิดชอบ
ข้อมูลและบทความไม่ได้มีวัตถุประสงค์เพื่อก่อให้เกิดกิจกรรมทางการเงิน, การลงทุน, การซื้อขาย, ข้อเสนอแนะ หรือคำแนะนำประเภทอื่น ๆ ที่ให้หรือรับรองโดย TradingView อ่านเพิ่มเติมใน ข้อกำหนดการใช้งาน