ที่อัปเดต:
Visible Range Support and Resistance [BigBeluga]
More exclusive indicators from BigBeluga
Subscribe to BigBeluga Premium for $66.47/month to get exclusive indicators by this author. You pay right on TradingView and can use them on your charts straight away.
Explore BigBeluga Premium🔵 OVERVIEW
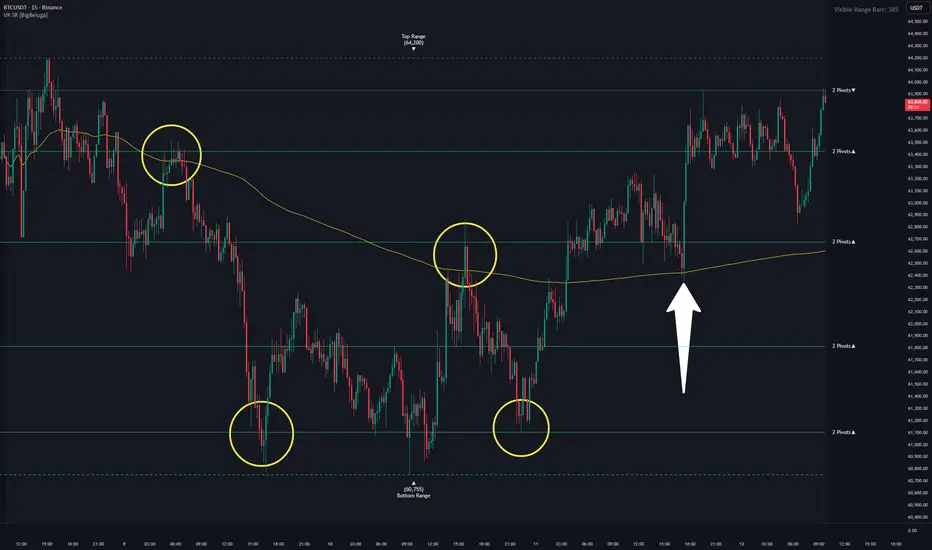
Visible Range Support and Resistance [BigBeluga] is a dynamic support/resistance tool that analyzes price structure only within the visible range of your chart. It detects key levels based on clustered pivots inside a binned vertical range and highlights zones where price has historically reacted. The tool adjusts in real-time as you pan or zoom, offering adaptive precision at any scale.
🔵 CONCEPTS
🔵 FEATURES
🔵 HOW TO USE
🔵 CONCLUSION
Visible Range Support and Resistance [BigBeluga] is a smart, range-sensitive tool for mapping meaningful horizontal levels. By scanning only what you see on the screen, it provides an adaptive edge to traders focused on real-time price action. Whether you’re scalping short-term zones or zooming out for macro structure, this tool flexes with your view to keep the most relevant levels front and center.
Visible Range Support and Resistance [BigBeluga] is a dynamic support/resistance tool that analyzes price structure only within the visible range of your chart. It detects key levels based on clustered pivots inside a binned vertical range and highlights zones where price has historically reacted. The tool adjusts in real-time as you pan or zoom, offering adaptive precision at any scale.
🔵 CONCEPTS
- Pivot Clustering: Price highs/lows are collected into horizontal "bins" across the visible chart range. If multiple pivots align within a bin, that area is marked as a potential support or resistance zone.
- Visible Range Only: Calculations are limited strictly to the bars currently visible on the chart. Zooming or panning changes the result.
- Bin System: The visible high-to-low range is divided into 100 horizontal zones (bins) to group pivots and detect confluence.
- Multi-Threshold Detection: Users can enable two separate S/R detection levels with different pivot count thresholds for more nuanced signals. The more pivot points a level has, the thicker and richer the color.
- Directional Context: Labels include arrows (▲ or ▼) to show whether the current price is above (support) or below (resistance) each zone.
- Range Boundaries: The top and bottom of the visible range are marked with dashed lines and labeled as Top Range and Bottom Range.
🔵 FEATURES
- Detects S/R zones based on the number of pivots found within each price bin.
- 100 horizontal bins divide the visible price range, allowing high resolution detection.
- Only uses data from visible bars—zooming out recalculates the indicator for more data.
- Customizable number of pivot confirmations (e.g., 2, 3, 4, 5) before a level is shown.
5 Pivots - Dual-level detection lets you show stronger and weaker zones separately.
- Automatically colors support (green) and resistance (blue) with dynamic intensity.
- Labels show pivot count and direction (support/resistance).
- Automatic cleanup of overlapping levels for visual clarity.
- Dashed top/bottom range markers help define the visible scope.
- Session SMA calculates from the visible range start (from the chart edge)
- Visible range bars count
🔵 HOW TO USE
- Zoom in for precise intra-range support and resistance zones based on current structure.
- Zoom out to load more pivot data and identify long-term levels.
- Use the pivot threshold (e.g., 3 or 4) to control signal strength—higher = stronger levels.
- Watch for price reactions or breakouts around high-pivot zones to identify key areas.
- Combine with trend, volume, or order flow tools to confirm the relevance of each S/R zone.
- Adjust line and label colors for better contrast with your chart theme.
🔵 CONCLUSION
Visible Range Support and Resistance [BigBeluga] is a smart, range-sensitive tool for mapping meaningful horizontal levels. By scanning only what you see on the screen, it provides an adaptive edge to traders focused on real-time price action. Whether you’re scalping short-term zones or zooming out for macro structure, this tool flexes with your view to keep the most relevant levels front and center.
Release Note
- automatic levels width
🌐 bigbeluga.org/tv - Get access to our powerful tools & indicators.
🔵 Learn More -> docs.bigbeluga.org/
🔵 Join Discord -> go.bigbeluga.org/k65q9bfqfu
All content provided by BigBeluga is for educational purposes only
🔵 Learn More -> docs.bigbeluga.org/
🔵 Join Discord -> go.bigbeluga.org/k65q9bfqfu
All content provided by BigBeluga is for educational purposes only
คำจำกัดสิทธิ์ความรับผิดชอบ
ข้อมูลและบทความไม่ได้มีวัตถุประสงค์เพื่อก่อให้เกิดกิจกรรมทางการเงิน, การลงทุน, การซื้อขาย, ข้อเสนอแนะ หรือคำแนะนำประเภทอื่น ๆ ที่ให้หรือรับรองโดย TradingView อ่านเพิ่มเติมใน ข้อกำหนดการใช้งาน
🌐 bigbeluga.org/tv - Get access to our powerful tools & indicators.
🔵 Learn More -> docs.bigbeluga.org/
🔵 Join Discord -> go.bigbeluga.org/k65q9bfqfu
All content provided by BigBeluga is for educational purposes only
🔵 Learn More -> docs.bigbeluga.org/
🔵 Join Discord -> go.bigbeluga.org/k65q9bfqfu
All content provided by BigBeluga is for educational purposes only
คำจำกัดสิทธิ์ความรับผิดชอบ
ข้อมูลและบทความไม่ได้มีวัตถุประสงค์เพื่อก่อให้เกิดกิจกรรมทางการเงิน, การลงทุน, การซื้อขาย, ข้อเสนอแนะ หรือคำแนะนำประเภทอื่น ๆ ที่ให้หรือรับรองโดย TradingView อ่านเพิ่มเติมใน ข้อกำหนดการใช้งาน