ZH EP Filter 001
ZH EP Filter
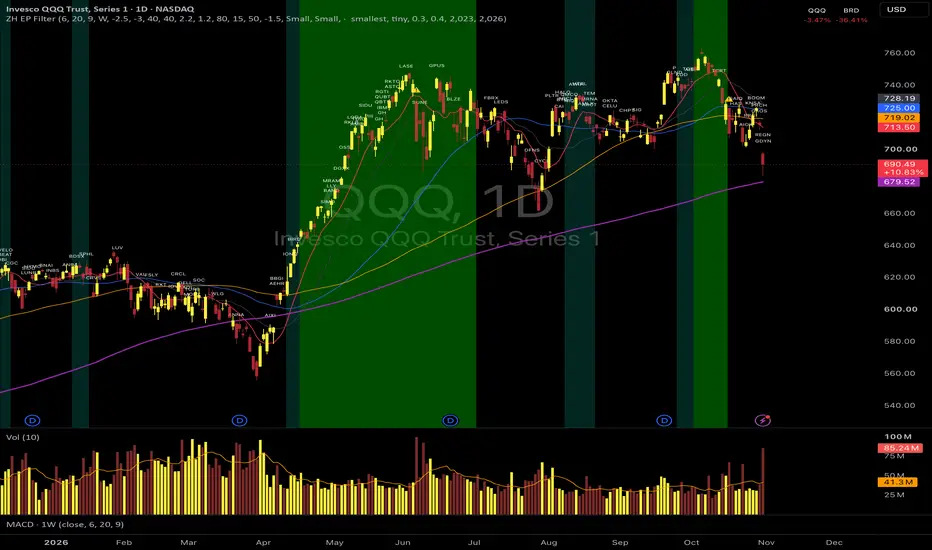
A daily chart overlay for SPY or QQQ that shows EP history against the market regime. It plots 280 Episodic Pivots (EPs) from January 2023 to October 2026 on the same chart as the market's trend, so the two can be studied side by side.
WHAT'S ON THE CHART
EP labels: 280 EPs appear as tiny white ticker names above their dates. EPs on the same day stack vertically. Users can switch to dots, change the color, size, and spacing, and limit the range by year.
Background: green when the weekly MACD (6, 20, 9) line is above its signal. Teal when the daily 10 SMA is above the 20 and the weekly MACD is rising but hasn't confirmed yet. Otherwise there's no shading, so the chart's own background shows through.
Moving averages: the 10, 20, 50, 100, and 200 SMAs, each with its own colour and a show/hide setting.
Trend Stopper (⚠️): marks rare liquidation candles, a large, high-volume down day after a long calm stretch, with the index in an uptrend beforehand. It's context, not a signal. The marker size is adjustable, and there are optional labels for tuning and diagnosis, plus an alert.
QQQ / BRD: the top right shows QQQ's daily % change and market breadth, green when positive and red when negative.
There are also alerts for the weekly MACD crossing up and down.
HOW ZH USES IT
ZH uses the market to set position size, never to decide whether to take an EP or when to exit one. The chart shows why: EPs appear in every environment, in strong uptrends, choppy ranges, pullbacks, and the weeks after selloffs. The labels keep appearing whether the background is green, teal, or black. An EP is driven by a stock-specific catalyst and massive volume on a neglected stock, so its fuel belongs to the stock, not the index. A strong market produces more EPs and more outsized winners. A weak market produces fewer, but the ones that qualify still work.
So ZH keeps trading the setup and adjusts risk based on where the index sits relative to its 10 and 20 SMA:
• Below the 10 and 20: risk 0.30% to 0.35% of the account per trade.
• Above the 10 and 20: risk 0.50% to 1% of the account per trade.
Size is set before the open. During the session, exits come from the stock itself, not the index.
Best used on SPY or QQQ, daily timeframe.
This indicator is for education and study only. It is not financial advice.
A daily chart overlay for SPY or QQQ that shows EP history against the market regime. It plots 280 Episodic Pivots (EPs) from January 2023 to October 2026 on the same chart as the market's trend, so the two can be studied side by side.
WHAT'S ON THE CHART
EP labels: 280 EPs appear as tiny white ticker names above their dates. EPs on the same day stack vertically. Users can switch to dots, change the color, size, and spacing, and limit the range by year.
Background: green when the weekly MACD (6, 20, 9) line is above its signal. Teal when the daily 10 SMA is above the 20 and the weekly MACD is rising but hasn't confirmed yet. Otherwise there's no shading, so the chart's own background shows through.
Moving averages: the 10, 20, 50, 100, and 200 SMAs, each with its own colour and a show/hide setting.
Trend Stopper (⚠️): marks rare liquidation candles, a large, high-volume down day after a long calm stretch, with the index in an uptrend beforehand. It's context, not a signal. The marker size is adjustable, and there are optional labels for tuning and diagnosis, plus an alert.
QQQ / BRD: the top right shows QQQ's daily % change and market breadth, green when positive and red when negative.
There are also alerts for the weekly MACD crossing up and down.
HOW ZH USES IT
ZH uses the market to set position size, never to decide whether to take an EP or when to exit one. The chart shows why: EPs appear in every environment, in strong uptrends, choppy ranges, pullbacks, and the weeks after selloffs. The labels keep appearing whether the background is green, teal, or black. An EP is driven by a stock-specific catalyst and massive volume on a neglected stock, so its fuel belongs to the stock, not the index. A strong market produces more EPs and more outsized winners. A weak market produces fewer, but the ones that qualify still work.
So ZH keeps trading the setup and adjusts risk based on where the index sits relative to its 10 and 20 SMA:
• Below the 10 and 20: risk 0.30% to 0.35% of the account per trade.
• Above the 10 and 20: risk 0.50% to 1% of the account per trade.
Size is set before the open. During the session, exits come from the stock itself, not the index.
Best used on SPY or QQQ, daily timeframe.
This indicator is for education and study only. It is not financial advice.

คำจำกัดสิทธิ์ความรับผิดชอบ
ข้อมูลและบทความไม่ได้มีวัตถุประสงค์เพื่อก่อให้เกิดกิจกรรมทางการเงิน, การลงทุน, การซื้อขาย, ข้อเสนอแนะ หรือคำแนะนำประเภทอื่น ๆ ที่ให้หรือรับรองโดย TradingView อ่านเพิ่มเติมใน ข้อกำหนดการใช้งาน
คำจำกัดสิทธิ์ความรับผิดชอบ
ข้อมูลและบทความไม่ได้มีวัตถุประสงค์เพื่อก่อให้เกิดกิจกรรมทางการเงิน, การลงทุน, การซื้อขาย, ข้อเสนอแนะ หรือคำแนะนำประเภทอื่น ๆ ที่ให้หรือรับรองโดย TradingView อ่านเพิ่มเติมใน ข้อกำหนดการใช้งาน