OPEN-SOURCE SCRIPT
ที่อัปเดต: Stockbee Sugar Babies Pine Screener by QuadrantLower
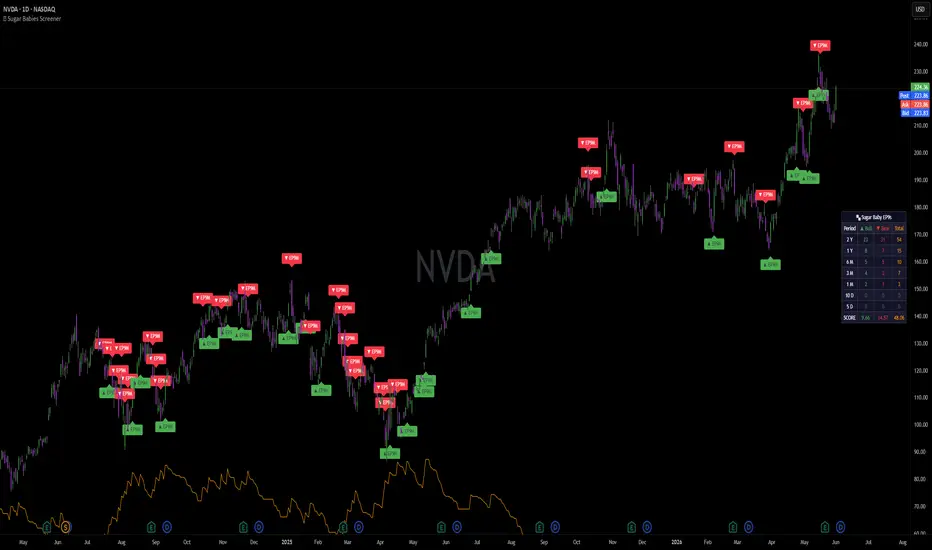
PLEASE NOTE: this is intended to be used with TradingView's Pine Screener and not as a chart indicator!
At the time of writing, TradingView's Pine Screener is in Beta and, as a result, using this script is somewhat painful and should be considered experimental - it is a proof of concept and does not offer a great user experience. Sorry about that!
This script is for helping you generate a weekly Watchlist of Sugar Babies - this is Stockbee/Pradeep Bonde's concept of stocks which have a history of making 4%+ breakouts with institutional volume (9M+ on the day) - that you can then keep a close eye on and look for breakout, reversal and anticipation trades (as per Pradeep's methodology).
To use this screener:
Here is an example Sugar Babies Universe Watchlist. Don't ask me to update it - please make your own.
Here are all US stocks available on TradingView in May 2026 filtered by Mkt Cap >= 10M USD and Price >= 0.3 USD, then split in to 20 watchlists:
RISK DISCLAIMER
All content, including tools and scripts, released by QuadrantLower are purely for informational and educational purposes only. Nothing herein should be construed as financial advice or a recommendation to buy, sell, or hold any security or financial instrument. All trading involves risk and may not be suitable for all investors. You are solely responsible for your own trading decisions. Past performance is not indicative of future results.
At the time of writing, TradingView's Pine Screener is in Beta and, as a result, using this script is somewhat painful and should be considered experimental - it is a proof of concept and does not offer a great user experience. Sorry about that!
This script is for helping you generate a weekly Watchlist of Sugar Babies - this is Stockbee/Pradeep Bonde's concept of stocks which have a history of making 4%+ breakouts with institutional volume (9M+ on the day) - that you can then keep a close eye on and look for breakout, reversal and anticipation trades (as per Pradeep's methodology).
To use this screener:
- Favourite the script so that it shows up in TradingView’s Pine Screener
- Create watchlists to filter - unfortunately, this is how TradingView’s Pine Screener currently works - you can't simply scan the entire market. At the time of writing, TradingView has a limit of 500 symbols per Watchlist (for all subscriptions other than Basic, which has 30, and Ultimate, which has 1000), so you will need to split up the market into separate watchlists. This is painful, but possible, using a combination of TradingView’s Stock Screener, exporting to CSV, editing outside of TradingView and importing to create watchlists. You can significantly minimize the amount of work by reducing the size of the universe to your needs (e.g. minimum Market Cap, minimum Price, limit to certain sectors only etc.). On the plus side, once this is done, these watchlists are good for many months, but they will atrophy over time as they wont get updated with IPOs or symbol changes.
- Launch the Pine Screener, select one of your Watchlists, select the indicator (it will only function on the 1D timeframe, but this is Pine Screener’s default so no worries), click on the columns options button (the three vertical lines button on the top right), enable all of the unchecked columns, then hit scan.
- Once the scan is complete you should see the columns populated with data. The green columns represent Bullish EP9s, the red columns represent Bearish EP9s and the orange columns represent the sum of Bullish and Bearish EP9s. There are seven lookback periods – 2Y, 1Y, 6M, 3M, 1M, 10D and 5D. Longer lookbacks are not possible as Pine Screener has a 500 bar (i.e. 500 day) limit.
- You can then sort the columns and save the top, say, five results given by each Total column into a separate watchlist – repeat for each of your watchlists until you have distilled your Universe of Sugar Babies for the week :)
Here is an example Sugar Babies Universe Watchlist. Don't ask me to update it - please make your own.
Here are all US stocks available on TradingView in May 2026 filtered by Mkt Cap >= 10M USD and Price >= 0.3 USD, then split in to 20 watchlists:
- ▚ US Market - Pt 01
- ▚ US Market - Pt 02
- ▚ US Market - Pt 03
- ▚ US Market - Pt 04
- ▚ US Market - Pt 05
- ▚ US Market - Pt 06
- ▚ US Market - Pt 07
- ▚ US Market - Pt 08
- ▚ US Market - Pt 09
- ▚ US Market - Pt 10
- ▚ US Market - Pt 11
- ▚ US Market - Pt 12
- ▚ US Market - Pt 13
- ▚ US Market - Pt 14
- ▚ US Market - Pt 15
- ▚ US Market - Pt 16
- ▚ US Market - Pt 17
- ▚ US Market - Pt 18
- ▚ US Market - Pt 19
- ▚ US Market - Pt 20
RISK DISCLAIMER
All content, including tools and scripts, released by QuadrantLower are purely for informational and educational purposes only. Nothing herein should be construed as financial advice or a recommendation to buy, sell, or hold any security or financial instrument. All trading involves risk and may not be suitable for all investors. You are solely responsible for your own trading decisions. Past performance is not indicative of future results.
Release Note
Tweaks to default settings.Release Note
Added "Sugar Baby Scores" to reduce the pain involved in using the script. These rank symbols via a blend of recency and consistency which allows you to take the top ranking stocks from a watchlist in one fell swoop rather than having to go through and scrape each lookback period one-by-one.So, the suggested workflow is now:
- Create your watchlist(s), as per the original instructions
- Scan the watchlist(s) in Pine Screener, ranking by your preferred Sugar Baby Score column (Bull, Bear or Total)
- Save the top ranking stocks to your Sugar Baby watchlist for the week – once you are familiar with the results being returned you can speed the process up further by filtering for values above a threshold which will allow you to select all rather than manually counting for the top X per scan
The Sugar Baby scores are calculated by:
- Summing the results of each period — this skews towards recent activity, as signals in shorter lookback periods are counted multiple times in the sum. For example, an EP9 appearing in the 5D count is also captured in the 10D, 1M, 3M, 6M, 1Y and 2Y counts, thus contributing to the sum seven times. Whereas a lone EP9 from 18 months ago only appears once.
- Multiplying by the oldest available lookback period’s count — this amplifies consistency by boosting the score for symbols that have more historic activity. For example, two symbols with identical recent activity will score differently if one has been more active in the past.
- Dividing by 10 — this is a cosmetic step that has no effect on ranking, it simply makes the numbers less frightening to behold.
Thanks to Peacex3 for the suggestion which triggered this idea!
สคริปต์โอเพนซอร์ซ
ด้วยเจตนารมณ์หลักของ TradingView ผู้สร้างสคริปต์นี้ได้ทำให้เป็นโอเพนซอร์ส เพื่อให้เทรดเดอร์สามารถตรวจสอบและยืนยันฟังก์ชันการทำงานของมันได้ ขอชื่นชมผู้เขียน! แม้ว่าคุณจะใช้งานได้ฟรี แต่โปรดจำไว้ว่าการเผยแพร่โค้ดซ้ำจะต้องเป็นไปตาม กฎระเบียบการใช้งาน ของเรา

คำจำกัดสิทธิ์ความรับผิดชอบ
ข้อมูลและบทความไม่ได้มีวัตถุประสงค์เพื่อก่อให้เกิดกิจกรรมทางการเงิน, การลงทุน, การซื้อขาย, ข้อเสนอแนะ หรือคำแนะนำประเภทอื่น ๆ ที่ให้หรือรับรองโดย TradingView อ่านเพิ่มเติมใน ข้อกำหนดการใช้งาน
สคริปต์โอเพนซอร์ซ
ด้วยเจตนารมณ์หลักของ TradingView ผู้สร้างสคริปต์นี้ได้ทำให้เป็นโอเพนซอร์ส เพื่อให้เทรดเดอร์สามารถตรวจสอบและยืนยันฟังก์ชันการทำงานของมันได้ ขอชื่นชมผู้เขียน! แม้ว่าคุณจะใช้งานได้ฟรี แต่โปรดจำไว้ว่าการเผยแพร่โค้ดซ้ำจะต้องเป็นไปตาม กฎระเบียบการใช้งาน ของเรา
คำจำกัดสิทธิ์ความรับผิดชอบ
ข้อมูลและบทความไม่ได้มีวัตถุประสงค์เพื่อก่อให้เกิดกิจกรรมทางการเงิน, การลงทุน, การซื้อขาย, ข้อเสนอแนะ หรือคำแนะนำประเภทอื่น ๆ ที่ให้หรือรับรองโดย TradingView อ่านเพิ่มเติมใน ข้อกำหนดการใช้งาน