MACD Multi-MA [MarkitTick]
More exclusive indicators from MarkitTick
Subscribe to MarkitTick for $43.75/month to get exclusive indicators by this author. You pay right on TradingView and can use them on your charts straight away.
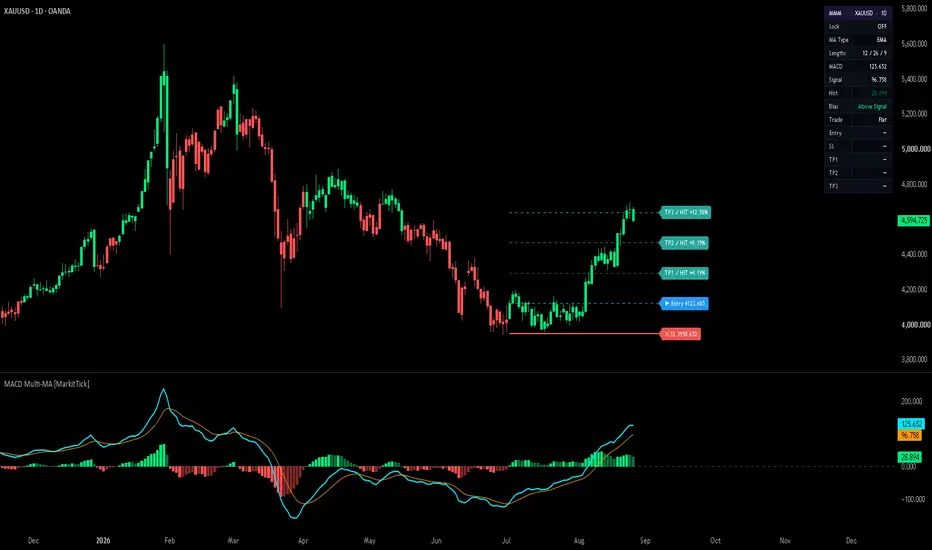
Explore MarkitTick💡 MACD Multi-MA rebuilds the classic Moving Average Convergence Divergence oscillator so that the fast, slow and signal averages can be drawn from a library of 29 moving-average types instead of the exponential average alone. The MACD line, the signal line and the four-colour histogram are plotted in their own pane, the price candles can be coloured by the oscillator's state, and every signal-line crossover on a closed bar can open a reference trade with an ATR-based stop and three targets measured in multiples of risk. A compact dashboard summarises the current readings and the state of the latest trade.
✨ Originality and Utility
The standard MACD measures the gap between a 12-period and a 26-period exponential average and smooths that gap with a 9-period exponential average. The averaging method is fixed, so the trader inherits one particular balance between lag and noise. This script keeps Gerald Appel's structure intact but lets the averaging method itself become the variable under study.
Every choice of moving average changes how quickly the MACD line reacts, how much noise it passes through and how often it crosses its signal line. A zero-lag or Hull-family average makes the oscillator turn earlier; an adaptive average such as KAMA, FRAMA or VIDYA slows it down in choppy conditions and speeds it up in directional ones; a filter such as the Super Smoother or the Kalman estimator removes high-frequency jitter at the cost of some delay. Being able to switch between them inside one pane, with identical lengths, gives a direct side-by-side reading of how the smoothing method shapes momentum signals.
● Why the components belong together
The script combines four layers, and each one reads the same single event — the relationship between the MACD line and its signal line — rather than stacking unrelated indicators:
The ATR is the only outside component. It does not influence the signal; it only measures how far the stop and targets sit from the entry.
🔬 Methodology and Concepts
● The oscillator
The MACD line is the fast average of the chosen source minus the slow average of the same source, both of the selected type. The signal line is an average of the MACD line, again of the same type and using the Signal length. The histogram is the MACD line minus the signal line. With the default EMA type and 12, 26 and 9, the readings follow the classic MACD; the script's own exponential average starts from the first available value rather than from a simple-average seed, so the earliest bars of history can differ slightly from the built-in version before the two converge.
● The moving-average library
● The reference trade
A long trade opens when the MACD line crosses above the signal line on a closed bar; a short trade opens on a cross below. The entry is the close of that bar. The risk distance is ATR multiplied by SL ATR, and the stop sits that distance below the entry for a long or above it for a short. TP1, TP2 and TP3 sit at the entry plus or minus the risk distance multiplied by the three target multiples; the multiples are sorted from nearest to farthest before use. A trade is not opened if the risk distance is not larger than one tick or if a level would fall at or below zero.
Targets count as reached when the bar's high (long) or low (short) touches them, from the bar after the entry onward. The stop counts as hit only when a bar closes beyond it. If TP3 and the stop occur on the same bar, TP3 is recorded. A trade ends at TP3, at the stop, or at an opposite crossover; an opposite crossover that also meets the conditions opens the new trade at once. A crossover in the same direction as an open trade is ignored.
● Safeguards
🎨 Visual Guide
● Indicator pane
● Price chart
● Dashboard
The header reads MMM with the symbol and timeframe. The rows show Lock (ACTIVE in red or OFF), MA Type, Lengths (Fast / Slow / Signal), the current MACD, Signal and Hist values (Hist in its histogram colour), Bias (Above Signal in green, Below Signal in red, or At Signal), Trade (Long in green, Short in red, or Flat), and the Entry, SL, TP1, TP2 and TP3 prices of an open trade, with a check mark next to each target already reached. Amber rows appear only as warnings: Fast must be below Slow, no volume for a volume type, or target multiples that were reordered. When the dashboard is turned off, only these warnings remain.
📖 How to Use
MACD values depend on the price of the instrument, so readings cannot be compared across different symbols, and the oscillator is not well suited to marking overbought or oversold levels.
● Repainting and live-bar behaviour
The averages are calculated on the chart's own data with no higher-timeframe requests, and trades open only on closed bars, so a confirmed entry does not move afterwards. Some elements do change on the bar that is still forming: the lines, the histogram and the candle colour update with every tick until the bar closes, and a target can be marked as reached while the bar is still open, because a touch of the high or low counts. The Lock setting applies only to the latest bar; after the chart reloads, that bar becomes history and a crossover blocked while Lock was on can appear as a trade.
⚙️ Inputs and Settings
● Core
● MA Params
These apply only to their own type: ALMA Off and ALMA Sig move the Gaussian weight and change its width; T3 Vf trades smoothness against responsiveness; KAMA Fast and KAMA Slow set the fastest and slowest speeds; JMA Phase and JMA Pow shape the JMA's overshoot and smoothing; Kal Q and Kal R set how strongly the Kalman estimate trusts new prices (a higher Q relative to R reacts faster); LLAMA LB sets how many past bars vote, and LLAMA Rng sets how far the working length may move around the chosen length.
● Trade Tools
The reference trades are drawn from historical crossovers and include no commission or slippage. Past results never guarantee future performance.
● Visuals, Dashboard, Alerts and Colors
Hist, Zero, Levels and Candles toggle each visual layer, and Candle Mode chooses the candle reference. The dashboard can be hidden, moved to any corner and drawn on the price chart or in the pane. The alert action words set the text placed in the "action" field of the alert message for long and short entries, full closes and partial closes; each message also carries the ticker, timeframe, direction, entry, the relevant levels and the MA type. Six alert conditions are also available: BUY Signal, SELL Signal, Close Long Signal, Close Short Signal, Partial Close Long and Partial Close Short. Every colour in the pane, on the levels, on the candles and in the dashboard can be changed.
🔍 Deconstruction of the Underlying Scientific and Academic Framework
● Moving averages as low-pass filters
In signal-processing terms, every moving average is a low-pass filter: it passes slow price movement and attenuates fast fluctuation. All causal filters pay for smoothness with delay; the longer and flatter the weighting, the greater the lag. The 29 types in this script are different answers to that single trade-off. Weightings that favour recent bars (WMA, EMA, Hull family, ZLEMA, DEMA, TEMA) shift the balance toward lower lag; stacked and symmetric weightings (TRIMA, DWMA, TWMA) shift it toward smoothness; recursive filters (SSF, JMA, T3) shape the frequency response more selectively than a plain window can.
● The MACD as a band-pass oscillator
Subtracting a slow low-pass filter from a fast one removes the slowest components, which both filters pass, and the fastest components, which both filters suppress. What remains is a band of intermediate cycles, which is why the MACD oscillates around zero. Colby describes the MACD line as a measure of price velocity and the histogram as a measure of price acceleration: the signal line is a further smoothing of the velocity, and the distance from it shows whether that velocity is increasing or decreasing. Changing the filter type changes the width and position of this band, and therefore which swings the oscillator responds to.
● Adaptive smoothing
The adaptive types make the filter's speed a function of the data. The efficiency ratio in KAMA measures how directional recent movement has been; the fractal dimension in FRAMA measures how much of the window's range is filled by jagged movement, with a dimension near one indicating a smooth path and near two a rough one; VIDYA uses momentum strength in the same role. In each case the filter moves faster when price travels efficiently and slower when it oscillates, which reduces crossovers in sideways markets.
● Estimation theory
The Kalman option treats the true price level as a hidden state observed with noise. Each bar it predicts the state, compares the prediction with the new price and moves toward that price by a gain computed from the process-noise and measurement-noise assumptions; the uncertainty of the estimate is updated at every step. The LLAMA option borrows from nearest-neighbour methods in statistical learning: past situations are weighted by their similarity to the present, measured as a log-scaled distance between RSI readings, and their outcomes are averaged into a prediction that steers the average's length.
● Volatility-scaled risk
Measuring the stop in multiples of the Average True Range normalises risk to the instrument's current range, so the same settings produce proportionate distances on quiet and volatile markets. Expressing targets as multiples of that risk distance (R multiples) makes every trade's reward directly comparable to its risk, independent of price level.
⚠️ Disclaimer
All provided scripts and indicators are strictly for educational exploration and must not be interpreted as financial advice or a recommendation to execute trades. We expressly disclaim all liability for any financial losses or damages that may result, directly or indirectly, from the reliance on or application of these tools. Market participation carries inherent risk where past performance never guarantees future returns, leaving all investment decisions and due diligence solely at your own discretion.
✨ Originality and Utility
The standard MACD measures the gap between a 12-period and a 26-period exponential average and smooths that gap with a 9-period exponential average. The averaging method is fixed, so the trader inherits one particular balance between lag and noise. This script keeps Gerald Appel's structure intact but lets the averaging method itself become the variable under study.
Every choice of moving average changes how quickly the MACD line reacts, how much noise it passes through and how often it crosses its signal line. A zero-lag or Hull-family average makes the oscillator turn earlier; an adaptive average such as KAMA, FRAMA or VIDYA slows it down in choppy conditions and speeds it up in directional ones; a filter such as the Super Smoother or the Kalman estimator removes high-frequency jitter at the cost of some delay. Being able to switch between them inside one pane, with identical lengths, gives a direct side-by-side reading of how the smoothing method shapes momentum signals.
● Why the components belong together
The script combines four layers, and each one reads the same single event — the relationship between the MACD line and its signal line — rather than stacking unrelated indicators:
- The oscillator layer computes the momentum reading with the chosen average.
- The candle layer paints that same reading onto price, so the state of momentum is visible without looking down at the pane.
- The trade-level layer turns a confirmed crossover into a concrete reference plan, sized by ATR so the stop distance follows current volatility rather than a fixed price amount.
- The dashboard reports the numbers behind all three, including warnings when a setting makes the output invalid.
The ATR is the only outside component. It does not influence the signal; it only measures how far the stop and targets sit from the entry.
🔬 Methodology and Concepts
● The oscillator
The MACD line is the fast average of the chosen source minus the slow average of the same source, both of the selected type. The signal line is an average of the MACD line, again of the same type and using the Signal length. The histogram is the MACD line minus the signal line. With the default EMA type and 12, 26 and 9, the readings follow the classic MACD; the script's own exponential average starts from the first available value rather than from a simple-average seed, so the earliest bars of history can differ slightly from the built-in version before the two converge.
● The moving-average library
- Basic weightings: SMA (equal weights), EMA (exponential weights), RMA (Wilder-style smoothing), WMA (linearly rising weights), SWMA (a short symmetric weighting applied over the SMA in this script) and Median (the middle value of the window).
- Stacked weightings: DWMA and TWMA apply the WMA two and three times; TRIMA applies the SMA twice, which concentrates weight in the middle of the window.
- Volume weightings: VWMA weights each price by its bar volume; DVWMA and TVWMA stack it two and three times.
- Lag-reduced averages: DEMA and TEMA combine one, two and three nested EMAs to cancel part of their delay; ZLEMA feeds the EMA a price extrapolated by half its length; HMA, EHMA and THMA are the Hull average and its exponential and triple-weighted variants.
- Regression and Gaussian: LSMA is the end point of a least-squares line through the window; ALMA weights prices with a Gaussian curve whose centre and width are set by its Offset and Sigma.
- Adaptive averages: KAMA scales its speed by the efficiency ratio (net movement divided by the sum of bar-to-bar movements); VIDYA scales an EMA by the absolute Chande Momentum Oscillator; FRAMA scales its speed from an estimate of the fractal dimension of the window; McGinley adjusts its step by the ratio of price to the average raised to the fourth power.
- Filters: T3 is a six-stage EMA cascade combined with weights set by the volume factor; JMA is a three-stage recursive smoother controlled by Phase and Power; SSF is a two-pole Super Smoother filter; Kalman is a one-dimensional recursive estimator whose responsiveness is set by the ratio of process noise to measurement noise.
- LLAMA: an exponential average whose length moves inside a band around the chosen length. A nearest-neighbour vote over the last LLAMA LB bars compares the current RSI(14) and RSI(28) of the close with their past values; bars whose RSI pair looked similar get more weight, and their following one-bar price direction forms a prediction between -1 and +1. The prediction places the working length between the low and high edge of the band set by LLAMA Rng. This vote always reads the close, whatever source is selected.
● The reference trade
A long trade opens when the MACD line crosses above the signal line on a closed bar; a short trade opens on a cross below. The entry is the close of that bar. The risk distance is ATR multiplied by SL ATR, and the stop sits that distance below the entry for a long or above it for a short. TP1, TP2 and TP3 sit at the entry plus or minus the risk distance multiplied by the three target multiples; the multiples are sorted from nearest to farthest before use. A trade is not opened if the risk distance is not larger than one tick or if a level would fall at or below zero.
Targets count as reached when the bar's high (long) or low (short) touches them, from the bar after the entry onward. The stop counts as hit only when a bar closes beyond it. If TP3 and the stop occur on the same bar, TP3 is recorded. A trade ends at TP3, at the stop, or at an opposite crossover; an opposite crossover that also meets the conditions opens the new trade at once. A crossover in the same direction as an open trade is ignored.
● Safeguards
- On Heikin Ashi, Renko, Kagi, Point and Figure, Range and Line Break charts the script calculates nothing and shows a message asking for standard candles, because those charts show synthetic prices.
- If Fast is not shorter than Slow, the lines are still drawn but no trade opens.
- If a volume type is chosen on a symbol that reports no volume, nothing is drawn and no signal fires.
🎨 Visual Guide
● Indicator pane
- Cyan line, thicker: the MACD line.
- Orange line, thinner: the signal line.
- Bright green columns: histogram above zero and rising.
- Faded green columns: histogram above zero and falling.
- Bright red columns: histogram below zero and falling.
- Faded red columns: histogram below zero and rising.
- Grey horizontal line: the zero line.
● Price chart
- Candle colours: green on the bullish side of the chosen reference, red on the bearish side. In MACD × Signal mode the reference is the signal line; in MACD × Zero mode it is zero. On a bar where the MACD line sits exactly on the reference, the candle keeps its last colour. Before the oscillator has data, the candles keep the chart's own colours.
- Trade levels (off by default, enabled with Levels): a solid red line for the stop, a dashed blue line for the entry and dashed teal lines for TP1, TP2 and TP3, growing more opaque from TP1 to TP3. Only the latest trade is drawn.
- Level labels at the right end of the lines: "✕ SL" with its price, "▶ Entry" with its price, "◆ TP1", "✦ TP2" and "◆ TP3" with their prices. When two levels round to the same price, they share one label, for example "Entry / TP1".
- Hit labels: when a target is reached its label changes to the target name, "✓ HIT" and the percentage move from the entry; when the stop is hit, the stop label shows "SL ✓ HIT" and the percentage at the closing price.
- The lines extend ten bars past the bar where the trade closed, or ten bars past the latest bar while it is open.
● Dashboard
The header reads MMM with the symbol and timeframe. The rows show Lock (ACTIVE in red or OFF), MA Type, Lengths (Fast / Slow / Signal), the current MACD, Signal and Hist values (Hist in its histogram colour), Bias (Above Signal in green, Below Signal in red, or At Signal), Trade (Long in green, Short in red, or Flat), and the Entry, SL, TP1, TP2 and TP3 prices of an open trade, with a check mark next to each target already reached. Amber rows appear only as warnings: Fast must be below Slow, no volume for a volume type, or target multiples that were reordered. When the dashboard is turned off, only these warnings remain.
📖 How to Use
- Start with the default EMA 12/26/9 to see the familiar MACD, then switch the Type and watch how the crossovers move. A faster type turns earlier and crosses more often; a smoother or adaptive type crosses less often and later.
- Read the signal-line crossover as the primary event: the MACD line above the signal line means the gap between the averages is widening upward, below means it is widening downward. The histogram changes sign at the same moment.
- Read the zero line as the centerline: the MACD line above zero means the fast average is above the slow one.
- Use the histogram shading to watch momentum fade before a crossover: faded columns show the gap narrowing even while it keeps its sign.
- Use candle colouring to keep the momentum state in view on price. MACD × Signal follows crossovers; MACD × Zero follows the slower centerline condition.
- Treat the trade levels as a reference plan for study and review, not as instructions. They show where an ATR-sized stop and R-multiple targets would have sat after each confirmed crossover.
MACD values depend on the price of the instrument, so readings cannot be compared across different symbols, and the oscillator is not well suited to marking overbought or oversold levels.
● Repainting and live-bar behaviour
The averages are calculated on the chart's own data with no higher-timeframe requests, and trades open only on closed bars, so a confirmed entry does not move afterwards. Some elements do change on the bar that is still forming: the lines, the histogram and the candle colour update with every tick until the bar closes, and a target can be marked as reached while the bar is still open, because a touch of the high or low counts. The Lock setting applies only to the latest bar; after the chart reloads, that bar becomes history and a crossover blocked while Lock was on can appear as a trade.
⚙️ Inputs and Settings
● Core
- Type: the moving-average type used for all three averages.
- Src: the price the fast and slow averages are taken from.
- Fast, Slow, Signal: the three lengths (defaults 12, 26 and 9). Longer lengths smooth the oscillator and reduce crossovers; shorter lengths make it more responsive and noisier.
● MA Params
These apply only to their own type: ALMA Off and ALMA Sig move the Gaussian weight and change its width; T3 Vf trades smoothness against responsiveness; KAMA Fast and KAMA Slow set the fastest and slowest speeds; JMA Phase and JMA Pow shape the JMA's overshoot and smoothing; Kal Q and Kal R set how strongly the Kalman estimate trusts new prices (a higher Q relative to R reacts faster); LLAMA LB sets how many past bars vote, and LLAMA Rng sets how far the working length may move around the chosen length.
● Trade Tools
- Lock Signal: freezes the current trade on the latest bar and blocks new ones.
- ATR Len and SL ATR: the ATR length and the multiple that sets the stop distance.
- TP1 R, TP2 R, TP3 R: the targets in multiples of the risk; values out of order are sorted and flagged on the dashboard.
The reference trades are drawn from historical crossovers and include no commission or slippage. Past results never guarantee future performance.
● Visuals, Dashboard, Alerts and Colors
Hist, Zero, Levels and Candles toggle each visual layer, and Candle Mode chooses the candle reference. The dashboard can be hidden, moved to any corner and drawn on the price chart or in the pane. The alert action words set the text placed in the "action" field of the alert message for long and short entries, full closes and partial closes; each message also carries the ticker, timeframe, direction, entry, the relevant levels and the MA type. Six alert conditions are also available: BUY Signal, SELL Signal, Close Long Signal, Close Short Signal, Partial Close Long and Partial Close Short. Every colour in the pane, on the levels, on the candles and in the dashboard can be changed.
🔍 Deconstruction of the Underlying Scientific and Academic Framework
● Moving averages as low-pass filters
In signal-processing terms, every moving average is a low-pass filter: it passes slow price movement and attenuates fast fluctuation. All causal filters pay for smoothness with delay; the longer and flatter the weighting, the greater the lag. The 29 types in this script are different answers to that single trade-off. Weightings that favour recent bars (WMA, EMA, Hull family, ZLEMA, DEMA, TEMA) shift the balance toward lower lag; stacked and symmetric weightings (TRIMA, DWMA, TWMA) shift it toward smoothness; recursive filters (SSF, JMA, T3) shape the frequency response more selectively than a plain window can.
● The MACD as a band-pass oscillator
Subtracting a slow low-pass filter from a fast one removes the slowest components, which both filters pass, and the fastest components, which both filters suppress. What remains is a band of intermediate cycles, which is why the MACD oscillates around zero. Colby describes the MACD line as a measure of price velocity and the histogram as a measure of price acceleration: the signal line is a further smoothing of the velocity, and the distance from it shows whether that velocity is increasing or decreasing. Changing the filter type changes the width and position of this band, and therefore which swings the oscillator responds to.
● Adaptive smoothing
The adaptive types make the filter's speed a function of the data. The efficiency ratio in KAMA measures how directional recent movement has been; the fractal dimension in FRAMA measures how much of the window's range is filled by jagged movement, with a dimension near one indicating a smooth path and near two a rough one; VIDYA uses momentum strength in the same role. In each case the filter moves faster when price travels efficiently and slower when it oscillates, which reduces crossovers in sideways markets.
● Estimation theory
The Kalman option treats the true price level as a hidden state observed with noise. Each bar it predicts the state, compares the prediction with the new price and moves toward that price by a gain computed from the process-noise and measurement-noise assumptions; the uncertainty of the estimate is updated at every step. The LLAMA option borrows from nearest-neighbour methods in statistical learning: past situations are weighted by their similarity to the present, measured as a log-scaled distance between RSI readings, and their outcomes are averaged into a prediction that steers the average's length.
● Volatility-scaled risk
Measuring the stop in multiples of the Average True Range normalises risk to the instrument's current range, so the same settings produce proportionate distances on quiet and volatile markets. Expressing targets as multiples of that risk distance (R multiples) makes every trade's reward directly comparable to its risk, independent of price level.
⚠️ Disclaimer
All provided scripts and indicators are strictly for educational exploration and must not be interpreted as financial advice or a recommendation to execute trades. We expressly disclaim all liability for any financial losses or damages that may result, directly or indirectly, from the reliance on or application of these tools. Market participation carries inherent risk where past performance never guarantees future returns, leaving all investment decisions and due diligence solely at your own discretion.

💡 Proprietary indicators. Original research. Built by analysts who trade.
📢 Free Telegram: t.me/MarkitTick_Updates
👑 Premium: TradingView Marketplace
📘 Guides: markittick.com
📢 Free Telegram: t.me/MarkitTick_Updates
👑 Premium: TradingView Marketplace
📘 Guides: markittick.com
คำจำกัดสิทธิ์ความรับผิดชอบ
ข้อมูลและบทความไม่ได้มีวัตถุประสงค์เพื่อก่อให้เกิดกิจกรรมทางการเงิน, การลงทุน, การซื้อขาย, ข้อเสนอแนะ หรือคำแนะนำประเภทอื่น ๆ ที่ให้หรือรับรองโดย TradingView อ่านเพิ่มเติมใน ข้อกำหนดการใช้งาน
💡 Proprietary indicators. Original research. Built by analysts who trade.
📢 Free Telegram: t.me/MarkitTick_Updates
👑 Premium: TradingView Marketplace
📘 Guides: markittick.com
📢 Free Telegram: t.me/MarkitTick_Updates
👑 Premium: TradingView Marketplace
📘 Guides: markittick.com
คำจำกัดสิทธิ์ความรับผิดชอบ
ข้อมูลและบทความไม่ได้มีวัตถุประสงค์เพื่อก่อให้เกิดกิจกรรมทางการเงิน, การลงทุน, การซื้อขาย, ข้อเสนอแนะ หรือคำแนะนำประเภทอื่น ๆ ที่ให้หรือรับรองโดย TradingView อ่านเพิ่มเติมใน ข้อกำหนดการใช้งาน