OPEN-SOURCE SCRIPT
Edo PDH/PDL Levels
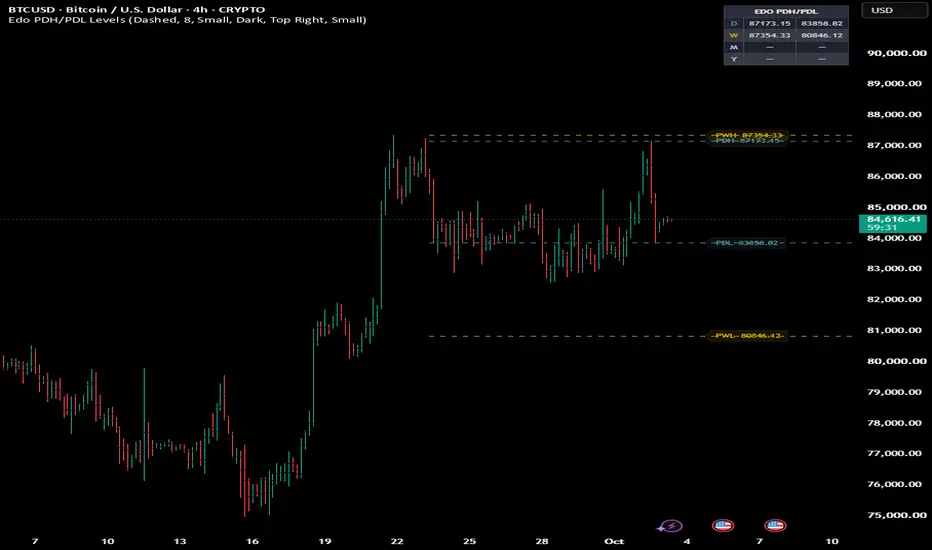
Edo PDH/PDL Levels — Draws the Previous Day, Week, Month and Year Highs and Lows as Objective, Non-Repainting Reference Levels


The extremes of a closed period are among the most objective and most-watched references in the market. Yesterday's high is a price everyone can see, and where breakout orders and short stops pile up; the same goes for the previous low, and for the extremes of the week, month and year. These levels act as magnets that price returns to test, as support and resistance that stop and turn it, and as breakout zones whose cross signals strength or weakness.
Edo PDH/PDL Levels keeps them always in view, drawn automatically so you never have to trace them by hand. It reads the high and low of each previous closed period, plots them as labelled horizontal lines extended to the right, summarizes them in a panel, and alerts when price crosses the day's or week's. Because they are computed on already-closed periods, the values are firm: they do not repaint or change with the running candle. It is built for intraday but useful on any timeframe, and it is self-contained: the levels come straight from the closed periods of the chart's own series.
THE LEVELS
The indicator offers up to four pairs of levels, one per higher timeframe: PDH/PDL (previous day, teal), PWH/PWL (previous week, gold), PMH/PML (previous month, purple) and PYH/PYL (previous year, red). The day and week are on by default; the month and year are optional, off by default to keep the chart clean. Each level is a horizontal line labelled with its name and exact price, extended to the right, in the color of its timeframe.
WHY THEY MATTER
Previous-period extremes are objective references anyone can read. The PDH and PDL frame the previous day's range: while price moves between them the market is inside yesterday's range; a cross above the PDH is a signal of strength that opens the door to continuation, a cross below the PDL, of weakness. The weekly PWH/PWL are higher-weight references, framing the previous weekly range and often acting as more robust support and resistance. And the confluence between periods — a PDH that coincides with the PWH, a PDL sitting on a weekly low — adds weight to a level.
THE RANGE MIDPOINT
Beyond the extremes, the indicator can draw the 50% midpoint of each previous period's range. This equilibrium line is a mean-reversion reference: price tends to gravitate toward the center of the previous range, and the 50% often acts as a magnet and a pivot between its bullish and bearish halves. It is off by default and enabled with the "Show previous range midpoint (50%)" option, drawing PD 50%, PW 50% and so on in each timeframe's color.
INFORMATION PANEL
A compact panel under the indicator header lists, per period (D, W, M, Y), the previous high and low. Active periods show their value and color; inactive ones, dashes. It is the quick numeric reference of every level at a glance, even when their lines are off-screen. The panel sits in any of the four chart corners (Top Right by default), comes in three sizes (Tiny / Small / Normal) and two themes (Dark / Light), and can be hidden entirely. To keep the calculation light, it is drawn only on the last bar.
NO REPAINTING
The levels are read from the previous closed period of each timeframe. Since those periods are already finished — yesterday, last week — the values are fixed the moment the period closes and stay constant throughout the current one. There is no intrabar change and no repainting.
STYLE AND CONFIGURATION
The look is fully configurable. Line style: solid, dashed (default) or dotted. Extension: lines extend to the right up to a configurable offset, keeping labels ahead of price. Labels can be shown or hidden and carry the level name and its price. Each period has its own configurable color, and a Dark/Light theme blends with the background. In the Levels block you toggle the day, week, month, year and the 50% midpoint; the defaults are calibrated for intraday, showing the day's and week's levels.
ALERTS
Four predefined alerts cover the key crosses: Cross above PDH and Cross below PDL on the day levels, Cross above PWH and Cross below PWL on the week levels. Clearing the PDH or PWH indicates strength and possible continuation; losing the PDL or PWL, weakness. It pays to tell a genuine cross that holds from a sweep that re-enters the range, a nuance read better by pairing the level with price's reaction.
HOW TO READ IT
Use the levels as support and resistance: while price ranges between the PDH and PDL it is inside yesterday's range, and breaking them opens the way, with the weekly levels as a higher-grade frame. Read the cross as a strength signal — a decisive close above a previous extreme is strength, losing it is weakness — and watch for confluence, where a day level meets a week level and gains weight. The 50% midpoint, when enabled, flags the range's equilibrium. And combined with the Edolab structure indicators, which read swings, order blocks and liquidity zones, these levels place those reads inside a map of firm, universally watched references.
OPEN SOURCE
Edo PDH/PDL Levels is published as a free open source indicator. The full Pine Script is publicly accessible on TradingView for study, adaptation and integration into any workflow. Part of the Edolab Markets free open source tools ecosystem, available on TradingView.
This indicator is a technical analysis tool for educational and informational purposes only. It does not generate automatic buy or sell signals and should not be considered financial advice. Trading financial markets involves significant risk of capital loss. Past performance does not guarantee future results. Always use proper risk management.
The extremes of a closed period are among the most objective and most-watched references in the market. Yesterday's high is a price everyone can see, and where breakout orders and short stops pile up; the same goes for the previous low, and for the extremes of the week, month and year. These levels act as magnets that price returns to test, as support and resistance that stop and turn it, and as breakout zones whose cross signals strength or weakness.
Edo PDH/PDL Levels keeps them always in view, drawn automatically so you never have to trace them by hand. It reads the high and low of each previous closed period, plots them as labelled horizontal lines extended to the right, summarizes them in a panel, and alerts when price crosses the day's or week's. Because they are computed on already-closed periods, the values are firm: they do not repaint or change with the running candle. It is built for intraday but useful on any timeframe, and it is self-contained: the levels come straight from the closed periods of the chart's own series.
THE LEVELS
The indicator offers up to four pairs of levels, one per higher timeframe: PDH/PDL (previous day, teal), PWH/PWL (previous week, gold), PMH/PML (previous month, purple) and PYH/PYL (previous year, red). The day and week are on by default; the month and year are optional, off by default to keep the chart clean. Each level is a horizontal line labelled with its name and exact price, extended to the right, in the color of its timeframe.
WHY THEY MATTER
Previous-period extremes are objective references anyone can read. The PDH and PDL frame the previous day's range: while price moves between them the market is inside yesterday's range; a cross above the PDH is a signal of strength that opens the door to continuation, a cross below the PDL, of weakness. The weekly PWH/PWL are higher-weight references, framing the previous weekly range and often acting as more robust support and resistance. And the confluence between periods — a PDH that coincides with the PWH, a PDL sitting on a weekly low — adds weight to a level.
THE RANGE MIDPOINT
Beyond the extremes, the indicator can draw the 50% midpoint of each previous period's range. This equilibrium line is a mean-reversion reference: price tends to gravitate toward the center of the previous range, and the 50% often acts as a magnet and a pivot between its bullish and bearish halves. It is off by default and enabled with the "Show previous range midpoint (50%)" option, drawing PD 50%, PW 50% and so on in each timeframe's color.
INFORMATION PANEL
A compact panel under the indicator header lists, per period (D, W, M, Y), the previous high and low. Active periods show their value and color; inactive ones, dashes. It is the quick numeric reference of every level at a glance, even when their lines are off-screen. The panel sits in any of the four chart corners (Top Right by default), comes in three sizes (Tiny / Small / Normal) and two themes (Dark / Light), and can be hidden entirely. To keep the calculation light, it is drawn only on the last bar.
NO REPAINTING
The levels are read from the previous closed period of each timeframe. Since those periods are already finished — yesterday, last week — the values are fixed the moment the period closes and stay constant throughout the current one. There is no intrabar change and no repainting.
STYLE AND CONFIGURATION
The look is fully configurable. Line style: solid, dashed (default) or dotted. Extension: lines extend to the right up to a configurable offset, keeping labels ahead of price. Labels can be shown or hidden and carry the level name and its price. Each period has its own configurable color, and a Dark/Light theme blends with the background. In the Levels block you toggle the day, week, month, year and the 50% midpoint; the defaults are calibrated for intraday, showing the day's and week's levels.
ALERTS
Four predefined alerts cover the key crosses: Cross above PDH and Cross below PDL on the day levels, Cross above PWH and Cross below PWL on the week levels. Clearing the PDH or PWH indicates strength and possible continuation; losing the PDL or PWL, weakness. It pays to tell a genuine cross that holds from a sweep that re-enters the range, a nuance read better by pairing the level with price's reaction.
HOW TO READ IT
Use the levels as support and resistance: while price ranges between the PDH and PDL it is inside yesterday's range, and breaking them opens the way, with the weekly levels as a higher-grade frame. Read the cross as a strength signal — a decisive close above a previous extreme is strength, losing it is weakness — and watch for confluence, where a day level meets a week level and gains weight. The 50% midpoint, when enabled, flags the range's equilibrium. And combined with the Edolab structure indicators, which read swings, order blocks and liquidity zones, these levels place those reads inside a map of firm, universally watched references.
OPEN SOURCE
Edo PDH/PDL Levels is published as a free open source indicator. The full Pine Script is publicly accessible on TradingView for study, adaptation and integration into any workflow. Part of the Edolab Markets free open source tools ecosystem, available on TradingView.
This indicator is a technical analysis tool for educational and informational purposes only. It does not generate automatic buy or sell signals and should not be considered financial advice. Trading financial markets involves significant risk of capital loss. Past performance does not guarantee future results. Always use proper risk management.
สคริปต์แบบโอเพนซอร์ส
ด้วยเจตนารมณ์หลักของ TradingView ผู้สร้างสคริปต์นี้ได้ทำให้เป็นโอเพนซอร์ส เพื่อให้เทรดเดอร์สามารถตรวจสอบและยืนยันฟังก์ชันการทำงานของมันได้ ขอชื่นชมผู้เขียน! แม้ว่าคุณจะใช้งานได้ฟรี แต่โปรดจำไว้ว่าการเผยแพร่โค้ดซ้ำจะต้องเป็นไปตาม กฎระเบียบการใช้งาน ของเรา

EdoLab Markets – Precision Trading Tools
Get Exclusive Indicators:
edolab.io
All content provided is for informational and educational purposes only. Past performance does not guarantee future results.
Get Exclusive Indicators:
edolab.io
All content provided is for informational and educational purposes only. Past performance does not guarantee future results.
คำจำกัดสิทธิ์ความรับผิดชอบ
ข้อมูลและบทความไม่ได้มีวัตถุประสงค์เพื่อก่อให้เกิดกิจกรรมทางการเงิน, การลงทุน, การซื้อขาย, ข้อเสนอแนะ หรือคำแนะนำประเภทอื่น ๆ ที่ให้หรือรับรองโดย TradingView อ่านเพิ่มเติมใน ข้อกำหนดการใช้งาน
สคริปต์แบบโอเพนซอร์ส
ด้วยเจตนารมณ์หลักของ TradingView ผู้สร้างสคริปต์นี้ได้ทำให้เป็นโอเพนซอร์ส เพื่อให้เทรดเดอร์สามารถตรวจสอบและยืนยันฟังก์ชันการทำงานของมันได้ ขอชื่นชมผู้เขียน! แม้ว่าคุณจะใช้งานได้ฟรี แต่โปรดจำไว้ว่าการเผยแพร่โค้ดซ้ำจะต้องเป็นไปตาม กฎระเบียบการใช้งาน ของเรา
EdoLab Markets – Precision Trading Tools
Get Exclusive Indicators:
edolab.io
All content provided is for informational and educational purposes only. Past performance does not guarantee future results.
Get Exclusive Indicators:
edolab.io
All content provided is for informational and educational purposes only. Past performance does not guarantee future results.
คำจำกัดสิทธิ์ความรับผิดชอบ
ข้อมูลและบทความไม่ได้มีวัตถุประสงค์เพื่อก่อให้เกิดกิจกรรมทางการเงิน, การลงทุน, การซื้อขาย, ข้อเสนอแนะ หรือคำแนะนำประเภทอื่น ๆ ที่ให้หรือรับรองโดย TradingView อ่านเพิ่มเติมใน ข้อกำหนดการใช้งาน