ICT Fractal Model, HTF Candles, CISD & C2 Targets [LunqFX]
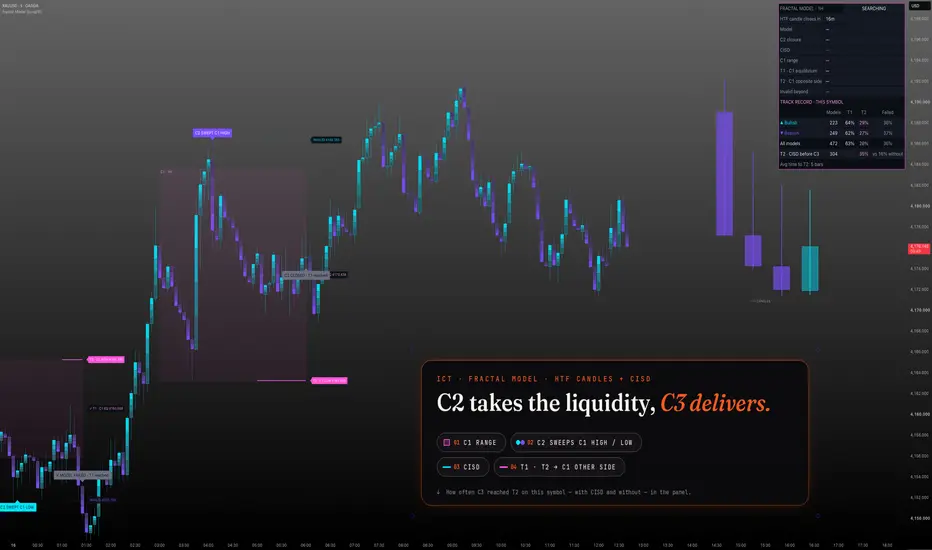
ICT Fractal Model draws higher-timeframe (HTF) candles next to your chart and tracks the multi-timeframe fractal model on them from start to finish: candle 2 sweeps the high or low of candle 1 and closes back inside its range, and candle 3 is expected to expand to the other side. On your own timeframe the script confirms the move with a change in state of delivery (CISD), projects the targets of candle 1, and keeps a record of how often the model reached them on this symbol.
Most HTF candle and CISD indicators show one piece of the model — the higher-timeframe candles, or the CISD, or the candle 2 closure — and leave you to connect them. This one runs the whole sequence — liquidity sweep, CISD, candle 2 closure, candle 3 expansion — as one model, files every finished model as a result, and answers the question that decides whether the model is worth trading on your market: how often did candle 3 actually reach the other side of candle 1 here — with a CISD, and without one.
❶ THE MODEL, STEP BY STEP ① C1 — the last finished higher-timeframe candle. Its range is drawn as a pink box. ② C2 SWEEPS C1 — the candle now forming trades beyond C1's low (bullish model) or high (bearish model). The sweep is labelled on the chart and the deepest point is followed live. ③ CISD — on the chart timeframe, a close beyond the open of the run of candles that delivered price into the sweep. It is the first sign that delivery has turned. Drawn as a line labelled CISD. ④ C2 CLOSES INSIDE C1 — when candle 2 closes back inside candle 1's range, the model is confirmed and candle 3 begins. If candle 2 closes beyond C1, or takes both sides of it, it is not a fractal model and the drawings are removed. ⑤ C3 EXPANDS — candle 3 is expected to run to the opposite side of C1.
❷ TARGETS AND INVALIDATION ▸ T1 · C1 EQ — the middle of candle 1 ▸ T2 · C1 HIGH / LOW — the opposite side of candle 1; reaching it completes the model ▸ INVALID — the C2 sweep extreme. If price trades beyond it, the model fails. The model is resolved when T2 is reached, when it fails, or when candle 3 closes. Each target gets a ✓ when it trades; when the C2 close is already past the equilibrium, T1 is ticked at confirmation.
❸ HTF CANDLES ON THE RIGHT The last higher-timeframe candles are drawn to the right of price, with the forming one on the far right. While a model is in play they are tagged C1, C2 and C3, so you always see where you are in the sequence without switching timeframes. Separators mark where each HTF candle begins.
❹ THE TRACK RECORD Every confirmed model is filed by direction. The panel shows, for bullish, bearish and all models on this symbol: the number of models, the share that reached T1, the share that reached T2, and the share that failed. A separate row compares models that printed a CISD before candle 2 closed with models that did not — so you can see whether waiting for the CISD actually helped on this market. A CISD that only appears during candle 3 is drawn but not counted: price moving toward T2 would print one almost every time, and counting it would flatter the CISD. The average time to T2 is shown underneath.
❺ THE PANEL ▸ The higher timeframe in use and the time until its candle closes ▸ Model direction and stage ▸ C2 closure status and the CISD level (waiting or ✓) ▸ C1 range, T1, T2 and the invalidation level ▸ The track record table
❻ HOW TO USE IT
Use a classic pairing — the Auto setting does it for you: 1m → 15m, 5m → 1H, 15m and 30m → 4H, 1H → Daily, 4H → Weekly, Daily → Monthly.
Watch for "C2 SWEEPS C1". The sweep alone is not the model.
Look for the CISD on your timeframe, and for candle 2 to close back inside C1.
Once confirmed, T1 and T2 are the draw for candle 3. Check the track record first: it shows how often T2 is reached on this symbol, with and without a CISD.
Works on forex, gold (XAUUSD), index CFDs and crypto. It fits any smart money concepts workflow as the higher-timeframe context for your own entries.
Tip: switch "Require C2 to close back inside C1" off to also accept a candle 2 that closes beyond C1 after the sweep — more models, and more failed ones. Settings → Model.
❼ SETTINGS Model ▸ Higher timeframe — Auto (recommended) or a fixed 15m, 1H, 4H, Daily or Weekly ▸ Require C2 to close back inside C1 — on by default; off also accepts a candle 2 that closes beyond C1. The model is still confirmed when candle 2 closes, and a candle 2 that takes both sides of C1 never counts. Drawing ▸ HTF candles on the right and how many are shown ▸ HTF candle separators ▸ Targets and invalidation ▸ Models drawn — how many finished models stay on the chart; the track record keeps all of them ▸ Label size Panel ▸ Show panel · position · text size Alerts ▸ C1 swept · CISD · Model confirmed · Target hit / complete / failed Visuals ▸ Neon candles — aqua rising, ultraviolet falling; C1 and the targets in neon pink. Off = your own chart candles. ▸ Glow candles — each body brightens towards the close. Off = flat neon bodies.
❽ ALERTS ▸ C1 swept — the forming HTF candle took C1's high or low ▸ CISD — with the level ▸ Model confirmed — C2 closed inside C1, with T1, T2 and the invalidation level ▸ Target hit, model complete, model failed Create the alert with "Any alert() function call" for the full messages, or use the five alert conditions.
❾ NON-REPAINTING The higher-timeframe candles are built from the chart's own closed bars, so they match what you see and never change after the fact. Every sweep, CISD, confirmation, target hit and failure is decided on a closed bar. The script does not use request.security or lookahead.
LIMITATIONS ▸ The higher timeframe must be above the chart timeframe; if it is not (for example a fixed 1H on a 4H chart, or a monthly chart), the panel shows a notice instead. ▸ HTF candles are built from the bars loaded on your chart. On symbols with session gaps, the first HTF candle after a gap can differ slightly from the one on the higher-timeframe chart. ▸ CISD is defined here as a close beyond the open of the candle run that delivered the sweep. Other traders define it differently. ▸ One model is tracked at a time. A sweep that happens while a model is running is not tracked. ▸ The track record covers only the history loaded on your chart. Small samples are noisy — check the "Models" column before trusting a percentage. Past rates are not a forecast. ▸ The model gives a structure and targets, not an entry. It has no stop loss or position sizing; combine it with your own entry rules and risk management.
This script is for educational purposes only and is not financial advice. Trading involves risk.
Most HTF candle and CISD indicators show one piece of the model — the higher-timeframe candles, or the CISD, or the candle 2 closure — and leave you to connect them. This one runs the whole sequence — liquidity sweep, CISD, candle 2 closure, candle 3 expansion — as one model, files every finished model as a result, and answers the question that decides whether the model is worth trading on your market: how often did candle 3 actually reach the other side of candle 1 here — with a CISD, and without one.
❶ THE MODEL, STEP BY STEP ① C1 — the last finished higher-timeframe candle. Its range is drawn as a pink box. ② C2 SWEEPS C1 — the candle now forming trades beyond C1's low (bullish model) or high (bearish model). The sweep is labelled on the chart and the deepest point is followed live. ③ CISD — on the chart timeframe, a close beyond the open of the run of candles that delivered price into the sweep. It is the first sign that delivery has turned. Drawn as a line labelled CISD. ④ C2 CLOSES INSIDE C1 — when candle 2 closes back inside candle 1's range, the model is confirmed and candle 3 begins. If candle 2 closes beyond C1, or takes both sides of it, it is not a fractal model and the drawings are removed. ⑤ C3 EXPANDS — candle 3 is expected to run to the opposite side of C1.
❷ TARGETS AND INVALIDATION ▸ T1 · C1 EQ — the middle of candle 1 ▸ T2 · C1 HIGH / LOW — the opposite side of candle 1; reaching it completes the model ▸ INVALID — the C2 sweep extreme. If price trades beyond it, the model fails. The model is resolved when T2 is reached, when it fails, or when candle 3 closes. Each target gets a ✓ when it trades; when the C2 close is already past the equilibrium, T1 is ticked at confirmation.
❸ HTF CANDLES ON THE RIGHT The last higher-timeframe candles are drawn to the right of price, with the forming one on the far right. While a model is in play they are tagged C1, C2 and C3, so you always see where you are in the sequence without switching timeframes. Separators mark where each HTF candle begins.
❹ THE TRACK RECORD Every confirmed model is filed by direction. The panel shows, for bullish, bearish and all models on this symbol: the number of models, the share that reached T1, the share that reached T2, and the share that failed. A separate row compares models that printed a CISD before candle 2 closed with models that did not — so you can see whether waiting for the CISD actually helped on this market. A CISD that only appears during candle 3 is drawn but not counted: price moving toward T2 would print one almost every time, and counting it would flatter the CISD. The average time to T2 is shown underneath.
❺ THE PANEL ▸ The higher timeframe in use and the time until its candle closes ▸ Model direction and stage ▸ C2 closure status and the CISD level (waiting or ✓) ▸ C1 range, T1, T2 and the invalidation level ▸ The track record table
❻ HOW TO USE IT
Use a classic pairing — the Auto setting does it for you: 1m → 15m, 5m → 1H, 15m and 30m → 4H, 1H → Daily, 4H → Weekly, Daily → Monthly.
Watch for "C2 SWEEPS C1". The sweep alone is not the model.
Look for the CISD on your timeframe, and for candle 2 to close back inside C1.
Once confirmed, T1 and T2 are the draw for candle 3. Check the track record first: it shows how often T2 is reached on this symbol, with and without a CISD.
Works on forex, gold (XAUUSD), index CFDs and crypto. It fits any smart money concepts workflow as the higher-timeframe context for your own entries.
Tip: switch "Require C2 to close back inside C1" off to also accept a candle 2 that closes beyond C1 after the sweep — more models, and more failed ones. Settings → Model.
❼ SETTINGS Model ▸ Higher timeframe — Auto (recommended) or a fixed 15m, 1H, 4H, Daily or Weekly ▸ Require C2 to close back inside C1 — on by default; off also accepts a candle 2 that closes beyond C1. The model is still confirmed when candle 2 closes, and a candle 2 that takes both sides of C1 never counts. Drawing ▸ HTF candles on the right and how many are shown ▸ HTF candle separators ▸ Targets and invalidation ▸ Models drawn — how many finished models stay on the chart; the track record keeps all of them ▸ Label size Panel ▸ Show panel · position · text size Alerts ▸ C1 swept · CISD · Model confirmed · Target hit / complete / failed Visuals ▸ Neon candles — aqua rising, ultraviolet falling; C1 and the targets in neon pink. Off = your own chart candles. ▸ Glow candles — each body brightens towards the close. Off = flat neon bodies.
❽ ALERTS ▸ C1 swept — the forming HTF candle took C1's high or low ▸ CISD — with the level ▸ Model confirmed — C2 closed inside C1, with T1, T2 and the invalidation level ▸ Target hit, model complete, model failed Create the alert with "Any alert() function call" for the full messages, or use the five alert conditions.
❾ NON-REPAINTING The higher-timeframe candles are built from the chart's own closed bars, so they match what you see and never change after the fact. Every sweep, CISD, confirmation, target hit and failure is decided on a closed bar. The script does not use request.security or lookahead.
LIMITATIONS ▸ The higher timeframe must be above the chart timeframe; if it is not (for example a fixed 1H on a 4H chart, or a monthly chart), the panel shows a notice instead. ▸ HTF candles are built from the bars loaded on your chart. On symbols with session gaps, the first HTF candle after a gap can differ slightly from the one on the higher-timeframe chart. ▸ CISD is defined here as a close beyond the open of the candle run that delivered the sweep. Other traders define it differently. ▸ One model is tracked at a time. A sweep that happens while a model is running is not tracked. ▸ The track record covers only the history loaded on your chart. Small samples are noisy — check the "Models" column before trusting a percentage. Past rates are not a forecast. ▸ The model gives a structure and targets, not an entry. It has no stop loss or position sizing; combine it with your own entry rules and risk management.
This script is for educational purposes only and is not financial advice. Trading involves risk.

Trade setups with clear entry, stop, target and risk logic. Built for traders who want structure, not guessing.
💬 t.me/lunqfx
🌐 lunqfx.com/premium
💬 t.me/lunqfx
🌐 lunqfx.com/premium
คำจำกัดสิทธิ์ความรับผิดชอบ
ข้อมูลและบทความไม่ได้มีวัตถุประสงค์เพื่อก่อให้เกิดกิจกรรมทางการเงิน, การลงทุน, การซื้อขาย, ข้อเสนอแนะ หรือคำแนะนำประเภทอื่น ๆ ที่ให้หรือรับรองโดย TradingView อ่านเพิ่มเติมใน ข้อกำหนดการใช้งาน
Trade setups with clear entry, stop, target and risk logic. Built for traders who want structure, not guessing.
💬 t.me/lunqfx
🌐 lunqfx.com/premium
💬 t.me/lunqfx
🌐 lunqfx.com/premium
คำจำกัดสิทธิ์ความรับผิดชอบ
ข้อมูลและบทความไม่ได้มีวัตถุประสงค์เพื่อก่อให้เกิดกิจกรรมทางการเงิน, การลงทุน, การซื้อขาย, ข้อเสนอแนะ หรือคำแนะนำประเภทอื่น ๆ ที่ให้หรือรับรองโดย TradingView อ่านเพิ่มเติมใน ข้อกำหนดการใช้งาน