HS SP500 1.6x Long Benchmark
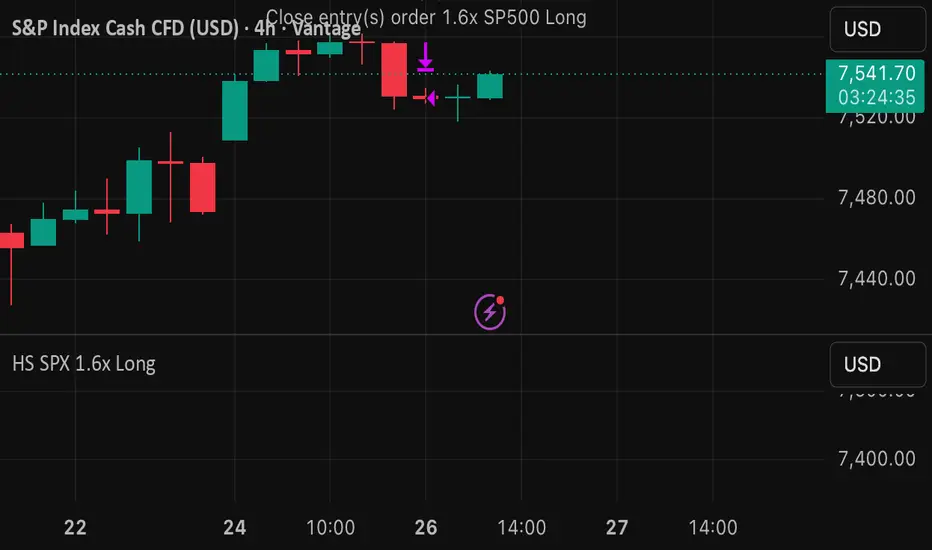
Long-only SP500 benchmark strategy using 160% notional exposure.
This is not a predictive trading signal. It is a transparent leveraged benchmark designed to compare 1.6x long SP500 exposure against TradingView’s Buy & Hold benchmark over the same historical window.
Backtest target used:
VANTAGE:SP500, 4h, Mar 16, 2018 to May 26, 2026.
The strategy models:
160% of equity position sizing, 0.075% commission, 2 ticks slippage, and 50% long margin.
Expected behavior: if applied to the same SP500 chart and date window, it should outperform 1x Buy & Hold by roughly the leverage factor, while also carrying larger drawdowns and margin risk.

คำจำกัดสิทธิ์ความรับผิดชอบ
ข้อมูลและบทความไม่ได้มีวัตถุประสงค์เพื่อก่อให้เกิดกิจกรรมทางการเงิน, การลงทุน, การซื้อขาย, ข้อเสนอแนะ หรือคำแนะนำประเภทอื่น ๆ ที่ให้หรือรับรองโดย TradingView อ่านเพิ่มเติมใน ข้อกำหนดการใช้งาน
คำจำกัดสิทธิ์ความรับผิดชอบ
ข้อมูลและบทความไม่ได้มีวัตถุประสงค์เพื่อก่อให้เกิดกิจกรรมทางการเงิน, การลงทุน, การซื้อขาย, ข้อเสนอแนะ หรือคำแนะนำประเภทอื่น ๆ ที่ให้หรือรับรองโดย TradingView อ่านเพิ่มเติมใน ข้อกำหนดการใช้งาน